Admin tales: chasing the fragmentation of tunnels in the overlay network
Lyrical introduction
When administrators encounter an unexpected problem (it used to work, and, suddenly, after the update, it stopped), they have two possible behavior algorithms: fight or flight. That is, either understand the problem to the bitter end, or run away from the problem without delving into its essence. In the context of software updates - roll back.
Rolling back after an unsuccessful upgrade is, one might say, a sad best practice. There are whole guides how to prepare for a rollback, how to carry them out, and what to do if you failed to roll back. The whole industry of cowardly behavior.
An alternative way - to understand to the last. This is a very difficult path, in which no one promises success, the amount of effort spent will be incomparable with the result, and the output will be only a little more understanding of what happened.
')
Plot drama
Cloud "Instant Servers" Webzilla. Routine update of nova-compute host. New live image (we use PXE-loading), the spent chef. All is well. Suddenly, a complaint from a client: “one of the virtual loops works strange, it seems to work, but as the real load begins, everything stops.” Client instances are transferred to another node, client problem is solved. Our problem begins. Run the instance on this node. Picture: Cirros ssh login is successful, on Ubuntu it hangs. ssh -v shows that everything stops at the “debug1: SSH2_MSG_KEXINIT sent” stage.
All possible external debugging methods work - the metadata is obtained, the DHCP lease is updated by the instance. There is a suspicion that the instance does not receive the DHCP option from the MTU. Tcpdump indicates that the option is being sent, but it is not known whether the instance accepts it.
We really want to go to the instance, but on the Cirros, where we can go, the MTU is correct, and on Ubuntu, for which there is a suspicion about the problem of MTU, we just can not get. But really want.
If this is a problem with MTU, then we have a sudden assistant. This is IPv6. With the fact that we don’t select white IPv6 (sorry, it’s not yet production-ready in openstack), link-local IPv6 is working.
Open two consoles. One to the network node. We penetrate the network namespace:
sudo stdbuf -o0 -e0 ip net exec qrouter-271cf1ec-7f94-4d0a-b4cd-048ab80b53dc / bin / bash
(stdbuf allows you to disable buffering from ip net, so the output to the screen appears in real time, and not with a delay, ip net exec executes the code in the specified network namespace, bash gives us a shell).
On the second console, open the compute-node, cling to tcpdump to tap our ubuntu tap:
tcpdump -ni tap87fd85b5-65 .From inside the namespace, we make a request for an all-nodes link-local multicast (this article is not about ipv6, but briefly what is happening: each node has an automatically generated ipv6 address starting with FE80 ::, besides, each node listens on multicast addresses and responds to requests for them. Depending on the role of the node, the multicast list is different, but each node, at least, responds to all-nodes, that is, to the address FF02 :: 1). So, do a multicast ping:
 ping6 -I qr-bda2b276-72 ff02 :: 1
 PING ff02 :: 1 (ff02 :: 1) from fe80 :: f816: 3eff: fe0a: c6a8 qr-bda2b276-72: 56 data bytes
 64 bytes from fe80 :: f816: 3eff: fe0a: c6a8: icmp_seq = 1 ttl = 64 time = 0.040 ms
 64 bytes from fe80 :: f816: 3eff: fe10: 35e7: icmp_seq = 1 ttl = 64 time = 0.923 ms (DUP!)
 64 bytes from fe80 :: f816: 3eff: fe4a: 8bca: icmp_seq = 1 ttl = 64 time = 1.23 ms (DUP!)
 64 bytes from fe80 :: 54e3: 5eff: fe87: 8637: icmp_seq = 1 ttl = 64 time = 1.29 ms (DUP!)
 64 bytes from fe80 :: f816: 3eff: feec: 3eb: icmp_seq = 1 ttl = 255 time = 1.43 ms (DUP!)
 64 bytes from fe80 :: f816: 3eff: fe42: 8927: icmp_seq = 1 ttl = 64 time = 1.90 ms (DUP!)
 64 bytes from fe80 :: f816: 3eff: fe62: e6b9: icmp_seq = 1 ttl = 64 time = 2.01 ms (DUP!)
 64 bytes from fe80 :: f816: 3eff: fe4d: 53af: icmp_seq = 1 ttl = 64 time = 3.66 ms (DUP!)
The question arises - who is who? Take turns trying to go uncomfortable and long.
Next to us in the next window is tcpdump, listening to the interface of the instance we are interested in. And we see in it the answer only from one IP - the IP we are interested in. This turns out to be fe80 :: f816: 3eff: feec: 3eb.
Now we want to connect via ssh to this node. But anyone who has tried the
ssh fe80::f816:3eff:feec:3eb is in for a surprise - "Invalid argument".The reason is that link-local addresses cannot be used “just like that,” they only make sense within a link (interface). But ssh does not have the option “use such outgoing IP / interface such and such”! Fortunately, there is an option to specify the interface name in the IP address.
We do
ssh fe80::f816:3eff:feec:3eb% qr-bda2b276-72 - and find ssh fe80::f816:3eff:feec:3eb% qr-bda2b276-72 . Yes, yes, I understand your indignation and bewilderment (if you do not have it, you are not a real geek, or you have many years of working with IPv6). “Fe80 :: f816: 3eff: feec: 3eb% qr-bda2b276-72” is such an “IP address”. I do not have enough language to convey the degree of sarcasm in these quotes. IP address with percent and interface name. I wonder what will happen if someone uploads his avatar something like http: // [fe80 :: f816: 3eff: feec: 3eb% eth1] /secret.file from a server in a web server on a site ...... And we find ourselves on the virtual. Why? Because IPv6 is better than IPv4 is able to handle bad MTU situations, thanks to the obligatory PMTUD . So, we on a virtualka.
I expect to see the wrong MTU value, go to cloud-init logs and figure out why. But here is a surprise - MTU is correct. Oops.
In the wilds of debugging
Suddenly, the problem of the local and understandable becomes completely incomprehensible. The MTU is correct, and the packets are dropped. ... But if you think carefully, then from the very beginning the problem was not so simple - the instance migration should not have changed the MTU.
A painful debugging begins. Armed with tcpdump, ping and two instances (plus the network namespace on the network node), we understand:
- Locally, two instances on the same compute each other ping with a maximum size ping.
- The instance from the network node does not ping (here and below - with a ping of the maximum size)
- Network node instances on other computers pings.
- Close attention to the tcpdump inside the instance shows that when the network node pings the instance, it sees and responds with the ping.
Oops. A large package comes, but is lost on the way back. I would say asymmetric routing, but what the hell is the routing when they are in the neighboring ports of the switch?
Close attention to the answer: the answer is visible on the instance. The answer is visible on tap'e. But the answer is not visible in the network namespace. And how are things going with mtu and packages between a network node and a computer? (internally, I already triumph, they say, I found the problem). Rraz - and (big) pings go.
What (and a long bewildered pause).
What next to do is not clear. Returning to the original problem. MTU is bad. And which MTU is good? Begin to experiment. Bisection: minus 14 bytes from the previous value. Minus fourteen bytes. Why on earth? After software upgrade? I do vimdiff on the list of packages, I find a pleasant perspective to deal with about 80 updated packages, including the kernel, ovs, libc, and a lot of libs. So, two ways of retreat: lower the MTU by 14 bytes, or roll back and tremble over any update.
Let me remind you that the problem was reported by the client, not by monitoring. Since MTU is a client setting, the “failure of large packets with the DF flag” is not really an infrastructure issue. That is not a problem of infrastructure at all. That is, if it is caused not by an upgrade, but by an upcoming solar eclipse and yesterday's rain, then we will not even know about the return of the problem until someone complains. Tremble over the update and fear the unknown about what you do not know in advance? Thank you, the prospect I have dreamed of all my professional life. And even if we lower the MTU, then why fourteen bytes? And if tomorrow will be twenty? Or oil will be cheaper up to 45? How to live with it?
However, we check. Indeed, the MTU is slightly lower in the DHCP options, and the instance that rebooted works fine. But this is not an option. WHY?
We start everything from the beginning. We return the old MTU, trace the tcpdump packet again: the answer is visible on the instance interface, on the tap'e ... We look at the tcpdump on the node's network interface. A bunch of small annoying flood, but with the help of grep we see that requests come (inside GRE), but the answers do not go back.
Aha!
At least it can be seen that it is lost somewhere in the process. But where? I decide to compare behavior with live node. But the trouble is, on the "live" node tcpdump shows us the packets. Thousands of them. In millisecond. Welcome to the tengigabitethernet era. Grep allows you to catch something from this flood, but you will not be able to get a normal dump, and the performance of such a design raises questions.
Focusing on the problem: I do not know how to filter traffic using tcpdump. I know how to filter by source, dest, port, proto, etc., but I don’t know how to filter a packet by IP address inside GRE. Moreover, it is pretty bad for Google.
Until a certain point, I ignored this question, believing that repairing is more important, but the lack of knowledge began to bite very painfully. A colleague ( kevit , whom I drew to the question, dealt with him. Sent the link
tcpdump -i eth1 'proto gre and ( ip[58:4] = 0x0a050505 or ip[62:4] = 0x0a050505 )' .Wow Hardcore 0xhex in my web-binary cloud singularities. Well. You can live.
Unfortunately, the rule did not work properly or did not work. Having grabbed the idea, I caught the required offsets with the brute force method: 54 and 58 for the source and dest IP addresses. Although kevit showed where he took the bias - and it looked damn convincing. IP header, GRE, IP header.
An important achievement: I had a tool for precision viewing of single bags in a multi-gigabyte flood. Looking at the packages ... Anyway, nothing is clear.
Tcpdump is our friend, but wireshark is more convenient. (I know about tshark, but it is also uncomfortable). We make a package dump (tcpdump -w dump, now we can do it), take it to our car and start to figure it out. I decided for myself to deal with the displacements (of general corrosiveness). Open in wireshark and see ...
We look at the size of the headers and make sure that the correct offset for the start of the IP packet is 42, not 46. Having written this error to someone's inattention, I decided to continue to sort it out the next day, and went home.
Already somewhere very close to the house it dawned on me. If the initial assumptions about the structure of the headers are incorrect, then this means that the overhead from GRE is different when tunneling.
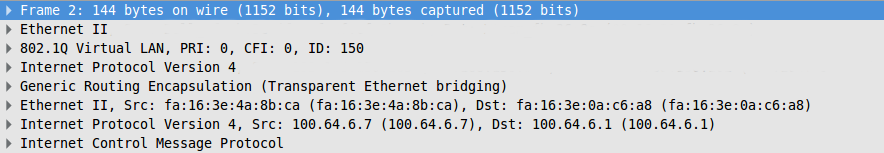
Ethernet header, vlan, IP header, GRE header, encapsulated IP packet ...
Stop. But the picture has a completely different title. GRE neutrons are not encapsulated by IP packets, but by ethernet frames. In other words, the initial assumptions about what part of the MTU eats off the GRE itself are wrong. GRE “takes” 14 bytes more than we expected.
The neutron builds an overlay network over IP using GRE, and this is an L2 network. Of course, there should be encapsulated ethernet headers.
That is, the MTU should be 14 bytes less. From the very beginning. When we planned the network, the assumptions about lowering the MTU due to the GRE, we made a mistake. Pretty serious, as it caused packet fragmentation.
Ok, with an error is understandable. But why after the update did it stop working? According to previous surveys, it became clear that the problem is related to MTU, incorrect accounting for the GRE header and GRE fragmentation. Why did fragmented packets stop running?
Attentive and careful tcpdump showed the answer: GRE began to be sent with the DNF (do not fragment) flag. The flag appeared only on GRE packets that encapsulated IP packets with the DNF flag inside, that is, the flag was copied to the GRE from its payload.
For greater certainty, I looked at the old nodes - they fragmented the GRE. There was a main packet, and a tail with 14 bytes of payload. That's a blooper ...
It remains to find out why it started after the upgrade.
Reading documentation
The most suspicious regression packages were Linux and Openvswitch. Readme / changelog / news did not clarify anything special, but the inspection of git (and that's the answer, why we need open source code — to have access to the Documentation) revealed something extremely curious:
 commit bf82d5560e38403b8b33a1a846b2fbf4ab891af8
 Author: Pravin B Shelar <pshelar@nicira.com>
 Date: Mon Oct 13 02:02:44 2014 -0700

     datapath: compat: Fix compilation 3.11

     Kernel 3.11 is only kernel where GRE APIs are available but
     not vxlan.  Add check for vxlan xmit to detect this case.
The patch itself does not represent anything of interest and does not concern the essence of the matter, but it gives a hint: the GRE API in the kernel. And we had an upgrade from 3.8 to 3.13. We google in bing ... We find a patch in the openvswitch (datapath module), in the kernel: git.kernel.org/cgit/linux/kernel/git/torvalds/linux.git/commit/?id=aa310701e787087dbfbccf1409982a96e16c57a6 . In other words, as soon as our kernel starts providing GRE services, the openvswitch kernel module transfers gre processing to the ip_gre kernel module. We study the ip_gre.c code, thanks for the comments in it, yes, we all "love" tsiska.
Here is a treasured line:
static int ipgre_fill_info(struct sk_buff *skb, const struct net_device *dev) { struct ip_tunnel *t = netdev_priv(dev); struct ip_tunnel_parm *p = &t->parms; if (nla_put_u32(skb, IFLA_GRE_LINK, p->link) || .... nla_put_u8(skb, IFLA_GRE_PMTUDISC, !!(p->iph.frag_off & htons(IP_DF)))) In other words, the kernel copies IP_DF from the header of the encapsulated packet.
(Sudden interesting offtopic: Linux copies TTL from the original package as well, that is, the GRE tunnel "inherits" TTL from the encapsulated package)
Dry squeeze
During the initial setup of the installation, we set the MTU for the virtual machines as part of an erroneous assumption. Due to the fragmentation mechanism, we got off with a slight performance degradation. After upgrading the kernel from 3.8 to 3.13, OVS switched to the nuclear module ip_gre.c, which copies the do not fragment flag from the original IP packet. Large packages that were not “trapped” in MTU after the title was written to them were no longer fragmented, but dropped. Due to the dropping of GRE, and not the packet embedded in it, none of the parties to the TCP session (sending packets) received ICMP notifications about "obstruction", that is, could not adapt to a smaller MTU. IPv6, in its turn, did not count on the presence of fragmentation (it is not in IPv6) and handled the loss of large packets in the right way - reducing the size of the packet.
Who is to blame and what to do?
Blame we - mistakenly put MTU. The barely noticeable behavior in the software caused the error to start disrupting IPv4.
What to do? We corrected the MTU in the settings of dnsmasq-neutron.conf (option
dhcp-option-force=26, ), gave the clients to "settle" (update the address lease via DHCP, along with the option), the problem is completely eliminated.Can this be detected proactively by monitoring? To tell you honestly, I don’t see any reasonable options - it’s too thin and complicated diagnostics that require extreme cooperation from client instances (we cannot rely on it - all of a sudden, someone, by his own needs, will register something strange using iptables?) .
Lyric conclusion
Instead of a cowardly roll back to the previous version of the software and take the position “work - do not touch”, “I don’t know what will change if we update, so we’ll never be updated”, approximately 2 people were spent on debugging, but not only local (visible) regression was solved, but an error was found and fixed in the existing configuration, which increased the overhead of the network. In addition to eliminating the problem, the understanding of the technologies used has also significantly improved, a technique for debugging network problems has been developed (filtering traffic in tcpdump by fields within GRE).
Comments - power
Suddenly, in the comments ildarz suggested a great idea how to find one like this - look at IP statistics and react to the growth of the number of fragments (/ proc / net / snmp, netstat -s). I have not yet studied this issue, but it looks very promising.
Source: https://habr.com/ru/post/252881/
All Articles