Own Flash on HTML5: the union of vector images (part 1)
 Once upon a time, in a far-away galaxy (that is, more than a year ago and beyond the default city), one web programmer decided to write his Flash (he was not without delusions of grandeur, of course). The task then seemed difficult and very interesting. This article will discuss one of the problems that stood in his way.
Those who drew in Flash know that in it the figures (shaded areas) within one layer never overlap, and the lines are always drawn over the shaded figures. This approach has, in my opinion, a good plus - you have what you see on the image. However, when writing a vector editor, this leads to the need to solve the problem of correctly superimposing drawn objects (lines and filled shapes) onto existing ones. Below I will try to show in stages how this can be done.
Please take into consideration!
This article is an attempt to describe the solution, as the author sees it. Far from perfect. The author will be grateful for useful thoughts about the improvement of the algorithm.

For simplicity, hereinafter I will call polygons shaded areas bounded by straight lines and quadratic Bezier curves. As a rule, when mentioning edges , I will keep in mind the visible drawn straight or curved lines (stroke lines).
Initial data
So, we have two images that we want to combine. Each is defined by a set of edges and polygons.
')
Here is what we know about the ribs:
- may be straight line segments;
- may be Bezier curves;
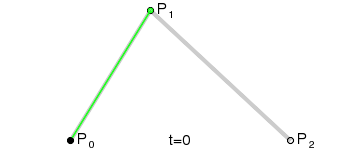 The quadratic Bezier curve is the simplest case when the curve has one control point and, in fact, is drawn inside the triangle defined by its three vertices. Excellent illustration from Wikipedia:
 - each edge has its own color;
- no two edges intersect (but they can, of course, have a common starting or ending point);
- no two edges match.
So, on the right you can see 5 edges: two blue and three dark yellow.
But what we know about landfills:

- limited to straight or curved segments;
- never intersect;
- can adjoin each other, i.e. have a common border (in this case, the colors of the polygons should be different, or the border should be explicitly highlighted with edges; thus, there should not be polygons that nothing prevents to unite into one);
- have their own fill option (in the simplest case - color);
- can be translucent (color can be set with indication of alpha channel);
- may be non-convex;
- may have “holes” (i.e., areas defined by straight / curved segments where there is no fill).
In the light of the fact that a polygon is a complex object, we will describe it as a closed outer contour + a set of internal non-intersecting contours that define holes.
Subtasks
It is clear that finding the union of two vector images is a difficult task, and therefore it is worth splitting it into several subtasks. Here's what I got:
- searching for intersections of all segments of one image with segments of another and splitting these segments by the points found;
- search for all contours (closed chains of segments) on the union of segments of two images;
- determining the presence / absence of the fill and its color for each contour with respect to each of the two images;
- removal of all edges of the original image, which are completely inside the shaded areas of the overlay image;
- removal from the original image of all polygons present in the overlay image without taking into account the color;
- adding to the edges and polygons of the original image of all the edges and polygons of the overlay image (in this case, the coinciding edges of the original image are rubbed with the edges of the overlay);
- the union on the original image of adjacent polygons that have the same fill and do not have a clear separation of the edges.
As a result of all these actions in the original image, we must get the desired result of the union.
I think it is clear that each of the subtasks is a sometimes trivial problem. Therefore, we consider them separately.
Search for the intersection of two segments
We have different segments, so we consider three possible cases separately.
Both segments are straight
As you know, finding the intersection of two straight line segments is not particularly difficult, it’s worth remembering that it is convenient to represent them in a parametric form when calculating (formulas of the form y = kx + b have a fatal disadvantage: they quickly lose accuracy when the segment approaches the vertical position, and for vertical segments require separate consideration):

// M - , S - , D - , t - [0; 1] M1 = S1 + (D1-S1) * t1 // M2 = S2 + (D2-S2) * t2 // // - M1 = M2 - , // t1: Xs1 + (Xd1-Xs1) * t1 = Xs2 + (Xd2-Xs2) * t2 Ys1 + (Yd1-Ys1) * t1 = Ys2 + (Yd2-Ys2) * t2 I will not describe the output of t1 (I think everyone will cope here without much difficulty). After obtaining the value of t1, you need to make sure that it lies in the interval [0; 1] (otherwise, the segments do not intersect), after which you can substitute it in the formula that defines the first segment, thus obtaining the coordinates of the intersection point:
Xm = Xs1 + (Xd1-Xs1) * t1 Ym = Ys1 + (Yd1-Ys1) * t1 Bezier curve and straight line segment
The intersection of a Bezier curve and a straight line is no longer so simple, but it is quite analytically solvable, especially if you guess beforehand to rotate the line and the curve so that the line becomes strictly horizontal:

// P0, P1, P2 - , ; t - [0; 1] M1 = (1-t1)^2 * P0 + 2*t1*(1-t1) * P1 + t1^2 * P2 // // S - , D - M2 = S + (DS) * t2 // // P0, P1, P2, S D a = -atan2(Yd-Ys, Xd-Xs); // // (, (X, Y) (Xn, Yn)) Xn = X*cos(a) - Y*sin(a) Yn = X*sin(a) + Y*cos(a) // ( P0, P1 P2) Xm1 = (1-t1)^2 * Xp0 + 2*t1*(1-t1) * Xp1 + t1^2 * Xp2 Ym1 = (1-t1)^2 * Yp0 + 2*t1*(1-t1) * Yp1 + t1^2 * Yp2 // Y: Xm2 = Xs + (Xd-Xs) * t2 Ym2 = Ys // .. Ys = Yd // M1 = M2, .. Xm1 = Xm2 Ym1 = Ym2 // Y, .. : (1-t1)^2*Yp0 + 2*t1*(1-t1)*Yp1 + t1^2*Yp2 = Ys Solving this quadratic equation, we find the values of t1 (there can be two of them). For each value of t1, as in the case of straight line segments, it is worth making sure that it lies within the limits [0; one]. Substituting the values of t1 in the original (before the rotation) formula of the curve, we obtain the coordinates of the desired points of intersection.
Two Bezier curves
 Analytically calculating the intersection points of two quadratic Bezier curves (there can be up to 4 such points) is not very easy: the complexity is so high that even MathCAD comes to indignation, giving out messages about too long formulas. Also, as far as I understand the situation, in this case you will have to work with complex numbers. Fortunately, there are numerical iterative methods for obtaining the intersection points of arbitrary curves with a given accuracy. Everything is simple:
- if the considered segments have a size less than a given accuracy - we approximate them by straight lines and consider their intersection;
- if at least one of the segments is more accurate - we beat it into two (more or less equal) parts and recursively apply the algorithm for the obtained segments.
Here you can enter optimization: first check whether segments can intersect in principle (for example, using bounding rectangles) and if not, then stop the current recursion branch.

The moment that can cause difficulty is splitting the Bezier curve into two parts (ie, calculating new control points; determine the end point of the first curve, which coincides with the initial point of the second curve, easily substituting t = 0.5 into the curve formula). As it turned out, for this it is enough to calculate the coordinates of the centers of the segments defining the supporting triangle - the obtained points and will be the control points for the new curves. The figure on the left illustrates the solution: the curve (P0, P1, P2) is divided into two curves, the reference triangle of the first one (P0, P1 ', P2') is highlighted in blue. The reference point of the second curve (P2 ', ..., P2) is calculated quite similarly.
To be continued…
PS
- Initially, the author planned only one article on the topic “Union of Vector Images”, but since material turns out a lot, decided to break it apart.
- The author is grateful to Thematic Media for the opportunity to talk about the NanoFL project in Habré.
- For those who get to look at the current version of NanoFL: meanwhile, the implementation of the algorithm contains errors that the author will try to fix for the next version of the program.
Source: https://habr.com/ru/post/251073/
All Articles