Basic statistics: just about complex formulas
Statistics around us
Statistics and data analysis permeate virtually any modern area of knowledge. It is becoming increasingly difficult to draw the line between modern biology, mathematics and computer science. Economic research and regression analysis are almost inseparable. One of the known methods for checking the distribution for normality is the Kolmogorov-Smirnov criterion. Did you know that Kolmogorov made a huge contribution to the development of mathematical linguistics?
While still a student at the psychology department of St. Petersburg State University, I became interested in cognitive psychology. By the way, Immanuel Kant did not consider psychology a science, since he did not see the possibility of applying mathematical methods in it. My current research is devoted to the modeling of mental processes, and I hope that such directions in modern cognitive psychology as computational and connective models would soften his attitude!
Of course, statistics is applied far beyond scientific laboratories: in advertising, marketing, business, medicine, education, etc. But, most interestingly, the basic knowledge of data analysis is extremely useful in everyday life. For example, I think you are all familiar with the concept of arithmetic mean. The average value is very often used in the media when discussing various socio-economic indicators - income, unemployment, etc. In 2005, the British media reported that the average income level of the population not only did not increase, but decreased by 0.2% compared with the previous year. Glimpsed headlines "Incomes declined for the first time since 1990." Some politicians even used this fact, criticizing the current government. However, it is important to understand that the arithmetic average is a good indicator when our symptom has a symmetrical distribution (there are as many rich as the poor). The real distribution of income rather has the following form:
')
Distribution has a pronounced asymmetry: very wealthy people are noticeably less than the middle class. This leads to the fact that in this case the bankruptcy of one of the millionaires can significantly affect this figure. It is much more informative to use the value of the median to describe such data. The median is the salary value, which is in the middle of the income distribution (50% of all observations are less than the median, 50% - more). And, surprisingly, the median income in 2005 in the UK, in contrast to the average, continued to grow. Thus, if you are aware of different types of distribution and different measures of central tendency (mean and median), then it is not so easy to mislead you in such cases as described in the example.
Black box of statistical analysis
As we have already figured out, whatever you plan to do, the probability of encountering the course “mathematical statistics in your field” is gradually approaching unity. However, often classes in introducing statistics do not cause delight among students of non-technical faculties. After a few lessons, it turns out that such basic concepts as, for example, correlation are something like the following:
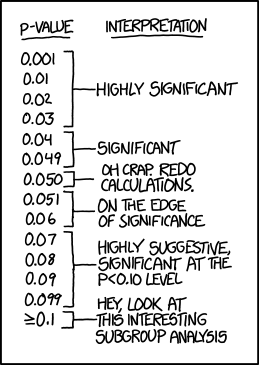
And, desperate to thoroughly understand the origin of these amounts and square roots, the student can begin to perceive the statistics as follows: “if r> 0, then a positive relationship, and if less than 0, then a negative one”; “If p is a significance level less than 0.05, then it is good, if from 0.05 to 0.1, then it is not very good, and if it is more than 0.1, then it is bad.” Helping students to prepare for the exam, not once faced with such spells! Also, of course, no one calculates all these indicators manually, and using, for example, SPSS , you can google step-by-step instructions “how to compare two means” in a second.
- Click here
- Remove / tick here
- p <0.05 -> profit
The statistical analysis begins to resemble a black box: the input is fed to the data, the output is a table of the main results and the value of the p-level of significance (p-value), which will dot all i's.
What are we actually talking about p-value?
Suppose we decided to find out whether there is a relationship between addiction to bloody computer games and aggressiveness in real life. For this, two groups of schoolchildren were formed at random, each consisting of 100 people (1 group - fans of shooters, the second group - not playing computer games). The indicator of aggressiveness is, for example, the number of fights with peers. In our imaginary study, it turned out that a group of schoolchildren-gamers do in fact conflict with their comrades much more frequently. But how do we figure out how statistically significant the differences are? Maybe we got the observed difference completely by accident? To answer these questions, the value of the p-level of significance (p-value) is used - this is the probability of obtaining such or more pronounced differences, provided that in the general population there are actually no differences. In other words, this is the probability of getting such or even stronger differences between our groups, provided that, in fact, computer games do not affect aggression in any way. It sounds not so difficult. However, it is this statistic that is very often interpreted incorrectly.
And now some examples about p-value
So, we compared two groups of schoolchildren among themselves in terms of aggressiveness using a standard t-test (or non-parametric Chi test — a square more relevant in this situation) and found that the cherished p-level of significance is less than 0.05 (for example, 0.04). But what does the obtained value of the p-level of significance actually tell us? So, if p-value is the probability to get such or more pronounced differences, provided that in the general population there are actually no differences, then what, in your opinion, is the true statement:
- Computer games - the cause of aggressive behavior with a probability of 96%.
- The likelihood that aggressiveness and computer games are not related is 0.04.
- If we received a p-level of significance greater than 0.05, this would mean that aggressiveness and computer games are not related to each other.
- The chance to accidentally get such differences is 0.04.
- All statements are incorrect.
If you chose the fifth option, then absolutely right! But, as shown by numerous studies, even people with significant experience in data analysis often misinterpret the value of p-value (for example, you can see this interesting article ).
Let's sort all the answers in order:
- The first statement is an example of a correlation error: the fact of a significant interconnection between two variables does not tell us anything about the causes and consequences. Maybe these are more aggressive people prefer to spend time at computer games, and not at all computer games make people more aggressive.
- This is a more interesting statement. The thing is, we initially take it for granted, that there are really no differences. And, holding it in mind as a fact, we calculate the value of p-value. Therefore, the correct interpretation is: “If we assume that aggressiveness and computer games are in no way connected, then the probability of obtaining such or even more pronounced differences was 0.04”.
- And what if we got insignificant differences? Does this mean that there is no connection between the variables studied? No, it only means that there may be differences, but our results did not allow us to detect them.
- This is directly related to the definition of p-value itself. 0.04 is the probability to get such or even more extreme differences. It’s basically impossible to estimate the probability to get such differences as in our experiment!
These are the pitfalls that may be hidden in the interpretation of such an indicator as p-value. Therefore, it is very important to understand the mechanisms laid down in the basis of the methods of analysis and calculation of the main statistical indicators.
Online course on the basics of statistics: complex formulas in simple language
Now I am writing my dissertation at the Faculty of Psychology at St. Petersburg State University and teaching statistics to biologists at the Institute of Bioinformatics. Based on the course of lectures and personal research experience, the idea arose to create an online course on introduction to statistics in Russian for everyone, not necessarily bioinformatists or biologists.
There are many good online courses in data analysis and statistics (for example, such , such , or such ), but almost all of them are in English. I hope that the course will be useful for those who are just getting acquainted with the basics of statistics. In it, I try to sort out the main ideas and methods of data analysis in the most accessible form, paying particular attention to the very idea of statistical testing of hypotheses and interpretation of the results obtained. As examples there will be tasks from various fields: from bioinformatics to sociology. The course is free and all its materials will remain open after the end, begins on February 15.
Useful materials
If you know any useful courses or materials on introduction to statistics - share in the comments!
Source: https://habr.com/ru/post/250527/
All Articles