Manage unmanaged and critical monitoring
In a strange monastery with its charter do not go. At the next job, my tasks include the creation and subsequent support of workflow on the Alfresco platform, along with the maintenance of other systems. Institution with the prescribed rules, well-established customs and practices. There are no many usual IT things in the infrastructure, but everything works reliably and suits everyone. As a person with intelligence and the beginnings of education, I will not try to break other people's traditions and globally change anything. Considering over 500 workplaces, I’ll note some are not always near and the criticality of the created service for the organization, I will do some things in my own way. These include monitoring and orchestration.
Most of the jobs are located in the building on the 6th floor. There are remote jobs. The park is administered by different employees, some places belong to other organizations and may not have an employee responsible for IT at all. Global network and security in the area of responsibility of specially trained people. DHCP, DNS, AD if there is something not everywhere. ITIL / ITSM is just import letters. Operating systems WindowsXP, WindowsVista, Windows7. Workplaces can migrate to different parts of the building or outside it with the obligatory change of IP address. Users work on computers usually with administrator rights, therefore they can change everything, including% COMPUTERNAME%. It is desirable not to allow the change of the latter. Used for shared printers.
The goals of the project in monitoring are checking for the availability of web applications, taking parameters with plotting java & postgresql & OS, notifying with rss, sms and voice calls in critical cases.
The main purpose of the orchestration is to eliminate communication with over 500 users. Have the ability to quickly change the parameters of the mass, install software packages, certificates and “soft policies - like GPO”.
')
Taking into account the strategic priorities of the state, focus on full import substitution, the workplace users may have MSWSphere or ROSA at their workplaces tomorrow, respectively configuration management and monitoring tools are better to have cross-platform open source, web-based management and zero cost of implementation & ownership.
IP addresses are maintained according to the rule: 10. Building. When changing the location of the workplace, changing the IP address. Manually changed DHCP is not, therefore option 82 is not applicable. In the inventory numbers of the system blocks can be duplicates. The only thing that is relatively consistent is the MAC address. To him and make a binding. Let us define the template for the name of the workplace as PC- {mac-separator}. If there are several network connections on the computer, we will assume that Ethernet will be the first, immediately after the installation of the operating system. We will use its address as a constant for% COMPUTERNAME%.
To work with certificates, you must have the FQDN (Fully Qualified Domain Name) name, and from the conditions it follows that there is no DNS. A convenient solution in this situation is dynamic DNS, it is convenient for matching% COMPUTERNAME% with an IP address and, accordingly, determining the current location of the workplace, if there is a need for personal communication with the user.
The first solution, to dynamically update the DNS zones of the client, was the Nsupdate utility from the Bind package for Windows, but in this case the clients had a common key and therefore could change not only their records in the zone. A safer solution seemed to be when the client sends an HTTP request, and the server makes changes according to its rules. The way of storing zones in this variant is obvious - this is a SQL database. By default, the PowerDNS server is configured to serve requests from the database. It is used in many large projects and seems to be very stable. We will use it.
For comfortable control of zones, many different interfaces to PowerDNS are written. We approved the work powerdns-webinterface
Initially, inventory systems were considered for centralized software distribution. Existing proven solutions ocsinventory-ng and Mandriva Pulse have in their functionality the ability to install packages. Both include the ability to integrate with such an element ITIL / ITSM as the Service Desk (in particular GLPI ) conveniently, but not in the current situation. Changing the Windows registry settings and warming certificates is presented in no other way than by making installation packages. And these packages, the user with administrator privileges can remove from the machine. Based on this, I began to consider configuration management systems.
Puppet is considered the most common. It has many modules and user interfaces. Changes in configuration files (manifests) for clients, the latter receive them when they next access the main server, or through a request from the server for immediate execution using the push function.
There are modules for working with Windows systems. Support for WindowsXP systems was discontinued after puppet-3.1.1.msi, and the current puppet-3.7.3.msi could not be started. tied to calling system functions. In the older versions there are no `facts` like` system32` and the manifests need to describe different scenarios depending on the operating system. This all complicates the use of the system and it was decided to abandon in favor of other tools.
SaltStack is similar to Puppet in that it uses the push method to communicate with clients (minion). MINION does not open any ports, but connects itself to the server and waits for commands from it, thus increasing the security of the service. If Puppet has manifests for describing configurations, SaltStack introduces the notion of `state`. Changes made on the wizard will be made on all minions. It is worth noting that the execution of the state `s is initiated from the wizard, and not by the clients themselves as implemented in Puppet. To maintain the current status in case of a long shutdown of minion, a parameter has been added to its configuration file:
startup_states: 'highstate' (C: \ salt \ conf \ minion)
States are configuration files in the YAML format with the sls extension.
Reading the state `s begins with the file top.sls , unless otherwise specified. It contains a list of .sls files for specific groups.
Groups are defined in the master configuration file (/ etc / salt / master) and allow you to set them quite flexibly. Read more in the documentation.
In the examples from the documentation, groups are defined by variables. For dynamic types of passwords to databases, tokens, hashes, these are `props '(pillar) and static` kernels' (grain). In addition, variables can be used in the description of the state `s and the command line salt.
roto @ salt: / etc / salt / files # salt –G 'cpuarch: AMD64' test.ping
As an example, the listing of antivirus `` state of Microsoft from Microsoft:
* there are no other x64 systems in the park, except for Windows7
Software packages are installed from the repository specified in the master configuration file (/ etc / salt / master). Description of the package in the file init.sls, its listing:
Salt master has a built-in file server and can send any files to minionʻam. TCP Ports:
For SaltStack there are web-interfaces SaltPad and Halite. The first one could not be started, and with the second one you can view the system message log, the status of minions, and also send them commands.
During the tests, it proved to be an extremely unreliable, incomplete solution, noticeably inferior to the user interfaces of other systems, in particular Puppet-Dashboard.
In order to avoid problems installed SHELLINABOX.
The final installation script is as follows:
There are many monitoring systems. I know Zabbix for a long time, I chose it.
Starting from version 2.0, native support for monitoring JMX has been added to zabbix. The interaction takes place through the JMX application management API through a daemon, called Zabbix Java gateway. It is written in Java.
According to the PostgreSQL wiki , monitoring solutions are written quite a bit. I settled on libzbxpgsql (Lib-Zabbix-PostgreSQL). This is an originally compiled module written in C for a zabbix agent and an xml template for a server. The advantage over scripts is obvious, this is one process and no external dependencies.
This article is written as documentation for my current employer. Comments, comments and indications of inaccuracies are welcome.
Most of the jobs are located in the building on the 6th floor. There are remote jobs. The park is administered by different employees, some places belong to other organizations and may not have an employee responsible for IT at all. Global network and security in the area of responsibility of specially trained people. DHCP, DNS, AD if there is something not everywhere. ITIL / ITSM is just import letters. Operating systems WindowsXP, WindowsVista, Windows7. Workplaces can migrate to different parts of the building or outside it with the obligatory change of IP address. Users work on computers usually with administrator rights, therefore they can change everything, including% COMPUTERNAME%. It is desirable not to allow the change of the latter. Used for shared printers.
Baseline and Objectives
The goals of the project in monitoring are checking for the availability of web applications, taking parameters with plotting java & postgresql & OS, notifying with rss, sms and voice calls in critical cases.
The main purpose of the orchestration is to eliminate communication with over 500 users. Have the ability to quickly change the parameters of the mass, install software packages, certificates and “soft policies - like GPO”.
')
Taking into account the strategic priorities of the state, focus on full import substitution, the workplace users may have MSWSphere or ROSA at their workplaces tomorrow, respectively configuration management and monitoring tools are better to have cross-platform open source, web-based management and zero cost of implementation & ownership.
Dynamic DNS
IP addresses are maintained according to the rule: 10. Building. When changing the location of the workplace, changing the IP address. Manually changed DHCP is not, therefore option 82 is not applicable. In the inventory numbers of the system blocks can be duplicates. The only thing that is relatively consistent is the MAC address. To him and make a binding. Let us define the template for the name of the workplace as PC- {mac-separator}. If there are several network connections on the computer, we will assume that Ethernet will be the first, immediately after the installation of the operating system. We will use its address as a constant for% COMPUTERNAME%.
To work with certificates, you must have the FQDN (Fully Qualified Domain Name) name, and from the conditions it follows that there is no DNS. A convenient solution in this situation is dynamic DNS, it is convenient for matching% COMPUTERNAME% with an IP address and, accordingly, determining the current location of the workplace, if there is a need for personal communication with the user.
The first solution, to dynamically update the DNS zones of the client, was the Nsupdate utility from the Bind package for Windows, but in this case the clients had a common key and therefore could change not only their records in the zone. A safer solution seemed to be when the client sends an HTTP request, and the server makes changes according to its rules. The way of storing zones in this variant is obvious - this is a SQL database. By default, the PowerDNS server is configured to serve requests from the database. It is used in many large projects and seems to be very stable. We will use it.
How to install on Ubuntu
Install PowerDNS:
$ sudo apt-get install -y pdns-server pdns-backend-mysql
We test PowerDNS:
Verify that PowerDNS is running:
$ sudo netstat -tap | grep pdns
Must issue:
roto @ salt: ~ # netstat -tap | grep pdns
Verify that PowerDNS responds:
$ sudo dig 127 .0.0.1
Must issue:
roto @ salt: ~ # dig 127 .0.0.1
$ sudo apt-get install -y pdns-server pdns-backend-mysql
We test PowerDNS:
Verify that PowerDNS is running:
$ sudo netstat -tap | grep pdns
Must issue:
roto @ salt: ~ # netstat -tap | grep pdns
tcp 0 0 *:domain *:* LISTEN 891/pdns_server-ins Verify that PowerDNS responds:
$ sudo dig 127 .0.0.1
Must issue:
roto @ salt: ~ # dig 127 .0.0.1
; <<>> DiG 9.9.5-3ubuntu0.1-Ubuntu <<>> @127.0.0.1 ; (1 server found) ;; global options: +cmd ;; Got answer: ;; ->>HEADER<<- opcode: QUERY, status: NOERROR, id: 21529 ;; flags: qr rd; QUERY: 1, ANSWER: 0, AUTHORITY: 0, ADDITIONAL: 1 ;; WARNING: recursion requested but not available ;; OPT PSEUDOSECTION: ; EDNS: version: 0, flags:; udp: 2800 ;; QUESTION SECTION: ;. IN NS ;; Query time: 1 msec ;; SERVER: 127.0.0.1#53(127.0.0.1) ;; WHEN: Fri Feb 13 11:29:05 KRAT 2015 ;; MSG SIZE rcvd: 239 For comfortable control of zones, many different interfaces to PowerDNS are written. We approved the work powerdns-webinterface
What it looks like
How to install on Ubuntu
Install LAMP and the required module:
$ sudo apt-get install gettext
Download the panel scripts:
$ cd / tmp
$ wget powerdns-webinterface.googlecode.com/files/powerdns-webinterface-1.5.3.tar.gz
$ tar xvfz webinterface-1.5.3.tar.gz
$ sudo mv webinterface-1.5.3 / var / www / powerdns
Allow writing to the working folder:
$ sudo chown -R www-data: www-data / var / www / powerdns / tmp / templates_c
We perform database import:
$ sudo mysql -u user-name -p pdns db </ path-to / install.sql
Rule configs / db.php on the correct connection details to the pdns db database
We go to the browser at the link http: // <IP_or_name.our.server> / powerdns with the admin name / password admin: admin and change the password.
Configuration Management Tools for Windows PC Automation
Initially, inventory systems were considered for centralized software distribution. Existing proven solutions ocsinventory-ng and Mandriva Pulse have in their functionality the ability to install packages. Both include the ability to integrate with such an element ITIL / ITSM as the Service Desk (in particular GLPI ) conveniently, but not in the current situation. Changing the Windows registry settings and warming certificates is presented in no other way than by making installation packages. And these packages, the user with administrator privileges can remove from the machine. Based on this, I began to consider configuration management systems.
Puppet is considered the most common. It has many modules and user interfaces. Changes in configuration files (manifests) for clients, the latter receive them when they next access the main server, or through a request from the server for immediate execution using the push function.
There are modules for working with Windows systems. Support for WindowsXP systems was discontinued after puppet-3.1.1.msi, and the current puppet-3.7.3.msi could not be started. tied to calling system functions. In the older versions there are no `facts` like` system32` and the manifests need to describe different scenarios depending on the operating system. This all complicates the use of the system and it was decided to abandon in favor of other tools.
SaltStack is similar to Puppet in that it uses the push method to communicate with clients (minion). MINION does not open any ports, but connects itself to the server and waits for commands from it, thus increasing the security of the service. If Puppet has manifests for describing configurations, SaltStack introduces the notion of `state`. Changes made on the wizard will be made on all minions. It is worth noting that the execution of the state `s is initiated from the wizard, and not by the clients themselves as implemented in Puppet. To maintain the current status in case of a long shutdown of minion, a parameter has been added to its configuration file:
startup_states: 'highstate' (C: \ salt \ conf \ minion)
States are configuration files in the YAML format with the sls extension.
What it looks like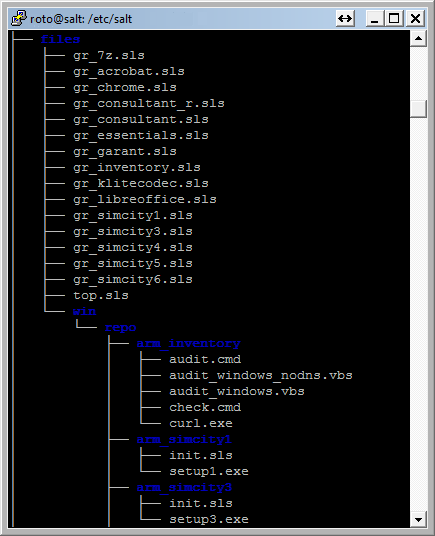
Reading the state `s begins with the file top.sls , unless otherwise specified. It contains a list of .sls files for specific groups.
roto@salt:/etc/salt/files# cat top.sls base: # '*': # Windows 'all_pc': - match: nodegroup - gr_inventory - gr_7z - gr_chrome - gr_libreoffice - gr_klitecodec - gr_essentials # 'gr_garant': - match: nodegroup - gr_garant # + 'gr_consultant': - match: nodegroup - gr_consultant Groups are defined in the master configuration file (/ etc / salt / master) and allow you to set them quite flexibly. Read more in the documentation.
In the examples from the documentation, groups are defined by variables. For dynamic types of passwords to databases, tokens, hashes, these are `props '(pillar) and static` kernels' (grain). In addition, variables can be used in the description of the state `s and the command line salt.
roto @ salt: / etc / salt / files # salt –G 'cpuarch: AMD64' test.ping
As an example, the listing of antivirus `` state of Microsoft from Microsoft:
roto@salt:/etc/salt/files# cat gr_essentials.sls {% if grains['cpuarch'] == 'AMD64' %} w64_essentials: pkg: - installed {% elif grains['osrelease'] == '7' %} w32_essentials: pkg: - installed {% elif grains['osrelease'] == 'XP' %} w32xp_essentials: pkg: - installed {% endif %} * there are no other x64 systems in the park, except for Windows7
Software packages are installed from the repository specified in the master configuration file (/ etc / salt / master). Description of the package in the file init.sls, its listing:
roto@salt:/etc/salt/files/win/repo/w32xp_essentials# cat init.sls w32xp_essentials: 4.4.304.0: installer: 'salt://win/repo/w32xp_essentials/mseinstall.exe' full_name: Microsoft Security Essentials locale: ru_RU reboot: False install_flags: '/q /s /runwgacheck ' uninstaller: '%ProgramFiles(x86)%\Microsoft Security Client\Setup.exe' uninstall_flags: ' /U /S' Salt master has a built-in file server and can send any files to minionʻam. TCP Ports:
- 4505 # for management
- 4506 # for file transfer
For SaltStack there are web-interfaces SaltPad and Halite. The first one could not be started, and with the second one you can view the system message log, the status of minions, and also send them commands.
What it looks like
During the tests, it proved to be an extremely unreliable, incomplete solution, noticeably inferior to the user interfaces of other systems, in particular Puppet-Dashboard.
What it looks like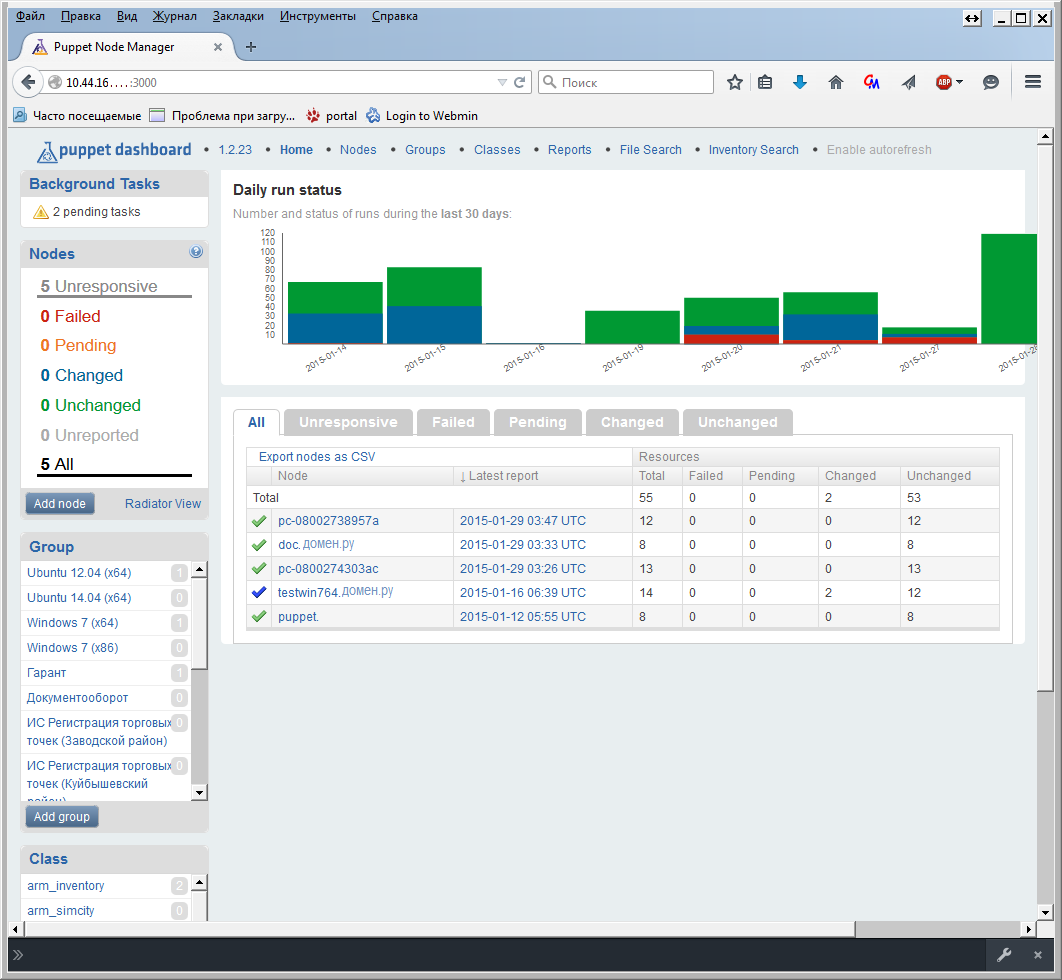
In order to avoid problems installed SHELLINABOX.
What it looks like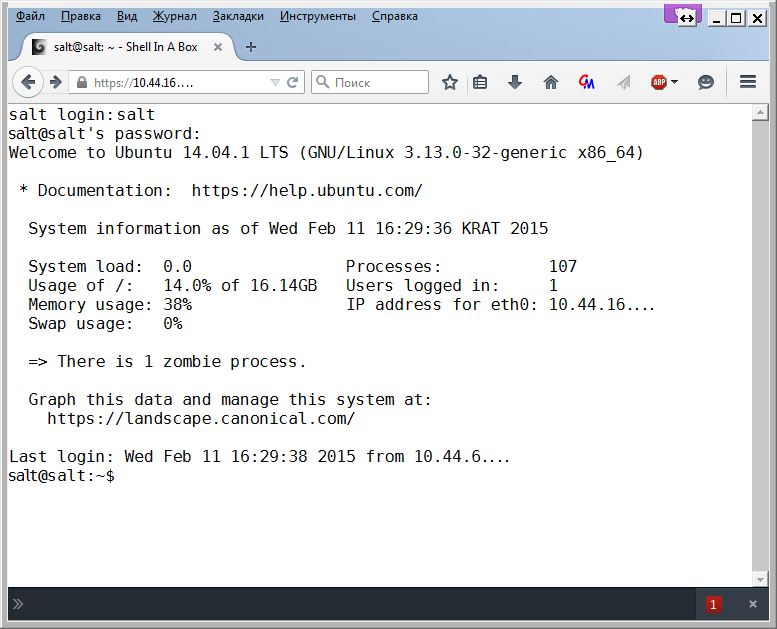
How to install on Ubuntu
Install Shell In A Box for ssh access via any html5 browser:
$ sudo apt-get install openssl shellinabox
Rule default configs:
$ sudo vi / etc / default / shellinabox
Restart service:
$ sudo service shellinabox restart
Check port:
$ sudo netstat -nap | grep shellinabox
Open in html 5 compatible browser https: // <IP_or_name.our.server>. We use.
$ sudo apt-get install openssl shellinabox
Rule default configs:
$ sudo vi / etc / default / shellinabox
# TCP shellinboxd' SHELLINABOX_PORT=443 # IP SSH SHELLINABOX_ARGS="--o-beep -s /:SSH:localhost --localhost-only" Restart service:
$ sudo service shellinabox restart
Check port:
$ sudo netstat -nap | grep shellinabox
Open in html 5 compatible browser https: // <IP_or_name.our.server>. We use.
The final installation script is as follows:
install.cmd
@Echo Off rem /************************************* rem * Install for SaltStack * rem *-----------------------------------* rem * (c) 2015 by Aleksey Ovchinnikov * rem * License: GPL * rem * Feel free to customize on your * rem * needs as long this copyright * rem * remains intact * rem *************************************/ SetLocal EnableExtensions rem /// , AT > NUL If %ERRORLEVEL% EQU 1 ( echo Please use "Run as Administrator"! pause exit /b ) rem /// mac %SYSTEMROOT%\System32\getmac.exe /NH /FO csv > %TEMP%\all_mac.tmp type %TEMP%\all_mac.tmp | findstr /r /c:"-" > %TEMP%\all_mac.txt del %TEMP%\all_mac.tmp for /f "usebackq delims=" %%i in (`find /n /v "" %TEMP%\all_mac.txt ^| find "[1]"`) do ( set mac=%%i ) For /f "delims=, tokens=1" %%i in ("%mac%") do ( set mac=%%i ) set mac=%mac:~4,17% For /f "delims=^- tokens=*" %%i in ("%mac%") do ( set mac=%%i ) set mac=%mac:-=% set mac=%mac:~0,12% rem /// If not "%ComputerName%"=="PC-%mac%" ( rem wmic.exe /interactive:off ComputerSystem Where "name = '%computername%'" call rename Name='PC-%mac%' rem wmic os where Primary='TRUE' reboot REG ADD HKLM\SYSTEM\ControlSet001\Control\ComputerName\ComputerName /v ComputerName /t REG_SZ /d "PC-%mac%" /f REG ADD HKLM\SYSTEM\CurrentControlSet\Control\ComputerName\ComputerName /v ComputerName /t REG_SZ /d "PC-%mac%" /f REG ADD HKLM\SYSTEM\CurrentControlSet\Services\Tcpip\Parameters /v "NV Hostname" /t REG_SZ /d "PC-%mac%" /f REG ADD HKLM\SYSTEM\ControlSet001\Services\Tcpip\Parameters /v "NV Hostname" /t REG_SZ /d "PC-%mac%" /f shutdown -t 0 -r -f exit /b ) echo ...get NAME ^> %ComputerName% rem /// IP FOR /F "usebackq tokens=2 delims=[]" %%i IN (`ping %Computername% -n 1 -4`) DO if not "%%i"=="" Set ip=%%i echo ...get IP ^> %ip% rem /// set key=HKLM\SOFTWARE\Microsoft\Windows NT\CurrentVersion For /F "delims=" %%a in ('reg query "%key%" /v "ProductName" ^| find /i "ProductName"') do ( set OSName=%%a ) set OSName=%OSName:ProductName=% set OSName=%OSName:REG_SZ=% For /F "tokens=* delims= " %%a in ("%OSName%") do ( set OSName=%%a ) echo ...get OS ^> %OSName% rem /// Set xOS=x64 If "%PROCESSOR_ARCHITECTURE%"=="x86" If Not Defined PROCESSOR_ARCHITEW6432 Set xOS=x86 echo ...get TYPE ^> %xOS% rem /// DNS set data=%ip%:%COMPUTERNAME%:%COMPUTERNAME%_%OSName%_%xOS% set data=%data: =_% echo ...add DNS ^> c:\saltstack\curl.exe -s http://salt../dns/update.php?data=%data%" rem /// SaltStack Windows If %xOS%==x86 (c:\saltstack\Salt-Minion-3.1.5-win32-Setup.exe /S /master=salt.. /minion-name=%COMPUTERNAME%) Else (c:\saltstack\Salt-Minion-3.1.5-AMD64-Setup.exe /S /master=salt.. /minion-name=%COMPUTERNAME%) rem /// echo.startup_states: 'highstate' >>"C:\salt\conf\minion" echo ...auto state ^> Done! attrib +H +S c:\salt echo ...hide folder ^> Done! cd c:\ rmdir /s /qc:\saltstack Zabbix monitoring system
There are many monitoring systems. I know Zabbix for a long time, I chose it.
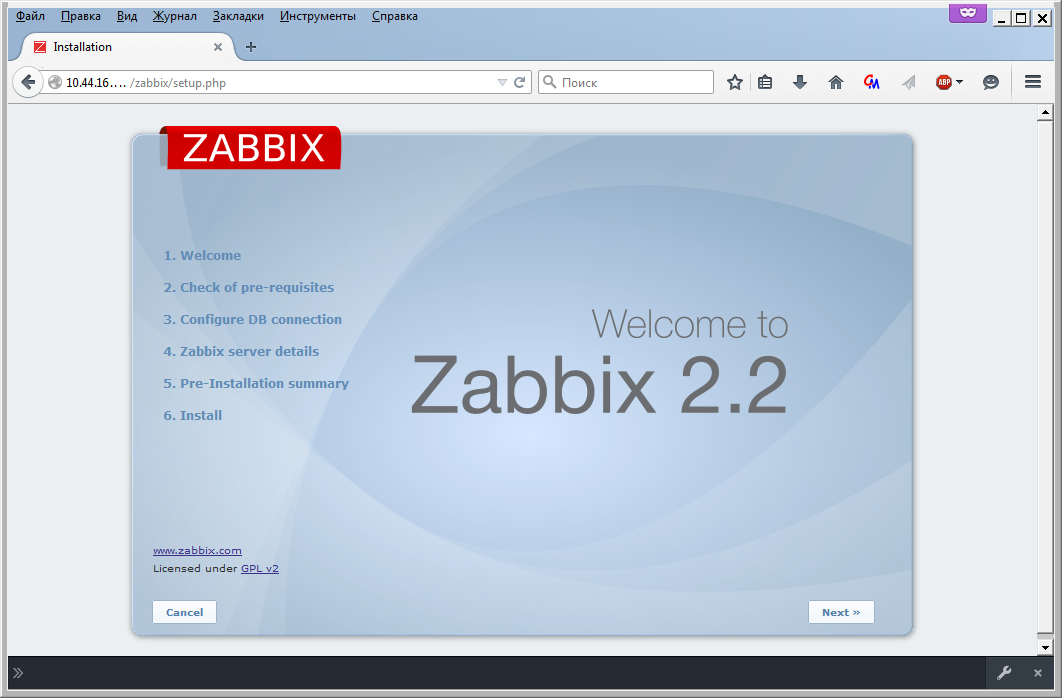
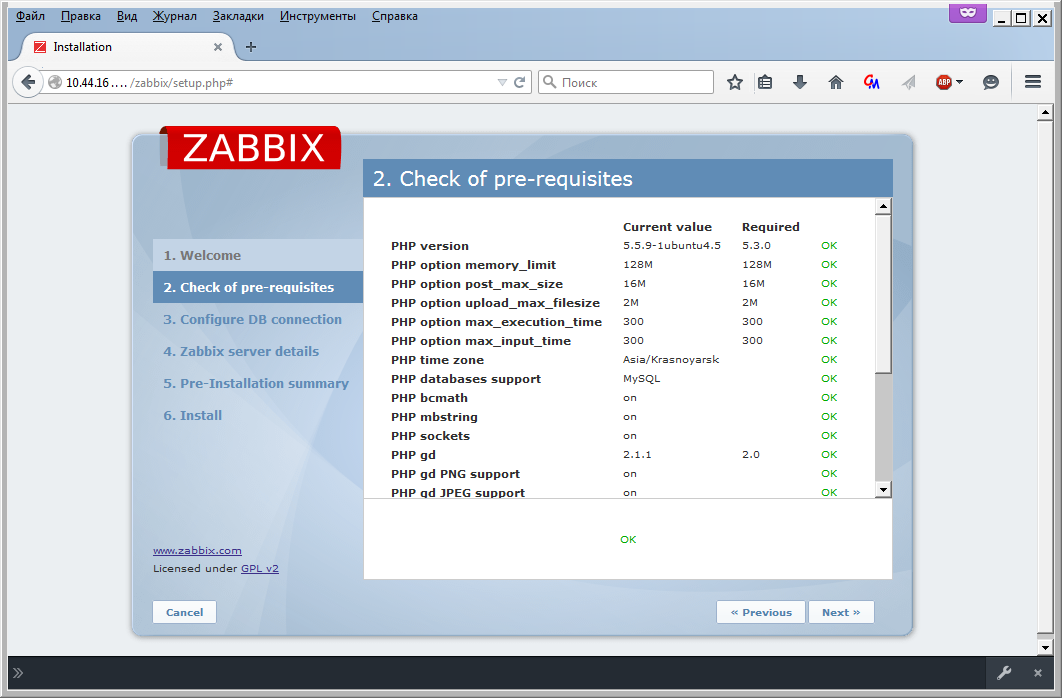
What it looks like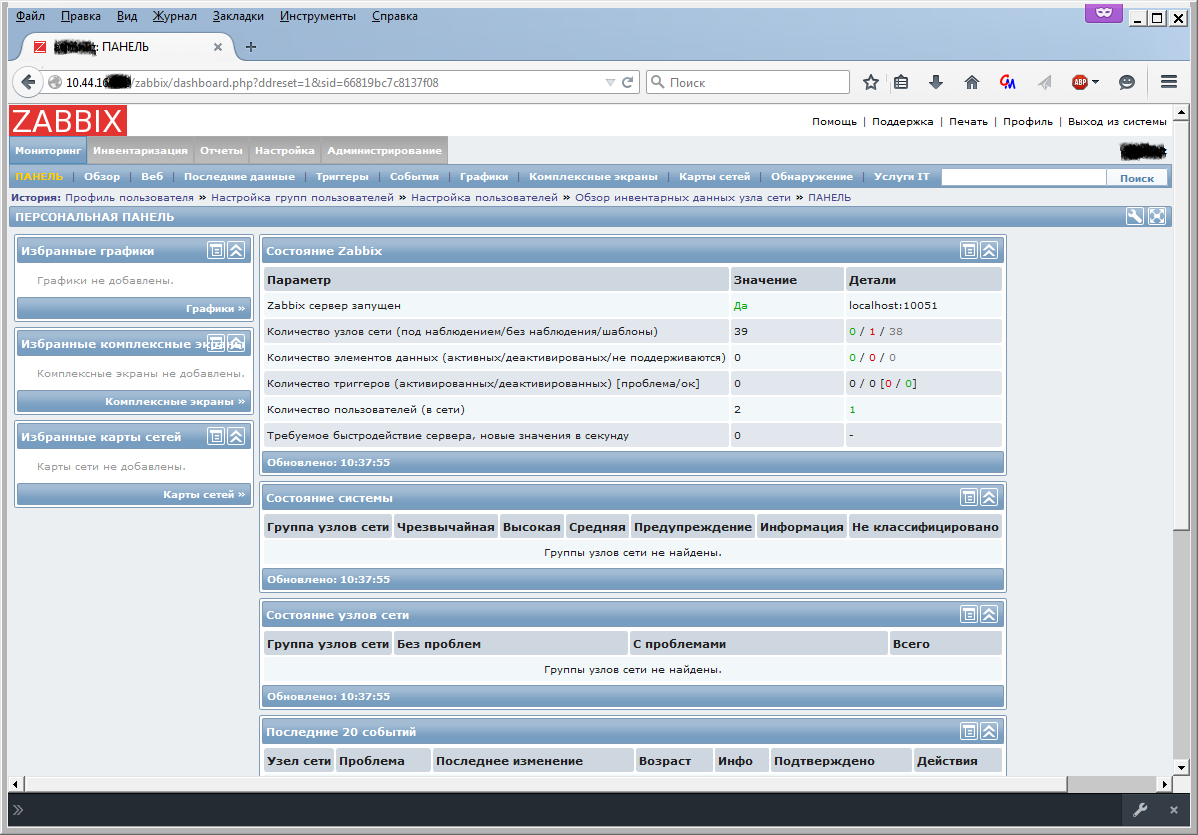
How to install on Ubuntu
Install the necessary packages:
$ sudo apt-get install zabbix-server-mysql zabbix-frontend-php ca-certificates-java libslf4j-java jarwrapper libandroid-json-org-java liblogback-java
In the server configuration file /etc/zabbix/zabbix_server.conf we set up a connection to the database:
$ sudo mcedit /etc/zabbix/zabbix_server.conf
We are preparing a database:
mysql –uuser-name –p
mysql> create database zabbix character set utf8 collate utf8_unicode_ci;
mysql> grant all privileges on zabbix. * to zabbix @ localhost identified by 'zabbix';
mysql> exit;
Load the structure and values into the database:
$ sudo cd / usr / share / zabbix-server-mysql
$ sudo gunzip * .gz
$ sudo mysql -uuser-name zabbix -p <schema.sql
$ sudo mysql -uuser-name zabbix -p <images.sql
$ sudo mysql -uuser-name zabbix -p <data.sql
Restart zabbix:
$ sudo service zabbix-server star t
And we check that everything is without errors:
$ tail -n 100 /var/log/zabbix-server/zabbix_server.log
Copy the required file:
$ sudo cp /usr/share/doc/zabbix-frontend-php/examples/apache.conf /etc/apache2/conf-available/zabbix.conf
Configure php parameters for the web interface:
$ sudo mcedit /etc/apache2/conf-available/zabbix.conf
Add the zabbix web interface configuration file to apache:
$ sudo a2enconf zabbix.conf
And restart the web server:
$ sudo service apache2 reload
Open your zwebserver / zabbix URL and complete all steps:

At the last step you will be asked to enter:
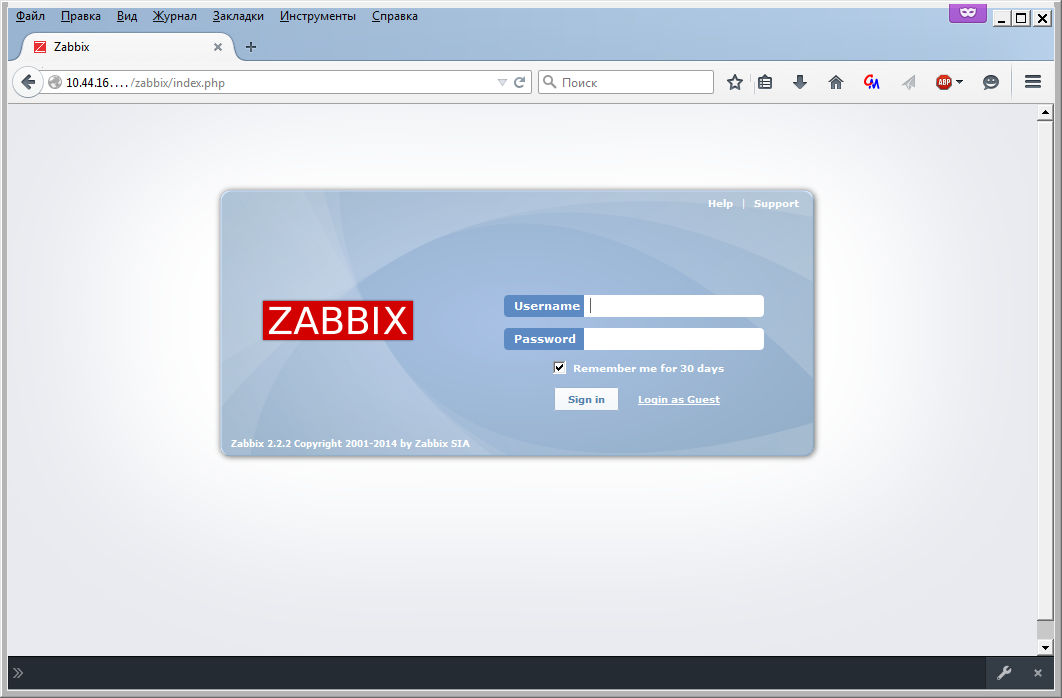
Default login / password: Admin / zabbix. Change password after login.
$ sudo apt-get install zabbix-server-mysql zabbix-frontend-php ca-certificates-java libslf4j-java jarwrapper libandroid-json-org-java liblogback-java
In the server configuration file /etc/zabbix/zabbix_server.conf we set up a connection to the database:
$ sudo mcedit /etc/zabbix/zabbix_server.conf
### Option: DBHost # Database host name. # If set to localhost, socket is used for MySQL. # If set to empty string, socket is used for PostgreSQL. # # Mandatory: no # Default: # DBHost=localhost ### Option: DBName # Database name. # For SQLite3 path to database file must be provided. DBUser and DBPassword are ignored. # Sample SQLite3 DBName: # DBName=/var/lib/zabbix/zabbix.sqlite3 # # Mandatory: yes # Default: # DBName= DBName=zabbix ### Option: DBUser # Database user. Ignored for SQLite. # # Mandatory: no # Default: # DBUser= DBUser=zabbix ### Option: DBPassword # Database password. Ignored for SQLite. # Comment this line if no password is used. # # Mandatory: no # Default: # DBPassword= DBPassword=zabbix We are preparing a database:
mysql –uuser-name –p
mysql> create database zabbix character set utf8 collate utf8_unicode_ci;
mysql> grant all privileges on zabbix. * to zabbix @ localhost identified by 'zabbix';
mysql> exit;
Load the structure and values into the database:
$ sudo cd / usr / share / zabbix-server-mysql
$ sudo gunzip * .gz
$ sudo mysql -uuser-name zabbix -p <schema.sql
$ sudo mysql -uuser-name zabbix -p <images.sql
$ sudo mysql -uuser-name zabbix -p <data.sql
Restart zabbix:
$ sudo service zabbix-server star t
And we check that everything is without errors:
$ tail -n 100 /var/log/zabbix-server/zabbix_server.log
Copy the required file:
$ sudo cp /usr/share/doc/zabbix-frontend-php/examples/apache.conf /etc/apache2/conf-available/zabbix.conf
Configure php parameters for the web interface:
$ sudo mcedit /etc/apache2/conf-available/zabbix.conf
php_value max_execution_time 300 php_value memory_limit 128M php_value post_max_size 16M php_value upload_max_filesize 2M php_value max_input_time 300 php_value date.timezone Asia/Krasnoyarsk Add the zabbix web interface configuration file to apache:
$ sudo a2enconf zabbix.conf
And restart the web server:
$ sudo service apache2 reload
Open your zwebserver / zabbix URL and complete all steps:
At the last step you will be asked to enter:
Default login / password: Admin / zabbix. Change password after login.
JMX monitoring
Starting from version 2.0, native support for monitoring JMX has been added to zabbix. The interaction takes place through the JMX application management API through a daemon, called Zabbix Java gateway. It is written in Java.
How to install on Ubuntu
Install the necessary packages:
$ sudo apt-get install --no-install-recommends zabbix-java-gateway
In the server configuration file /etc/zabbix/zabbix_java_gateway.conf, we configure the connections and launch options for the Java gateway:
$ sudo mcedit /etc/zabbix/zabbix_java_gateway.conf
In the server configuration file /etc/zabbix/zabbix_server.conf, we configure the connection to the Java gateway:
$ sudo mcedit /etc/zabbix/zabbix_server.conf
Allow launch:
$ sudo mcedit / etc / default / zabbix-server
We start the service:
$ sudo service zabbix-java-gateway restart
The next setting is made on the machine where the monitoring will be performed. Add to the application server startup script or the container of the servlets:
Disable access to this port to everyone except the IP addresses of the zabbix server and the admin machine using a firewall.
From the admin machine, launch JConsole from jdk and connect to the machine where it will be monitored.
If the connection is successful, you need to go to the zabbix web interface and configure the parameters for monitoring. Go to Settings> Network nodes, click Create network node and enter the necessary values.
After some time, the data will appear and you can build a graph.
$ sudo apt-get install --no-install-recommends zabbix-java-gateway
In the server configuration file /etc/zabbix/zabbix_java_gateway.conf, we configure the connections and launch options for the Java gateway:
$ sudo mcedit /etc/zabbix/zabbix_java_gateway.conf
# Java-gateway JavaGateway=127.0.0.1 # Java Gateway JavaGatewayPort=10052 # Java Gateway , StartJavaPollers=5 In the server configuration file /etc/zabbix/zabbix_server.conf, we configure the connection to the Java gateway:
$ sudo mcedit /etc/zabbix/zabbix_server.conf
### Option: JavaGateway #<----->IP address (or hostname) of Zabbix Java gateway. #<----->Only required if Java pollers are started. # # Mandatory: no # Default: # JavaGateway= JavaGateway=127.0.0.1 ### Option: JavaGatewayPort #<----->Port that Zabbix Java gateway listens on. # # Mandatory: no # Range: 1024-32767 # Default: # JavaGatewayPort=10052 JavaGatewayPort=10052 ### Option: StartJavaPollers #<----->Number of pre-forked instances of Java pollers. # # Mandatory: no # Range: 0-1000 # Default: # StartJavaPollers=0 StartJavaPollers=5 Allow launch:
$ sudo mcedit / etc / default / zabbix-server
START=yes We start the service:
$ sudo service zabbix-java-gateway restart
The next setting is made on the machine where the monitoring will be performed. Add to the application server startup script or the container of the servlets:
-Djava.rmi.server.hostname=192.168.3.14 \ -Dcom.sun.management.jmxremote \ -Dcom.sun.management.jmxremote.port=12345 \ -Dcom.sun.management.jmxremote.authenticate=false \ -Dcom.sun.management.jmxremote.ssl=false \ Disable access to this port to everyone except the IP addresses of the zabbix server and the admin machine using a firewall.
From the admin machine, launch JConsole from jdk and connect to the machine where it will be monitored.
What it looks like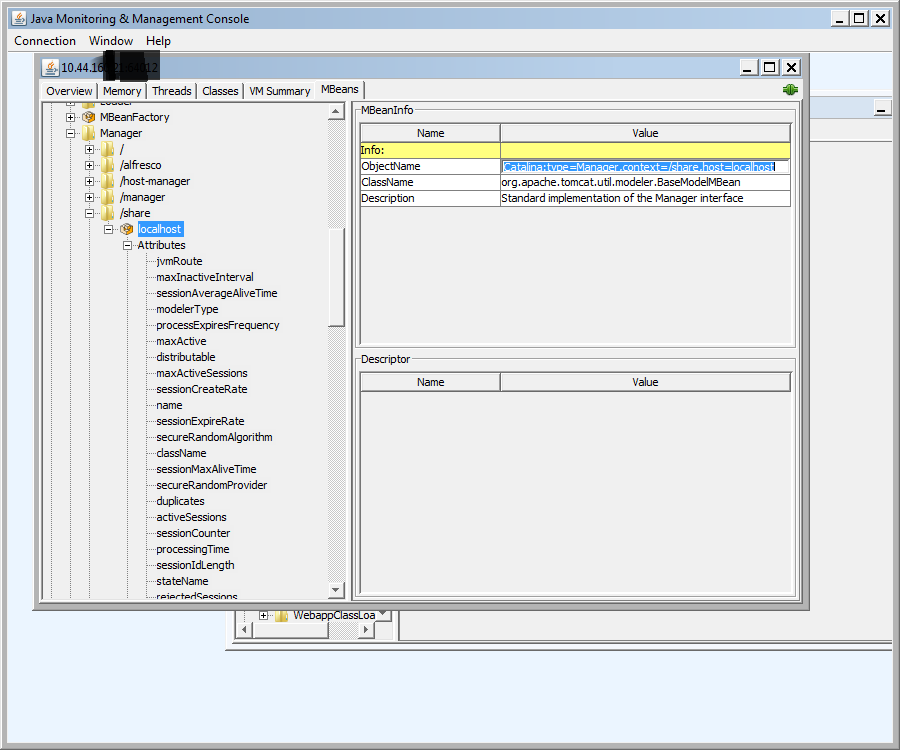
If the connection is successful, you need to go to the zabbix web interface and configure the parameters for monitoring. Go to Settings> Network nodes, click Create network node and enter the necessary values.
What it looks like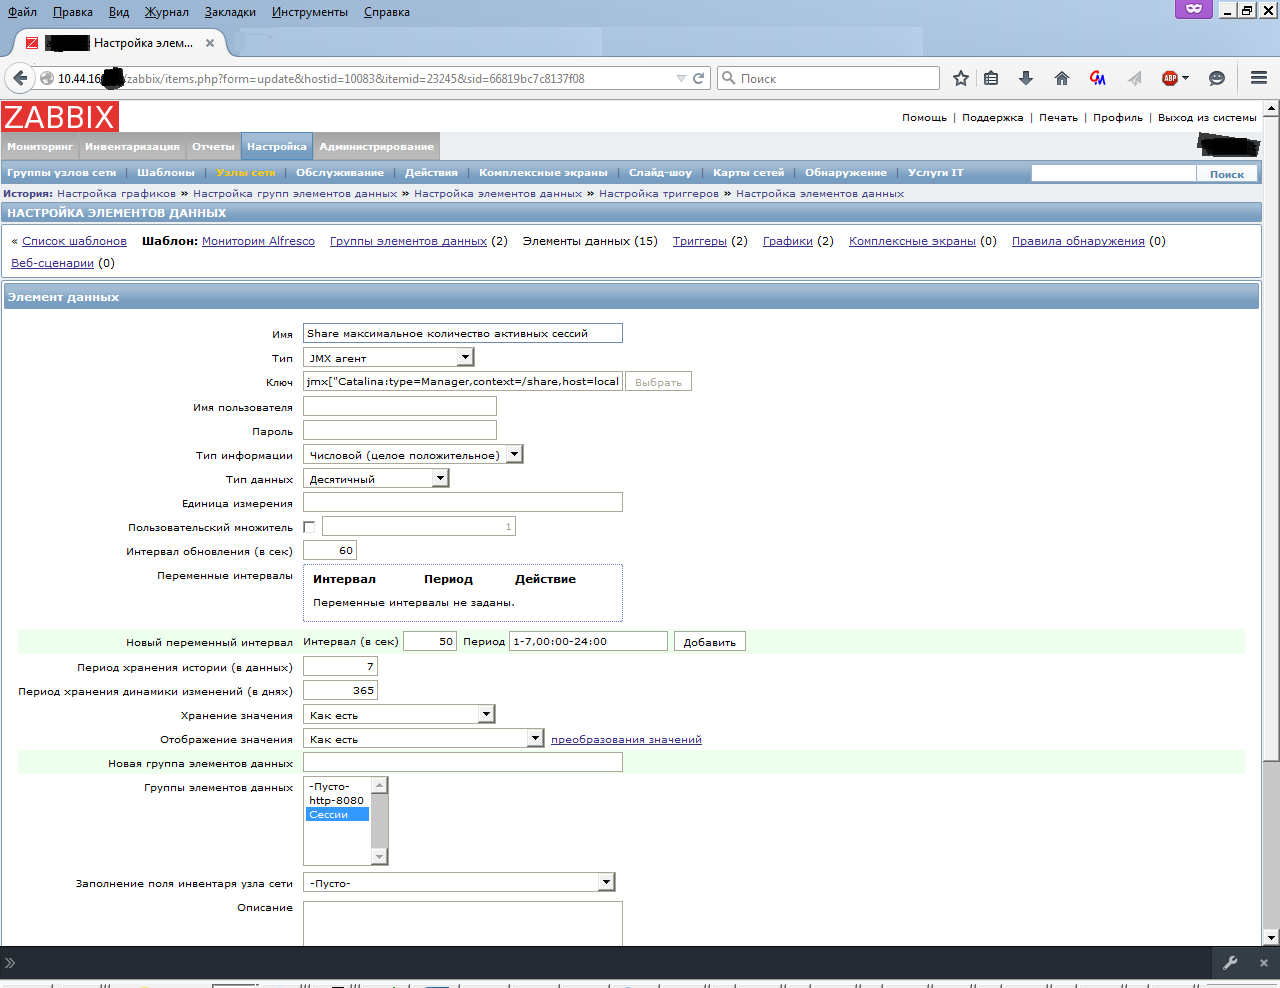
After some time, the data will appear and you can build a graph.
What it looks like
PostgreSQL Monitoring
According to the PostgreSQL wiki , monitoring solutions are written quite a bit. I settled on libzbxpgsql (Lib-Zabbix-PostgreSQL). This is an originally compiled module written in C for a zabbix agent and an xml template for a server. The advantage over scripts is obvious, this is one process and no external dependencies.
How to install on Ubuntu
It is proposed to compile the module yourself, the binary package is only in rpm. And take it.
Install the necessary packages on the machine with the database that we will monitor:
$ sudo apt-get install alien zabbix-agent
Download the module:
$ sudo wget downloads.sourceforge.net/project/libzbxpgsl/rpms/libzbxpgsql-0.1.1-1.el7.centos.x86_64.rpm
Convert to deb package:
$ sudo alien libzbxpgsql-0.1.1-1.el7.centos.x86_64.rpm
Install the package:
$ sudo dpkg -i libzbxpgsql_0.1.1-2_amd64.deb
In the agent configuration file /etc/zabbix/zabbix_agentd.conf, we configure server connections and options:
$ sudo mcedit /etc/zabbix/zabbix_agentd.conf
And restart the agent:
$ sudo service zabbix-agent restart
Save the template_postgresql_server.xml
Open the zabbix web interface and go to Settings> Templates, click Import Configuration. Import our xml file.
Configure settings for this host. Add the required templates and Template PostgreSQL Server. In the Macros tab, enter the parameters of the connection to the database that will be monitored.
After some time, the data will appear and you can build a graph.
Install the necessary packages on the machine with the database that we will monitor:
$ sudo apt-get install alien zabbix-agent
Download the module:
$ sudo wget downloads.sourceforge.net/project/libzbxpgsl/rpms/libzbxpgsql-0.1.1-1.el7.centos.x86_64.rpm
Convert to deb package:
$ sudo alien libzbxpgsql-0.1.1-1.el7.centos.x86_64.rpm
Install the package:
$ sudo dpkg -i libzbxpgsql_0.1.1-2_amd64.deb
In the agent configuration file /etc/zabbix/zabbix_agentd.conf, we configure server connections and options:
$ sudo mcedit /etc/zabbix/zabbix_agentd.conf
Server= ServerActive=: Hostname=doc.. And restart the agent:
$ sudo service zabbix-agent restart
Save the template_postgresql_server.xml
Open the zabbix web interface and go to Settings> Templates, click Import Configuration. Import our xml file.
Configure settings for this host. Add the required templates and Template PostgreSQL Server. In the Macros tab, enter the parameters of the connection to the database that will be monitored.
What it looks like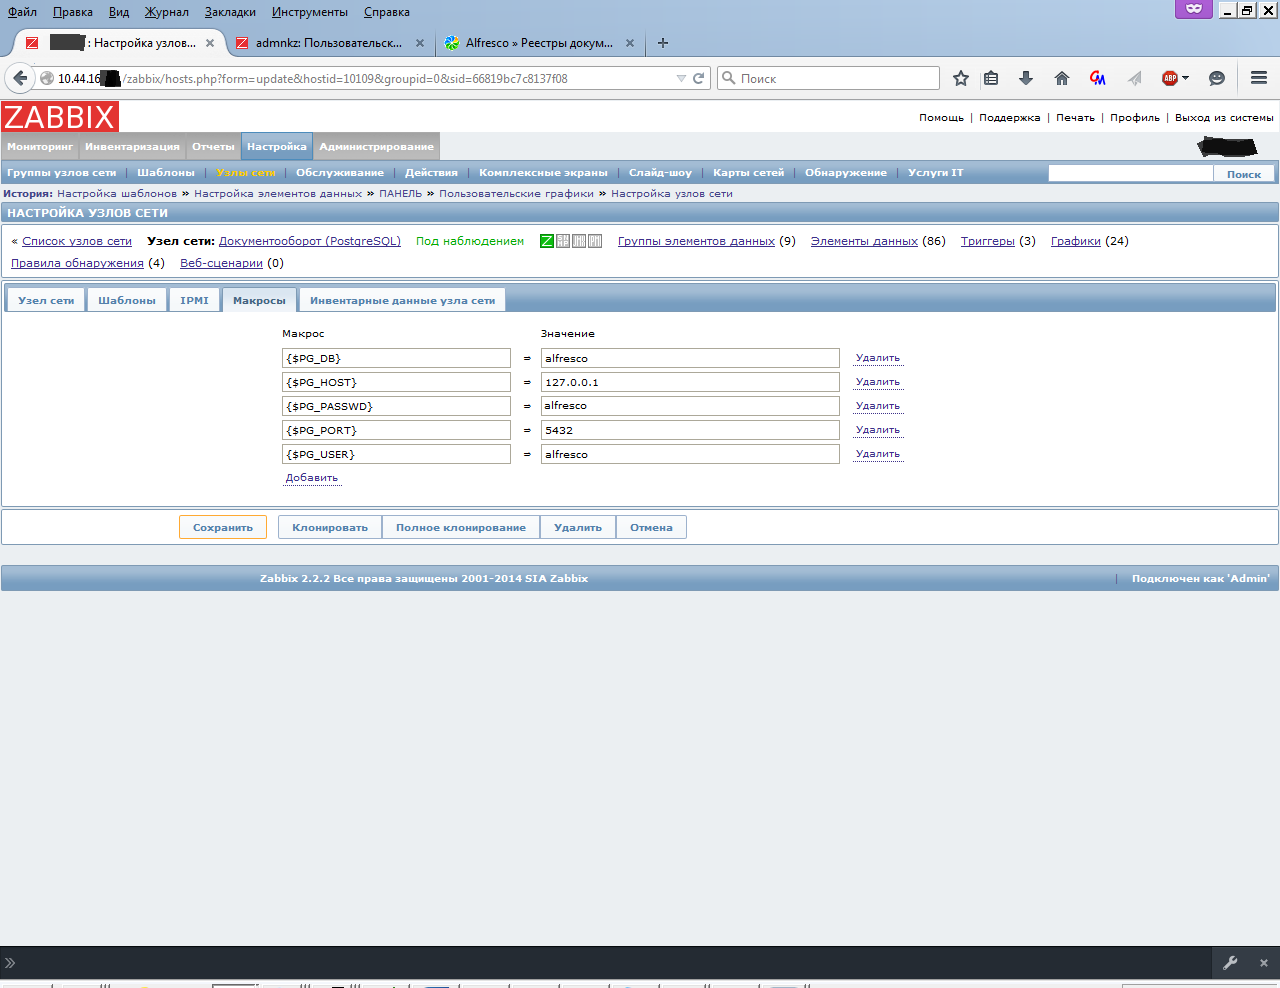
After some time, the data will appear and you can build a graph.
What it looks like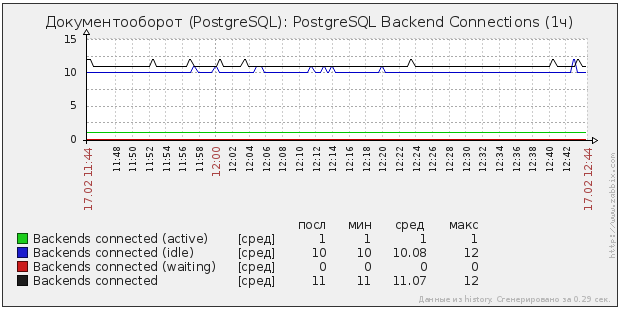
This article is written as documentation for my current employer. Comments, comments and indications of inaccuracies are welcome.
Source: https://habr.com/ru/post/250487/
All Articles