How Elasticsearch can help you find suspicious site activity
I propose to the readers of Habrakhabr a translation of the article “Spotting bad actors: from your official blog Elasticsearch . The article talks about how you can use Elasticsearch capabilities to analyze web server logs in order to detect suspicious activity on the site.
Let's think about what and when we do in the case of attempts to hack our site? Firstly, most often we are trying to eliminate the threat already when the attackers found a vulnerability on the site and took advantage of it. Secondly, it is often the only operational tool to combat intruders - it is blocking IP-addresses, but it is not a very effective tool if we do not have detailed information about all the addresses from which an attack is made to the site.
But how much would the situation change if we could receive in advance detailed information about all IP addresses and subnets that are showing suspicious activity and block them? That sounds great, doesn't it?
')
We can easily do this with Elasticsearch.
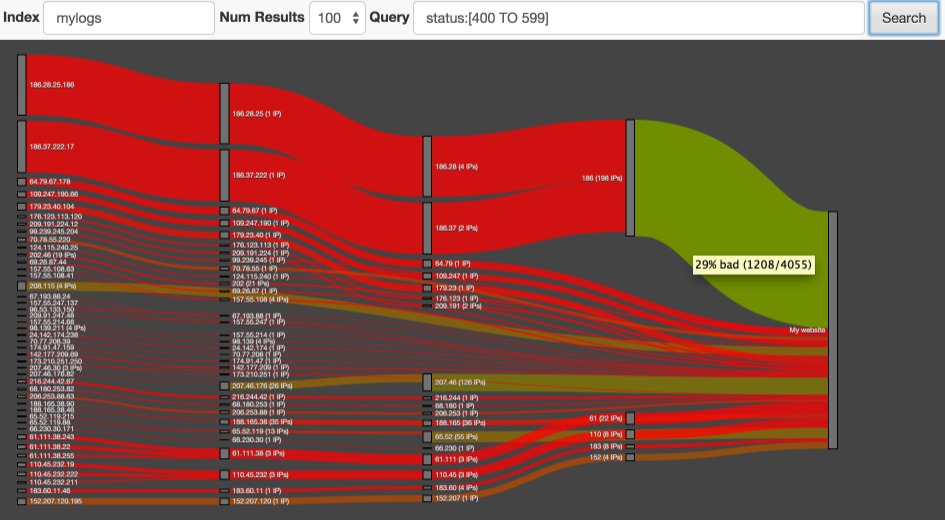
In the arsenal of this search engine there is a wonderful plugin Netrisk , which takes all the trouble of analyzing logs and, using the “Sankey” diagram (see picture), shows us the size and concentration of suspicious activity in various traffic segments.
Start by installing Netrisk. To do this, you should run the following command, being in the home directory of Elasticsearch (requires version not lower than 1.4.0):
Great, now the plugin is installed. But that's not all. He expects us to provide him with an index with a correctly configured mapping for the field in which the IP addresses will be stored. I will explain the details later, but now you just need to create an index and fill it with a small amount of test data by running the following shell script:
Attention! This script will create an index “mylogs”, while if you already have an index with this name, it will be deleted.
If you have completed all the above instructions, you can open the plugin page: localhost : 9200 / _plugin / netrisk /
If you look at the data generated by the script, it may seem that this is not enough for serious analysis, because, in fact, from the valuable we have only the HTTP server status of responses. In fact, this is enough to detect suspicious behavior. Typically, the web server generates responses in the range from 200 to 300, but in case of problems, it can assign a status from 400 to 500 to the answer. For example, this can happen when someone tries to access a non-existent page. It turns out that we can already get a list of all suspicious requests to the server using the query:
Netrisk uses the standard Lucene request parser (the same as Kibana), so you can supplement the request that detects suspicious traffic with additional filters through the OR condition. For example, in this way, we can inform the system that calls to the site without specifying the UserAgent should also be considered suspicious.
It is important to understand that the request made at this stage will not unambiguously determine that all entries in the journal that are suitable for it are bad. No, we just make an assumption that it may be suspicious that, as a result, Elasticsearch would analyze the entire magazine for a high concentration of suspicious server access from specific IP or subnets.
If we run the plugin using the above request, Netrisk will show us Sankey a diagram of suspicious traffic leading to your site. Here is some info to read the chart:
You may have noticed that the color of the line may change from red to green from left to right. This is due to the fact that on the left side of the diagram, each node usually represents a small group of IP addresses, requests from which were identified as suspicious. The following diagram nodes represent subnets that include large numbers of IP addresses with different behaviors. However, some subnets will be completely red. Most likely, this means that no one except attackers is interested in your site in this region (for example, if you have a Russian-language site, and red traffic from China is coming to you, which is most likely the Chinese hackers want to harm your resource).
The queries that Netrisk makes rely on the available IP and subnet statistics stored in the index. For such an analysis, we cannot simply index each IP address as a string; we must divide it into tokens, which will represent the IP address itself and the subnets it belongs to (for example, the IP address of the 186.28.25.186 type will be divided into the following tokens: 186.28.25.186, 186.28.25, 186.28 and 186). This can be implemented using the following mapping rule:
This approach allows us to perform a quick search simultaneously on all 4 levels of the hierarchy of each IP address. (this also applies to IPv6 addresses)
Netrisk receives a request from you that determines what exactly should be considered “bad downloads” (or, more precisely, “potentially bad downloads”). After filtering the data, Netrisk uses significant_terms aggregation to determine which IP addresses or subnets most often receive suspicious messages. The query template looks like this:
This query selects the 50 most suspicious IP addresses and subnets. There are several points worth noting:
This single request will do a mass analysis and provide us with basic information about violators in our system, but it is advisable to clarify some information before making a decision on blocking IP addresses. To do this, we can use the following query:
For each specified suspicious IP or subnet, we get an array with the following information:
Now that we have a chart and detailed statistics about dubious IP addresses, we can make the final blocking decision.
Tracking the behavior of entities such as IP addresses by analyzing the web server log is a complex computational task, but the data we have obtained is only the tip of the iceberg.
Let me give you some more interesting examples of behavioral analysis that you can implement yourself:
Let's think about what and when we do in the case of attempts to hack our site? Firstly, most often we are trying to eliminate the threat already when the attackers found a vulnerability on the site and took advantage of it. Secondly, it is often the only operational tool to combat intruders - it is blocking IP-addresses, but it is not a very effective tool if we do not have detailed information about all the addresses from which an attack is made to the site.
But how much would the situation change if we could receive in advance detailed information about all IP addresses and subnets that are showing suspicious activity and block them? That sounds great, doesn't it?
')
We can easily do this with Elasticsearch.
In the arsenal of this search engine there is a wonderful plugin Netrisk , which takes all the trouble of analyzing logs and, using the “Sankey” diagram (see picture), shows us the size and concentration of suspicious activity in various traffic segments.
Training
Start by installing Netrisk. To do this, you should run the following command, being in the home directory of Elasticsearch (requires version not lower than 1.4.0):
bin/plugin -install markharwood/netrisk Great, now the plugin is installed. But that's not all. He expects us to provide him with an index with a correctly configured mapping for the field in which the IP addresses will be stored. I will explain the details later, but now you just need to create an index and fill it with a small amount of test data by running the following shell script:
$ES_HOME/plugins/netrisk/exampleData/indexAnonData.sh Attention! This script will create an index “mylogs”, while if you already have an index with this name, it will be deleted.
If you have completed all the above instructions, you can open the plugin page: localhost : 9200 / _plugin / netrisk /
Launch
If you look at the data generated by the script, it may seem that this is not enough for serious analysis, because, in fact, from the valuable we have only the HTTP server status of responses. In fact, this is enough to detect suspicious behavior. Typically, the web server generates responses in the range from 200 to 300, but in case of problems, it can assign a status from 400 to 500 to the answer. For example, this can happen when someone tries to access a non-existent page. It turns out that we can already get a list of all suspicious requests to the server using the query:
status:[400 TO 599] Netrisk uses the standard Lucene request parser (the same as Kibana), so you can supplement the request that detects suspicious traffic with additional filters through the OR condition. For example, in this way, we can inform the system that calls to the site without specifying the UserAgent should also be considered suspicious.
It is important to understand that the request made at this stage will not unambiguously determine that all entries in the journal that are suitable for it are bad. No, we just make an assumption that it may be suspicious that, as a result, Elasticsearch would analyze the entire magazine for a high concentration of suspicious server access from specific IP or subnets.
If we run the plugin using the above request, Netrisk will show us Sankey a diagram of suspicious traffic leading to your site. Here is some info to read the chart:
- The thickness of the line represents the number of "bad" requests, but this is not the most important!
- The line color is more important - it depends on which queries prevail: bright red color - means that almost all requests are bad, while green means that almost all requests can be considered good. If you hover the cursor on the line, you can see the real numbers underlying the definition of color.
- The diagram shows which IP addresses belong to each subnet. This information can be very valuable for the webmaster when determining whether malicious traffic is coming from: from specific IP addresses or from a subnet?
- Clicking on a specific IP address will open the Honey Pot project site, where you can read the comments of other webmasters regarding this IP address.
You may have noticed that the color of the line may change from red to green from left to right. This is due to the fact that on the left side of the diagram, each node usually represents a small group of IP addresses, requests from which were identified as suspicious. The following diagram nodes represent subnets that include large numbers of IP addresses with different behaviors. However, some subnets will be completely red. Most likely, this means that no one except attackers is interested in your site in this region (for example, if you have a Russian-language site, and red traffic from China is coming to you, which is most likely the Chinese hackers want to harm your resource).
How it works?
Little about mapping data
The queries that Netrisk makes rely on the available IP and subnet statistics stored in the index. For such an analysis, we cannot simply index each IP address as a string; we must divide it into tokens, which will represent the IP address itself and the subnets it belongs to (for example, the IP address of the 186.28.25.186 type will be divided into the following tokens: 186.28.25.186, 186.28.25, 186.28 and 186). This can be implemented using the following mapping rule:
Mapping Rule
curl -XPOST "http://localhost:9200/mylogs" -d '{ "settings": { "analysis": { "analyzer": { "ip4_analyzer": { "tokenizer": "ip4_hierarchy" } }, "tokenizer": { "ip4_hierarchy": { "type": "PathHierarchy", "delimiter": "." } } } }, "mappings": { "log": { "properties": { "remote_host": { "type": "string", "index": "not_analyzed", "fields": { "subs": { "type": "string", "index_analyzer": "ip4_analyzer", "search_analyzer": "keyword" } } } } } } }' This approach allows us to perform a quick search simultaneously on all 4 levels of the hierarchy of each IP address. (this also applies to IPv6 addresses)
What's inside?
Netrisk receives a request from you that determines what exactly should be considered “bad downloads” (or, more precisely, “potentially bad downloads”). After filtering the data, Netrisk uses significant_terms aggregation to determine which IP addresses or subnets most often receive suspicious messages. The query template looks like this:
curl -XGET "http://localhost:9200/anonlogs/_search?search_type=count" -d'{ "query": { "query_string": { "query": "status:[400 TO 599]" } }, "aggs": { "sigIps": { "significant_terms": { "field": "remote_host.subs", "size": 50, "shard_size": 50000, "gnd": {} } } } }' This query selects the 50 most suspicious IP addresses and subnets. There are several points worth noting:
- To get the correct data, we need a high shard_size value. This will seriously burden the memory and network, as well as the need for disk space for a large number of unique entries in the index. If we do not index the IP addresses completely in the remote_host.subs field, then this will reduce the load, but it will also reduce the depth of the result.
- ElasticSearch for heuristic analysis uses the JLH algorithm by default, but the GND algorithm is much better suited for the problem we are considering. Usually, when analyzing, we are interested in rare words, for example, it is important for us to determine that the words Nosferatu and Helsing are related to the set of documents about the movie Dracula, but we are not interested in what the common word “he” is connected with. In the problem of analyzing IP addresses, we can neglect the possibilities that the JLH algorithm gives us and take advantage of the less functional but faster GND.
This single request will do a mass analysis and provide us with basic information about violators in our system, but it is advisable to clarify some information before making a decision on blocking IP addresses. To do this, we can use the following query:
Request
{ "query": { "terms": { "remote_host.subs": [ "256.52", "186.34.56" ] } }, "aggs": { "ips": { "filters": { "filters": { "256.52": { "term": { "remote_host.subs": "256.52" } }, "186.34.56": { "term": { "remote_host.subs": "186.34.56" } } } }, "aggs": { "badTraffic": { "filter": { "query": { "query_string": { "query": "status:[400 TO 599]" } } } }, "uniqueIps": { "cardinality": { "field": "remote_host" } } } } } } For each specified suspicious IP or subnet, we get an array with the following information:
- Total number of requests (bad and good);
- The total number of bad requests;
- The total number of unique IP addresses per subnet;
Now that we have a chart and detailed statistics about dubious IP addresses, we can make the final blocking decision.
Conclusion
Tracking the behavior of entities such as IP addresses by analyzing the web server log is a complex computational task, but the data we have obtained is only the tip of the iceberg.
Let me give you some more interesting examples of behavioral analysis that you can implement yourself:
- How much time do visitors spend on my site?
- What IP addresses behave like bots (do not load CSS and JavaScript — only the page markup itself)?
- Which site page is most often the first / last when visiting the site?
Source: https://habr.com/ru/post/250413/
All Articles