CSS file visualization
Some time ago it became interesting for me to see how the CSS code of our project looks like and how it has changed over the course of a whole year. This is how the node-specificity project was born. What is he doing? It allows you to get answers to the following questions:
Well, why is this important at all? Maybe not, as long as you are not working with a code consisting of tens of thousands of lines, which is difficult to maintain, or you are experimenting quite a lot. And, of course, if this is not important, then at least it should seem interesting.
So node-specificity provides two commands. One of them is used for processing CSS files and creating profiles. The second is for reading and “researching” these very profiles. Let's take an example. I have several CSS versions of my blog. The latest version is v8.css .
Create profiles for these files:
')
We have just created profiles for each individual CSS file, since we want to look at changes over time. If you use more than one CSS file on your site, then you need to create a profile for all files, for example:
Label is used as profile name in reports. Once we have created the profiles, we can run the report. Let's look at the "server" report:
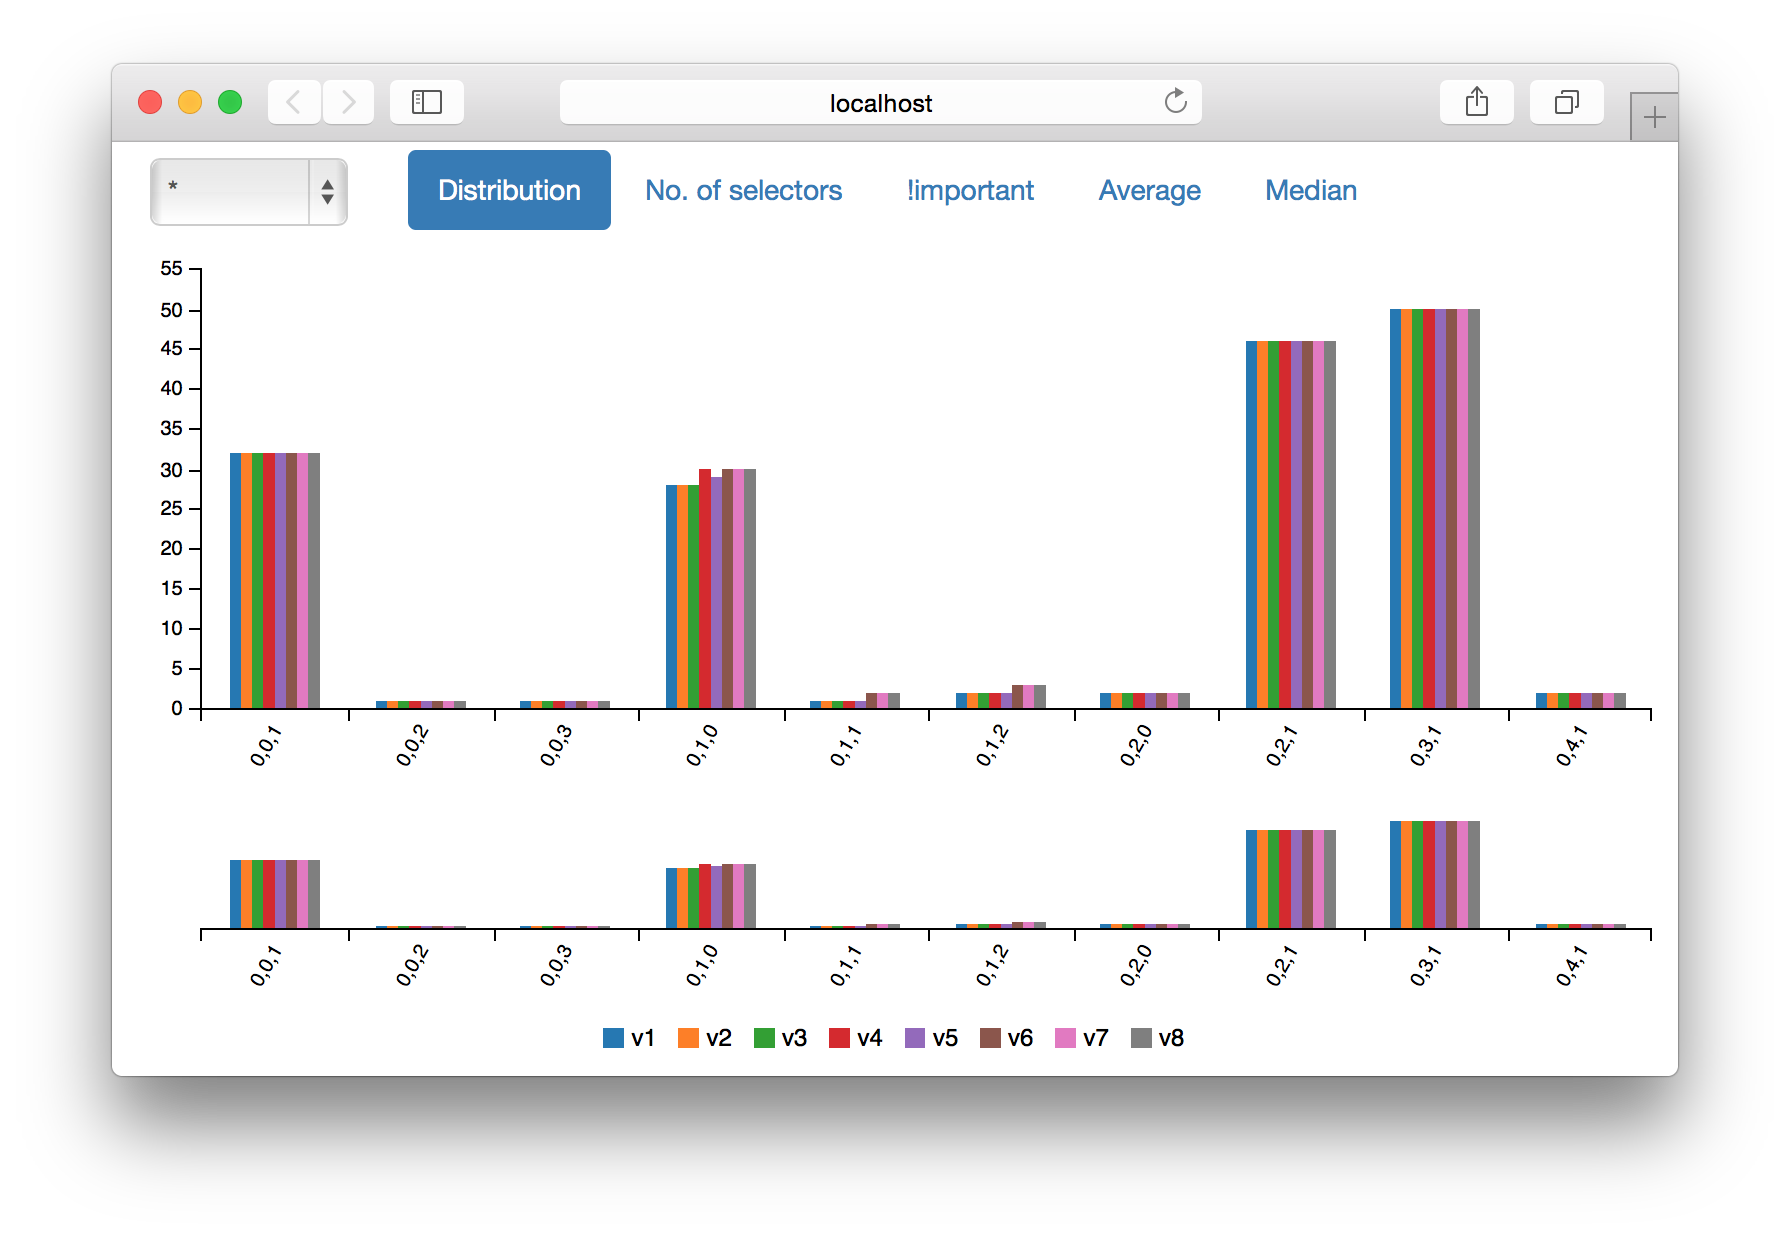
Open a browser and go to http: // localhost: 4000 /. Now you should see a page with various controls and a strange schedule. This is a graph of the distribution of specificity (see the title picture). For each specificity (tuple) you see the number of selectors of this specificity in each profile.
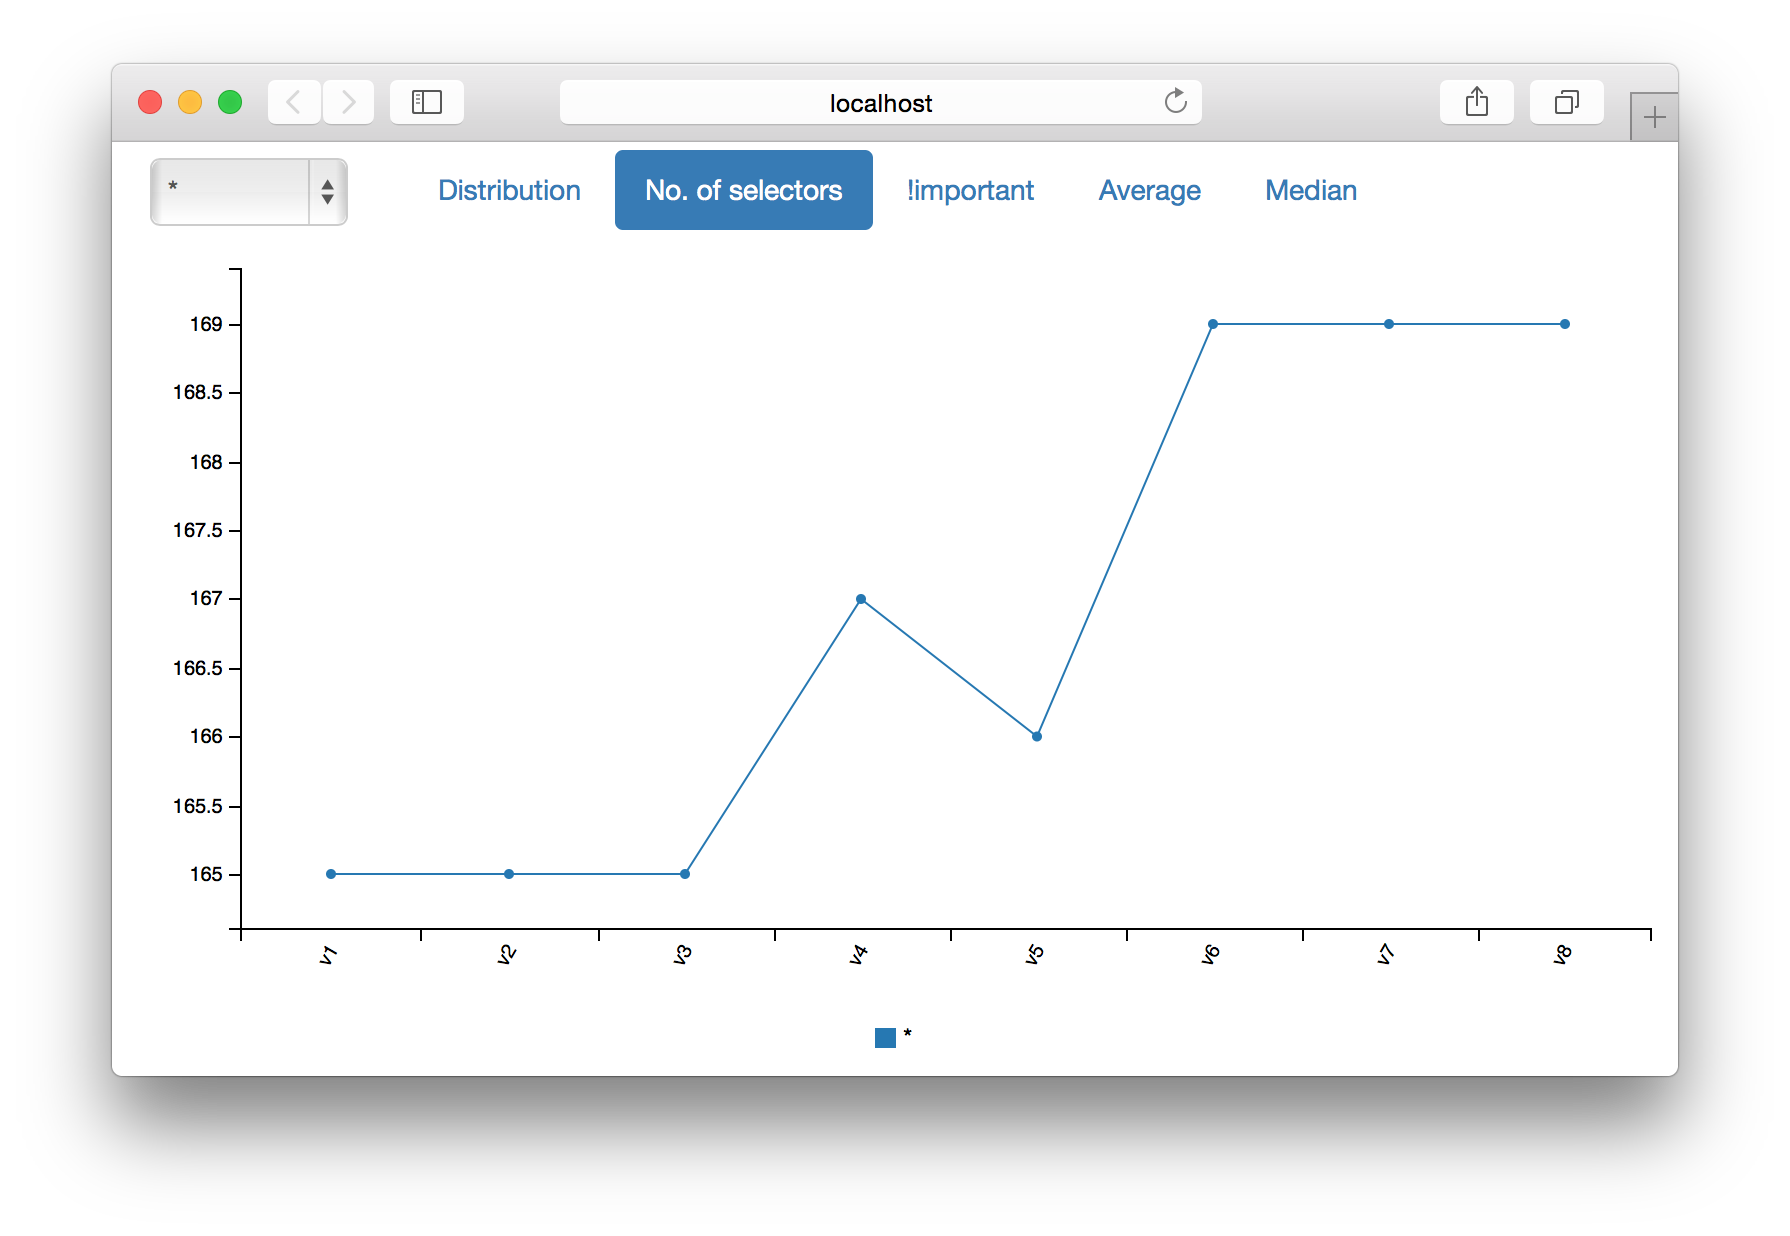
Other graphics: the number of selectors in files and profiles; the proportion of those that contain
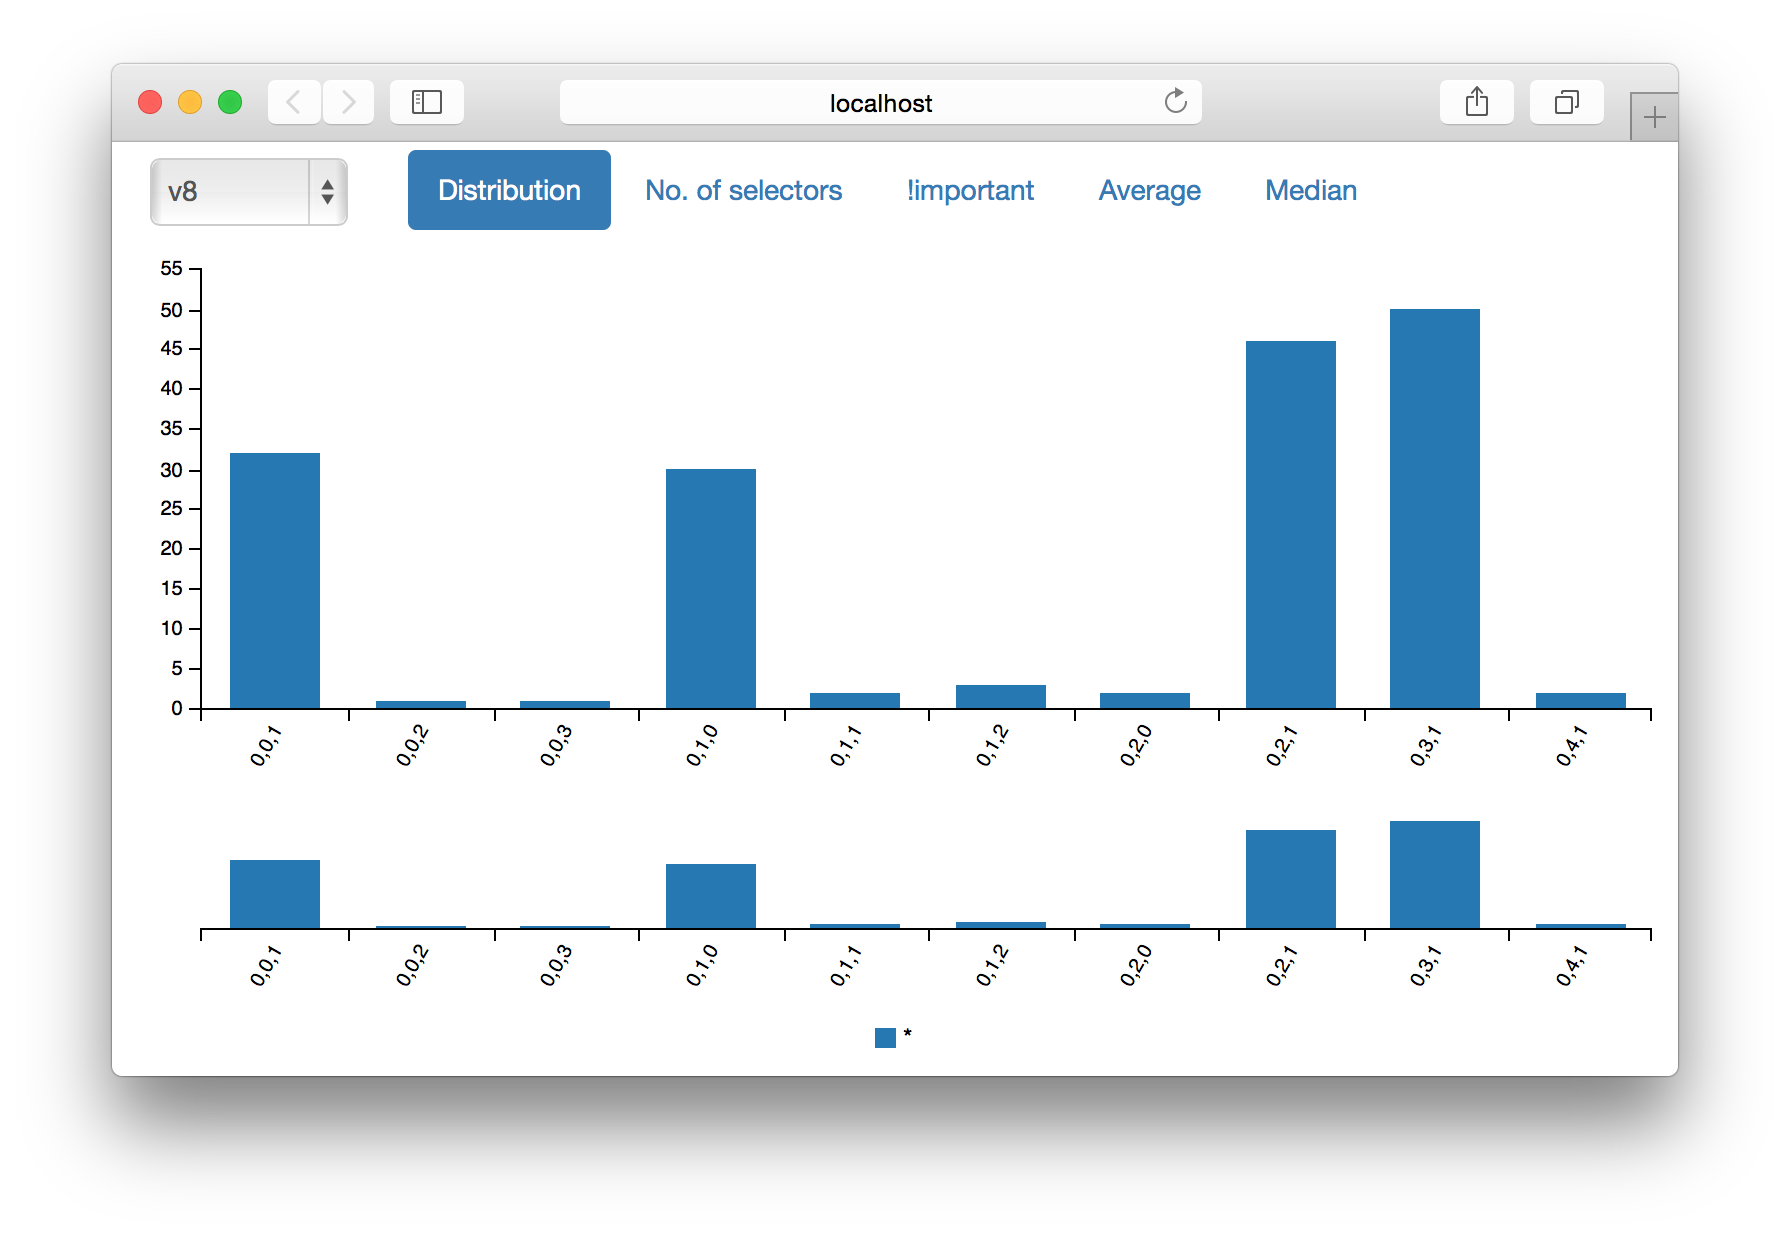
In addition, you can view all these graphs for each profile separately. To do this, select the desired profile from the list on the left. For example, below is a graph of the distribution of specificity for the profile v8.json .
The “server” report is a fairly powerful tool. Keep in mind that the above images have been shown for profiles consisting of one small CSS file. If you have several files in your profile, then the graphics will play more interesting.
There are other types of reports. Take, for example, “inspect”, which is used as the default. If you perform
Reports may accept additional command line parameters. There are several of them. For example,
That's all. Happy exploring!
- How many selectors are in the code? How has their number changed over time?
- What are the maximum and average values for selector specificity? What is the median? How have they changed over time?
- What is the distribution of the specificity of selectors? How has it changed over time?
- How many selectors use the
!importantdirective? How has their number changed over time?
Well, why is this important at all? Maybe not, as long as you are not working with a code consisting of tens of thousands of lines, which is difficult to maintain, or you are experimenting quite a lot. And, of course, if this is not important, then at least it should seem interesting.
So node-specificity provides two commands. One of them is used for processing CSS files and creating profiles. The second is for reading and “researching” these very profiles. Let's take an example. I have several CSS versions of my blog. The latest version is v8.css .
Create profiles for these files:
')
$ node-specificity parse v1.css --label=v1 --output=v1.json ... $ node-specificity parse v8.css --label=v8 --output=v8.json We have just created profiles for each individual CSS file, since we want to look at changes over time. If you use more than one CSS file on your site, then you need to create a profile for all files, for example:
$ node-specificity parse main.css print.css --label=2014-12-23 --output=20141223.json Label is used as profile name in reports. Once we have created the profiles, we can run the report. Let's look at the "server" report:
$ node-specificity explore v*.json --report=server Server is running on http://localhost:4000/ Press Ctrl + C to stop it. Open a browser and go to http: // localhost: 4000 /. Now you should see a page with various controls and a strange schedule. This is a graph of the distribution of specificity (see the title picture). For each specificity (tuple) you see the number of selectors of this specificity in each profile.
Other graphics: the number of selectors in files and profiles; the proportion of those that contain
!important directive; mean value and median specificity.In addition, you can view all these graphs for each profile separately. To do this, select the desired profile from the list on the left. For example, below is a graph of the distribution of specificity for the profile v8.json .
The “server” report is a fairly powerful tool. Keep in mind that the above images have been shown for profiles consisting of one small CSS file. If you have several files in your profile, then the graphics will play more interesting.
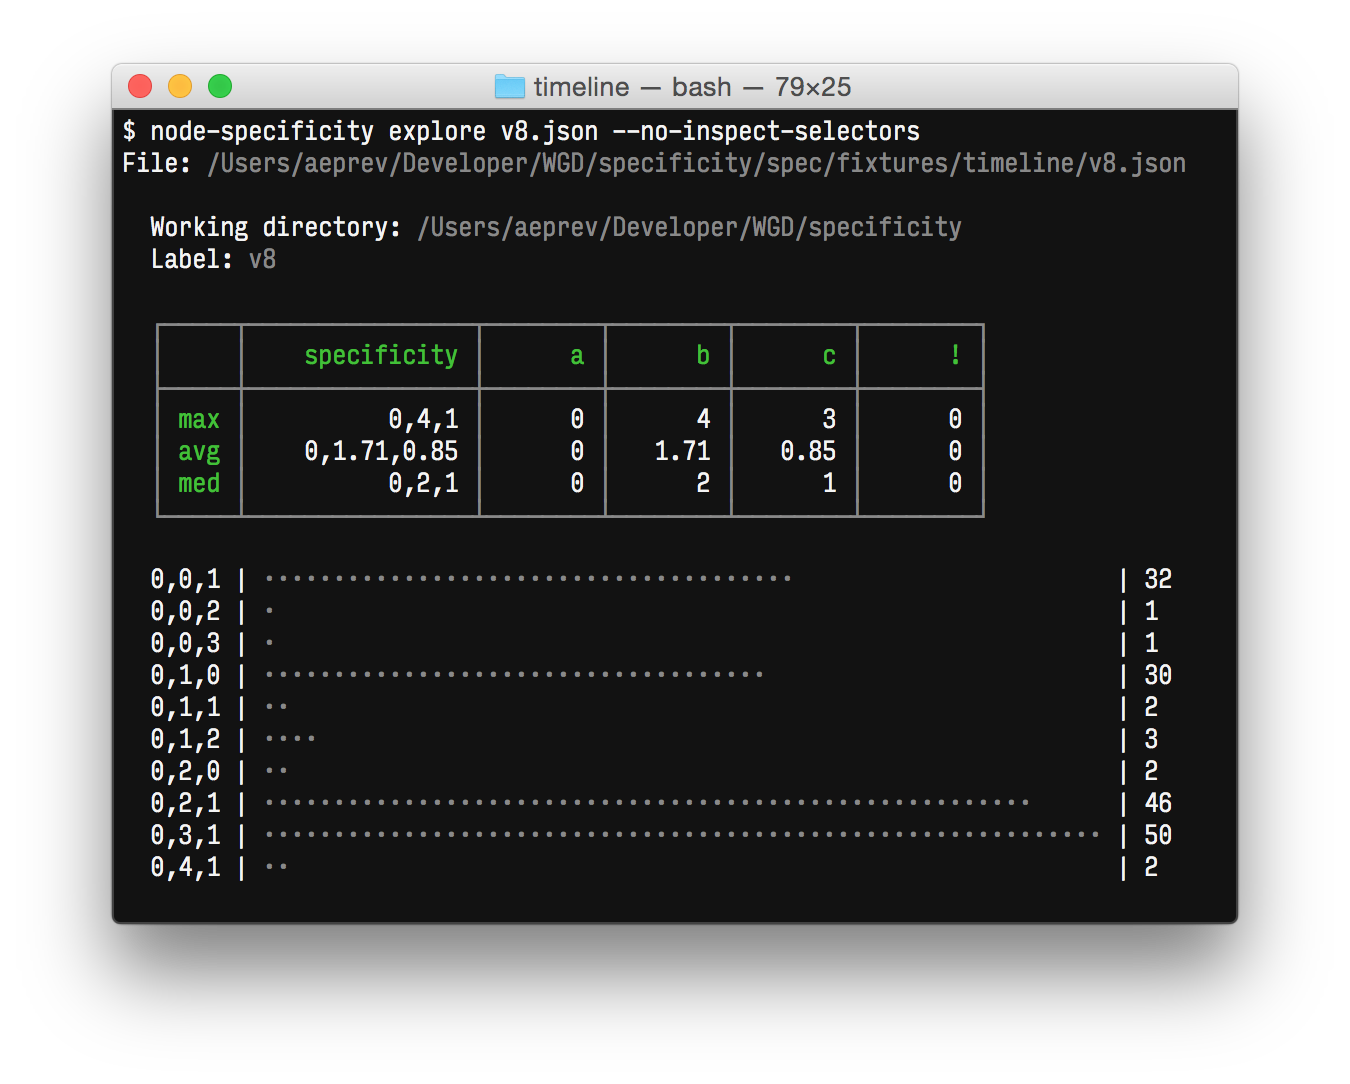
There are other types of reports. Take, for example, “inspect”, which is used as the default. If you perform
node-specificity explore v8.json in the terminal, then on the screen for each profile will be printed a list of all the selectors, a table with specificity values and a specificity distribution graph, very similar to the one you could see above.Reports may accept additional command line parameters. There are several of them. For example,
--no-inspect-selectors (see picture above) disables the display of the selectors list.That's all. Happy exploring!
Source: https://habr.com/ru/post/250269/
All Articles