Visualization of fantasies on Mac
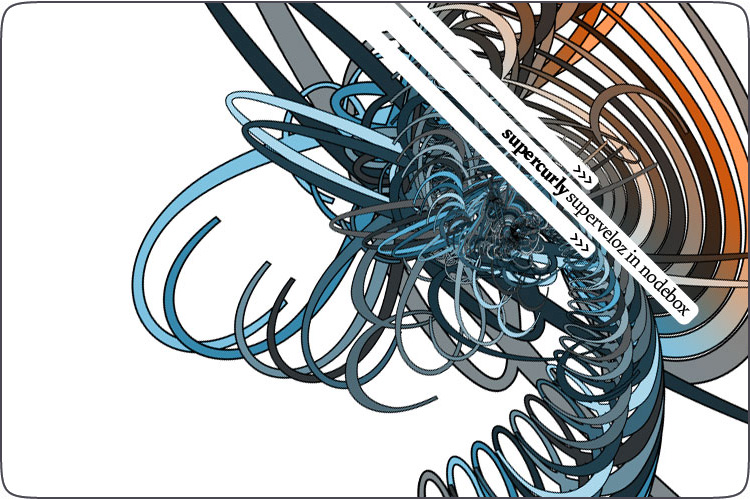
Some incredible Mac application found today in the wilds of the web. NodeBox - for creating vivid and unusual visualizations on Python. The program is completely free and fully documented. On the developer’s website, captivating hairy universes;) and visualization of the taxonomy of social networks. I still can not approach this thing, it is so non-trivial.
And everything would be fine if the guys from Juiceanalytics did not demonstrate the interesting features of this wonderful application.
All those familiar with Edward Tufte 's usability chart creations will recognize this graph invented by him. Excellent concept of positional-time comparison for two or three periods.
')
As always, it is dry, clear and smooth. And how to create such a thing? Of course in Adobe Illustrator.
So they offer to use NodeBox, run the code and no fuss with alignment, bindings and layers. Look at the code and the result of the work in this program. In my opinion, a very decent approach.
Similar in my blog
Source: https://habr.com/ru/post/24970/
All Articles