Observium - more than a monitoring system
Network monitoring with intuition
I have long been a Habr reader, but writing an article was driven by a desire to answer questions and, probably, a first-hand dialogue. I apologize for the possible confusion of the article - “the Chukchi is not a writer”.
On Habré, there are already several articles on this system ( "Monitoring Cisco network equipment in the Observium system" , "Observium - installing a monitoring system" ) and I would like to add them. The article does not contain instructions for installing or configuring, all this is in the official documentation and on the links listed above.
The article has a lot of pictures, some are hidden under the spoilers.
Observium, as the slogan on the main site says, is a system for monitoring and monitoring network devices and servers. At the same time, the list of supported devices is huge and is not limited to only network devices, the main condition is that the device supports SNMP operation. But besides SNMP, the collected information can be supplemented by other methods and protocols, for example, syslog, rancid, unix-agent.
')
A bit of history. Initially, the system was created by the “subjects of his majesty” Adam Armstrong around 2005–2006 (unfortunately, he no longer remembers the exact date). Subsequently, developers have joined the project, including your humble servant. First, the system was called Kikker (2005–2006), then Project Observer (2006–2008), ObserverNMS (2008–2010), and finally, in 2010, it acquired the current name Observium. The main logo is a hamster of industrial appearance.

The main purpose of the creation was to create a system with the simplest possible control and monitoring of devices, which remains to this day.
The distribution model of the system is divided into Community (released every 6 months) and Subscription (available to subscribers via continuous stable / rolling updates).
Many people know such systems as cacti, prtg, mrtg, but none of them compare in terms of convenience of adding devices and the number of supported sensors (by default).
How does the process of adding a new device to the system:
1. Add the device name (in the command line or the web interface).
2. We wait 5-10 minutes for the discovery process and the first poller to finish, that's all.
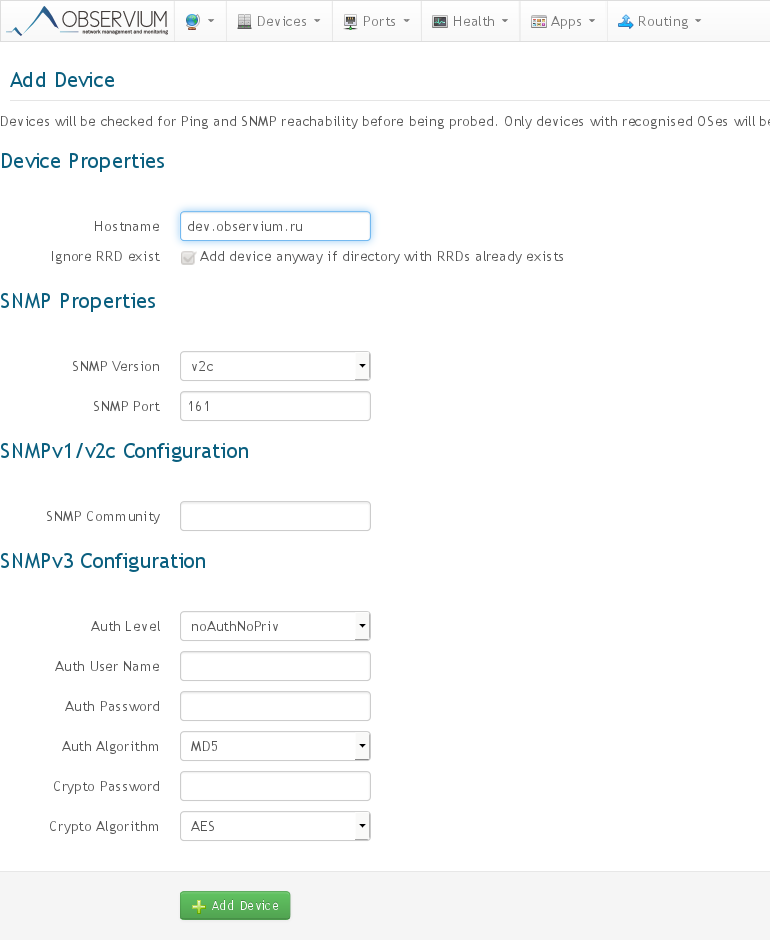
Almost to add a new device, the default settings are enough, you only need to specify authorization parameters, but you can add them to the general configuration and the system will automatically check all the specified authorization parameters.
Adding a device, see under the spoiler
Adding a new device:
Device added, waiting for discovery / poller completion:
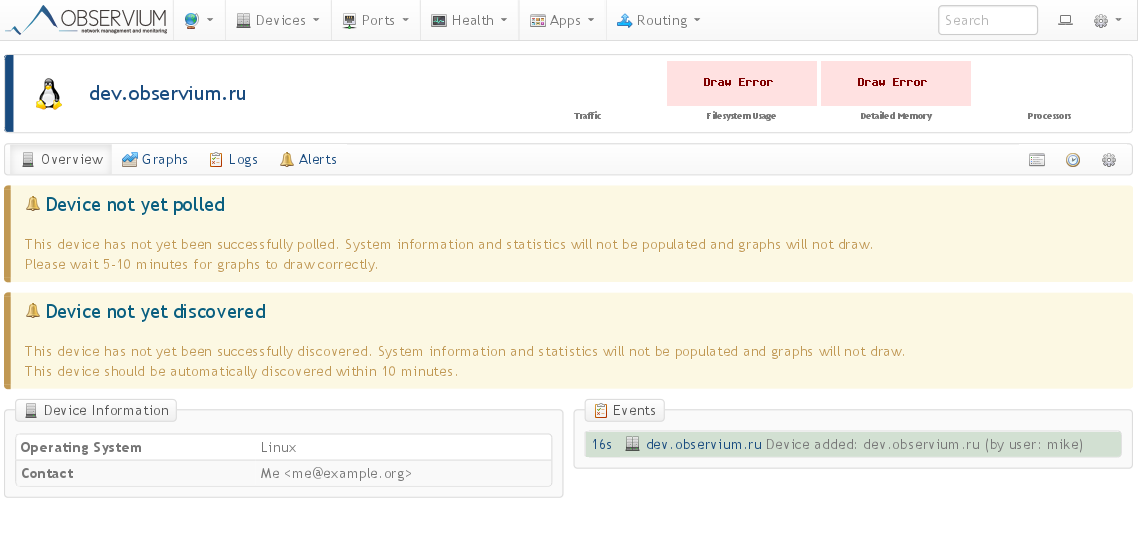
Device added, waiting for discovery / poller completion:
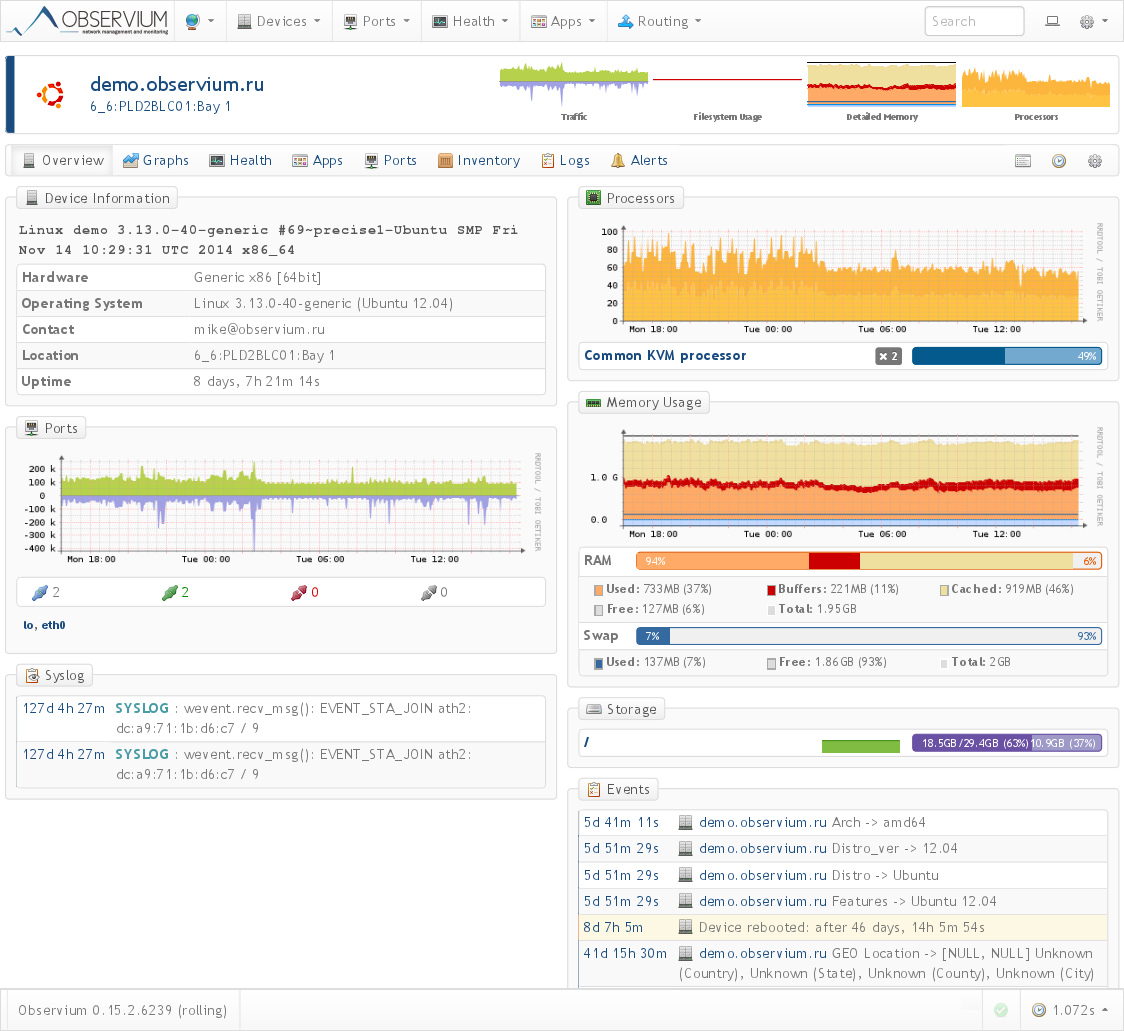
Device Overview:
In addition, adding new devices is possible in an automated mode from a file with a list of devices and / or through device discovery using the CDP / LLDP and BGP / OSPF protocols.
After the device has been added to the system, its entire “life cycle” will be monitored automatically. For example, if the memory is increased, or a new sensor is added, or a port is added / removed, it will all be detected without manual intervention.
The entire collection of statistics is divided into 2 main processes:
- discovery , where the main detection of sensors or counters supported on this device is performed;
- poller , where the detected sensors are polled every 5 minutes;
There are also 2 additional processes working in conjunction with the poller process, but they are only in the subscriber version:
- bill , counting billing information on individual ports for users;
- alert , this is a relatively recent process for generating notifications on almost any parameter collected by the system.
Processes, in turn, are divided into modules corresponding to the information collected. There are many modules, the main ones are os, system, ports, mempools, processors, sensors and others. In the screenshot of the page above you can see that such parameters are collected as OS, version, device stuffing.
And, finally, the modules are divided into MIBs, a list that is taken from the definition file for various operating systems.
Information varies depending on the device manufacturer, type and available sensors for a particular device. Under the spoiler are a few examples:
Various devices
Cisco 7606

Cisco 2960C

APC PDU

Olivetti printer

Cisco 2960C
APC PDU
Olivetti printer
Overview page:
A few more spoilers
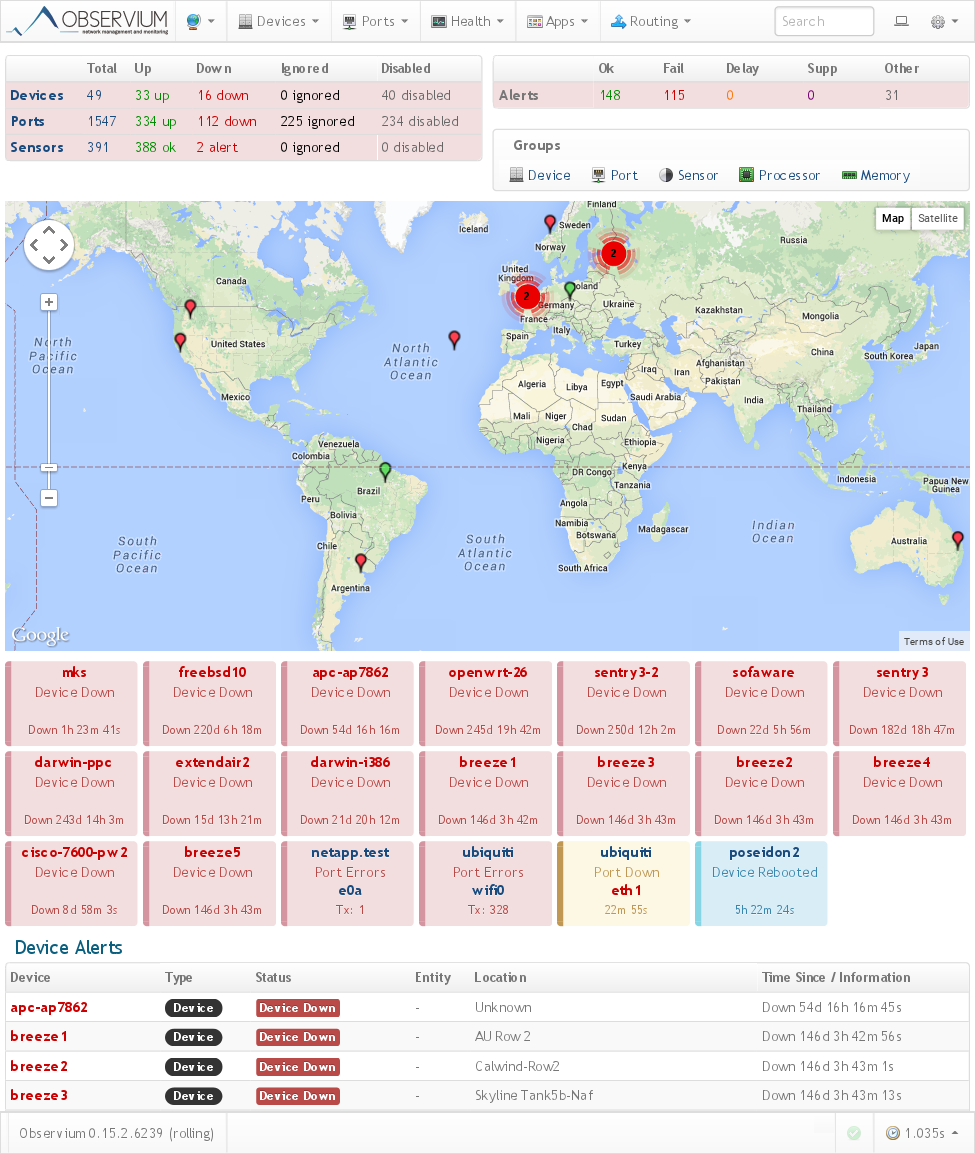
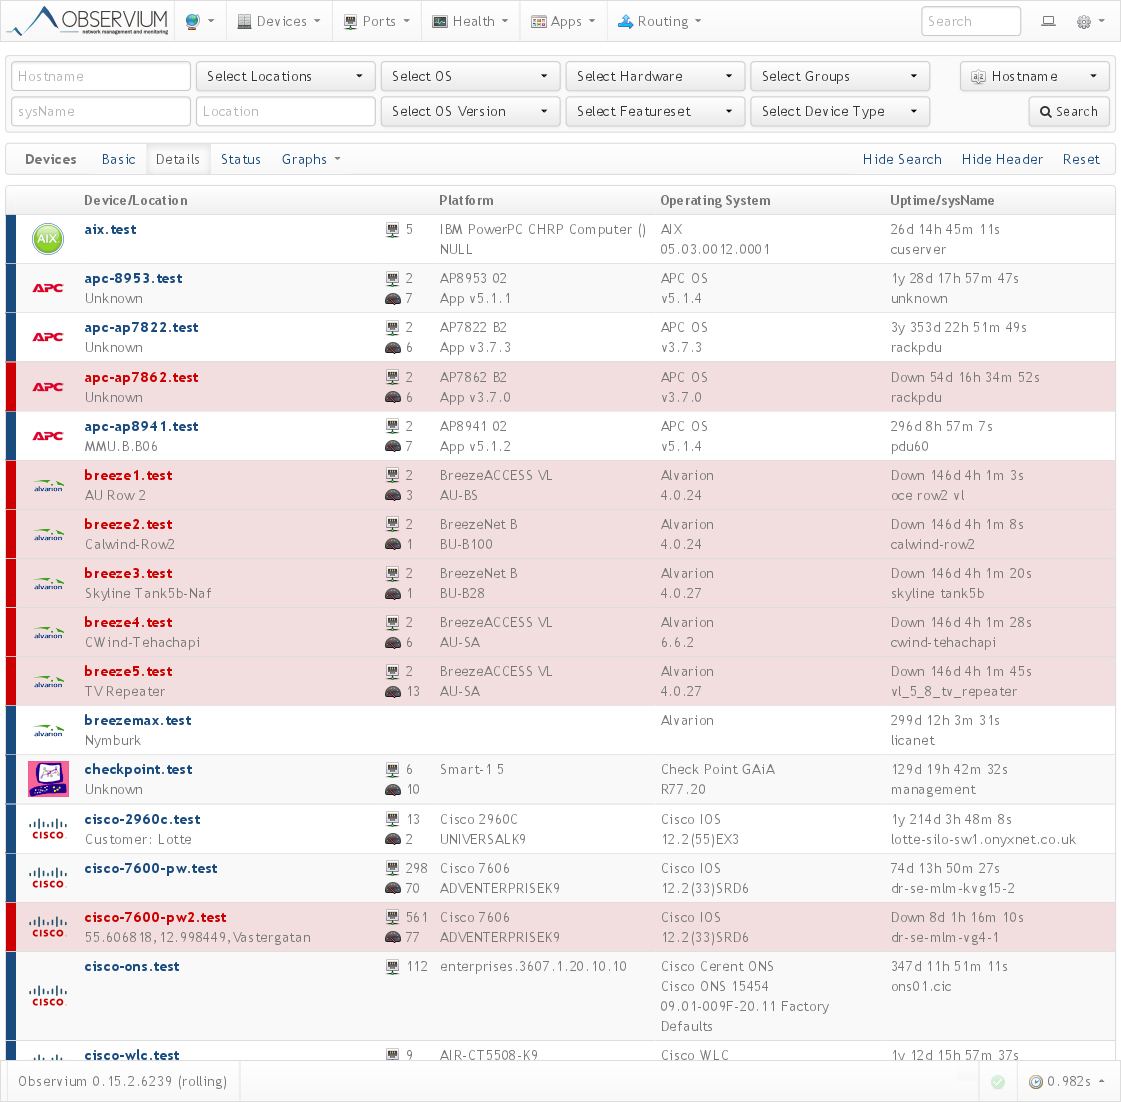
Overview of all devices:
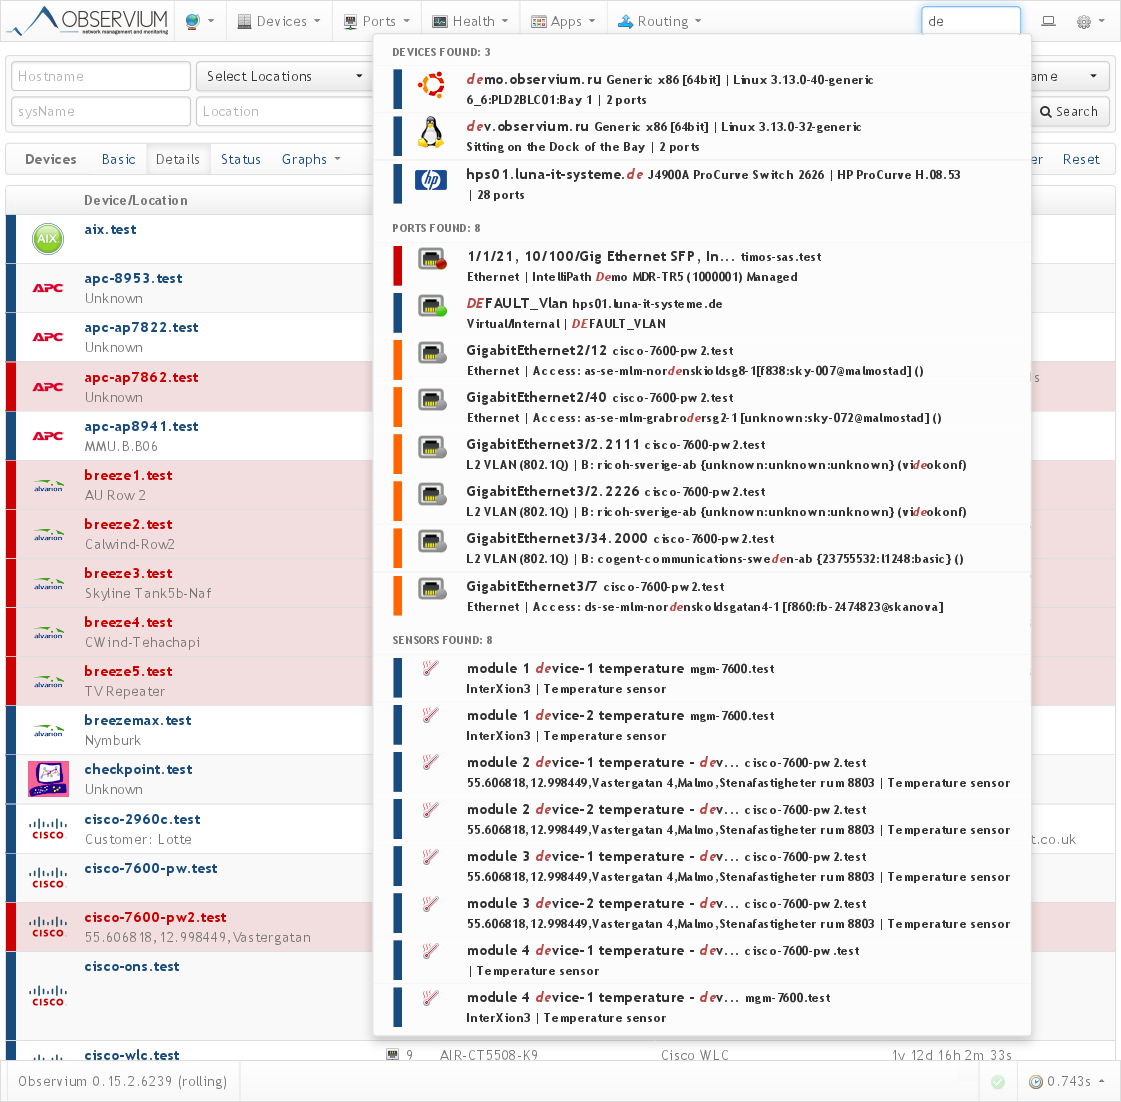
Quick search:
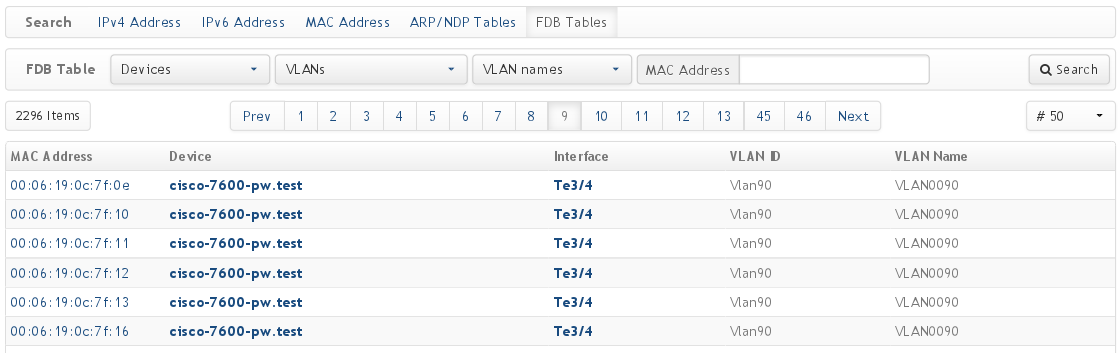
Search by IP / MAC / ARP / FDB:
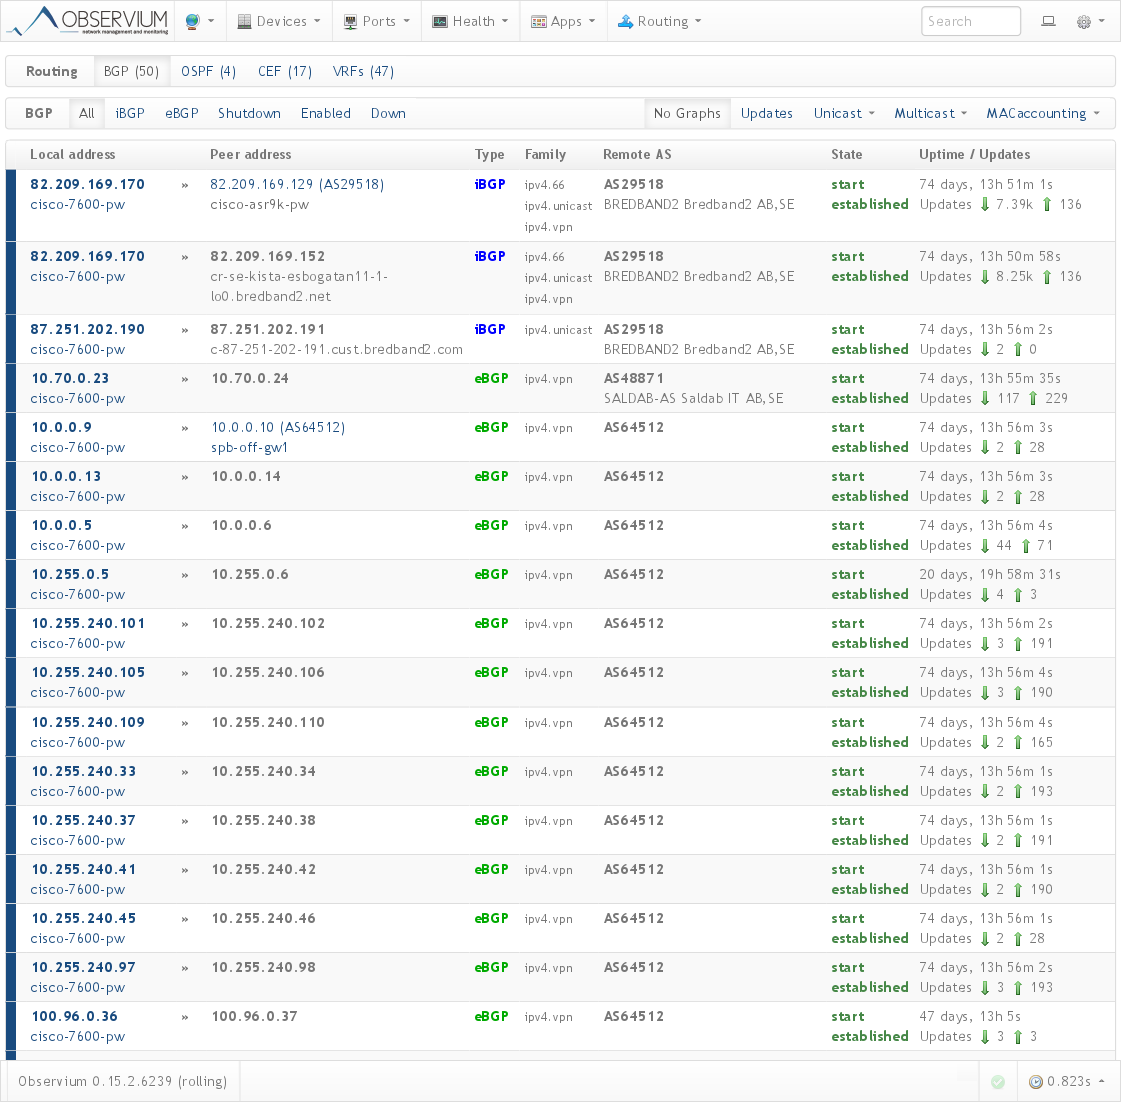
BGP:
RANCID and configuration change history:


Quick search:
Search by IP / MAC / ARP / FDB:
BGP:
RANCID and configuration change history:
The system integrates with various external utilities, such as syslog, rancid (including showing recent changes), collectd, smokeping, nfsen.
Monitoring of sensors via IPMI is supported.
There is monitoring services such as Apache, Nginx, Mysql, Bind and others, through unix-agent.
Monitoring of some virtualization systems is supported.
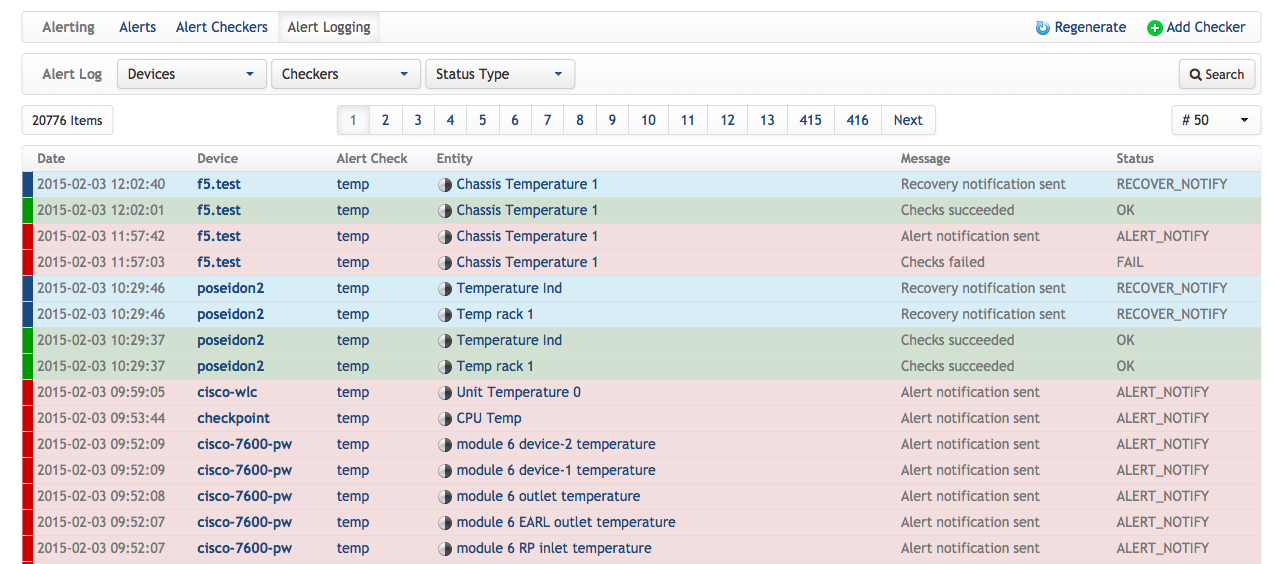
As mentioned above, in the paid version there is a process for active notifications. It will not replace such systems as nagios / icinga or zabbix, since at the moment it is limited to 5-minute polling intervals for devices, but it is capable of providing 60% of the notification needs. And for systems with a small (<50) number of devices, it is fully ready to replace any other system. Under the spoiler a few more pictures for him.
Active notifications
Validation rules:

Current notifications:

Notification log:
Current notifications:
Notification log:
With pictures, probably enough, just do not show. The majority of opportunities can be seen on a demo page ( oh, only the request not to create habraeffekt ) here .
Otherwise, I ask you to ask questions and suggestions, if you need something to supplement the article.
Source: https://habr.com/ru/post/249623/
All Articles