Monitoring of Cisco network equipment in the Observium system

Observium is a system focused on the collection and analysis of information, allowing to identify the underlying problems in the network. If you are faced with the task of conducting an audit of network equipment, chart an IP plan of an unfamiliar network - Observium is one of the best free tools for this. The article provides an overview of the main features of the system - primarily with respect to Cisco equipment, as well as several real-life examples of identifying problems with the customer’s network using Observium (many pictures).
In this article I will try to describe the main features of the system, without affecting the installation and configuration process.
Observium is available in two versions - the free Community and the moderately paid Professional (£ 150 for a one-year subscription). Below will be considered only the Community version.
')
The device is polled via the SNMP protocol. To add a Cisco router, just set the SNMP community:
snmp-server community public RO ./add_device.php hostname On the Devices tab, a list of added devices is available, with the ability to filter by platform type and software version, which is convenient, for example, when preparing for an upgrade: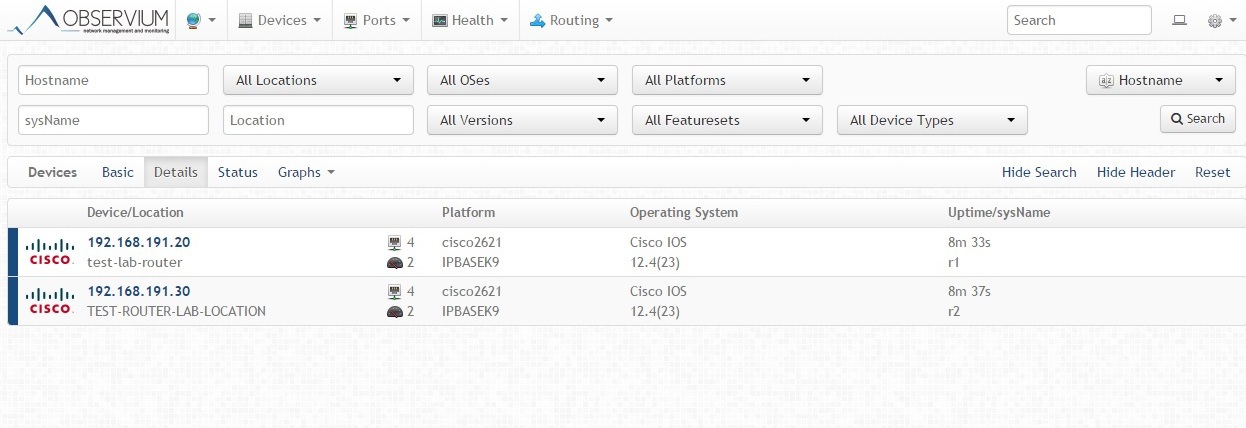
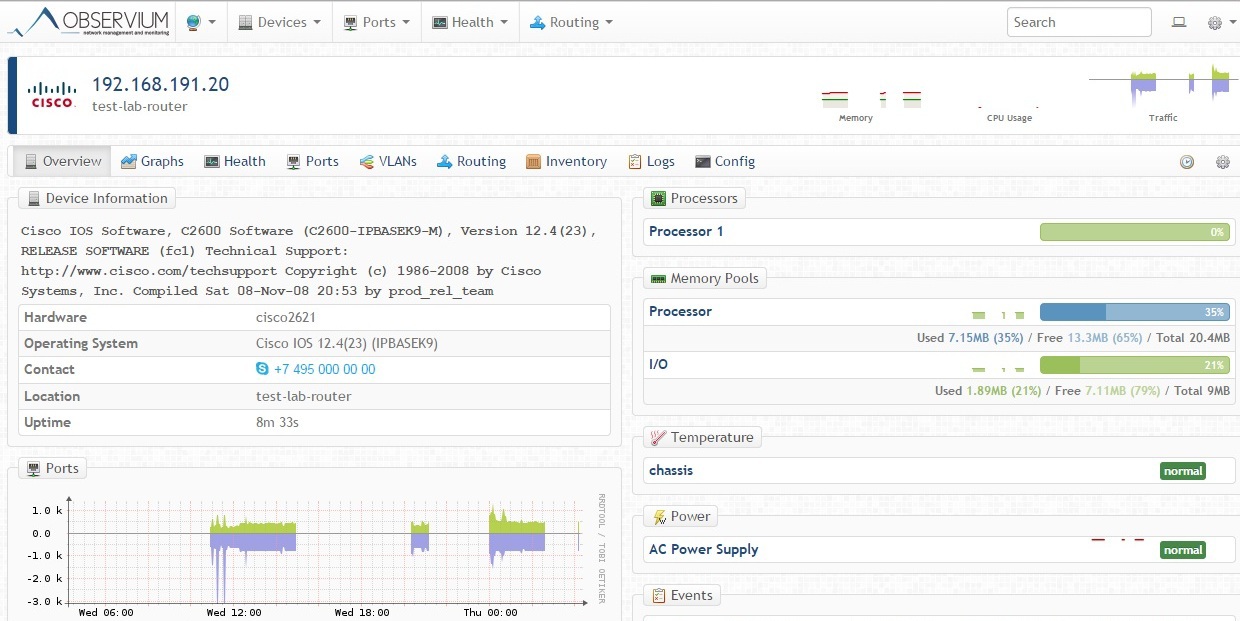
The device information contains data on CPU usage, memory, and a graph of the total traffic from all ports:
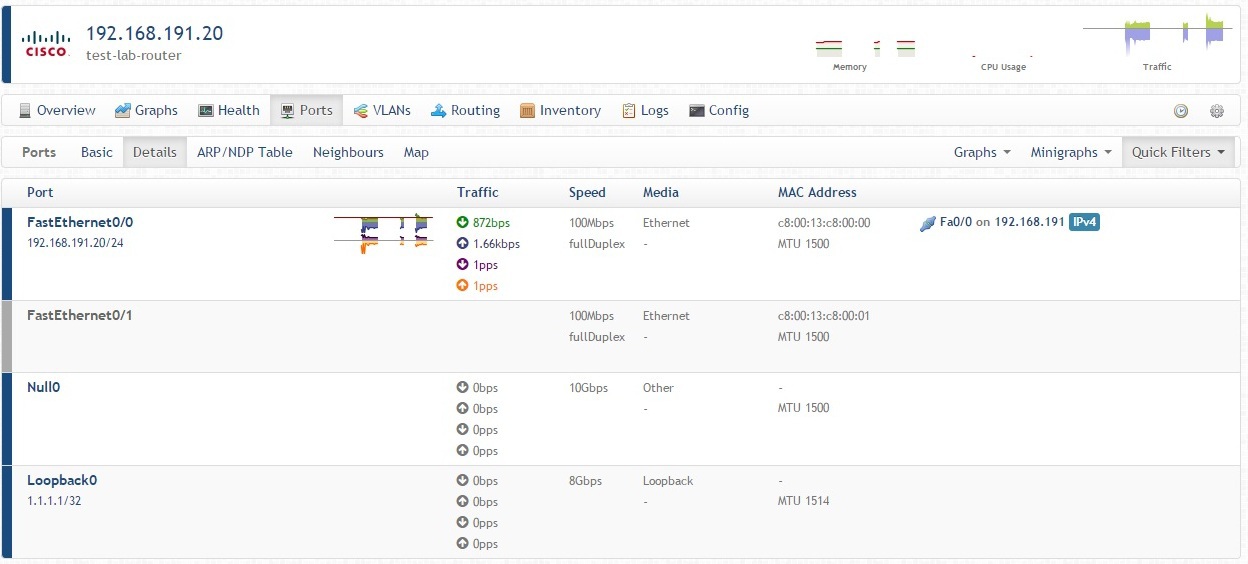
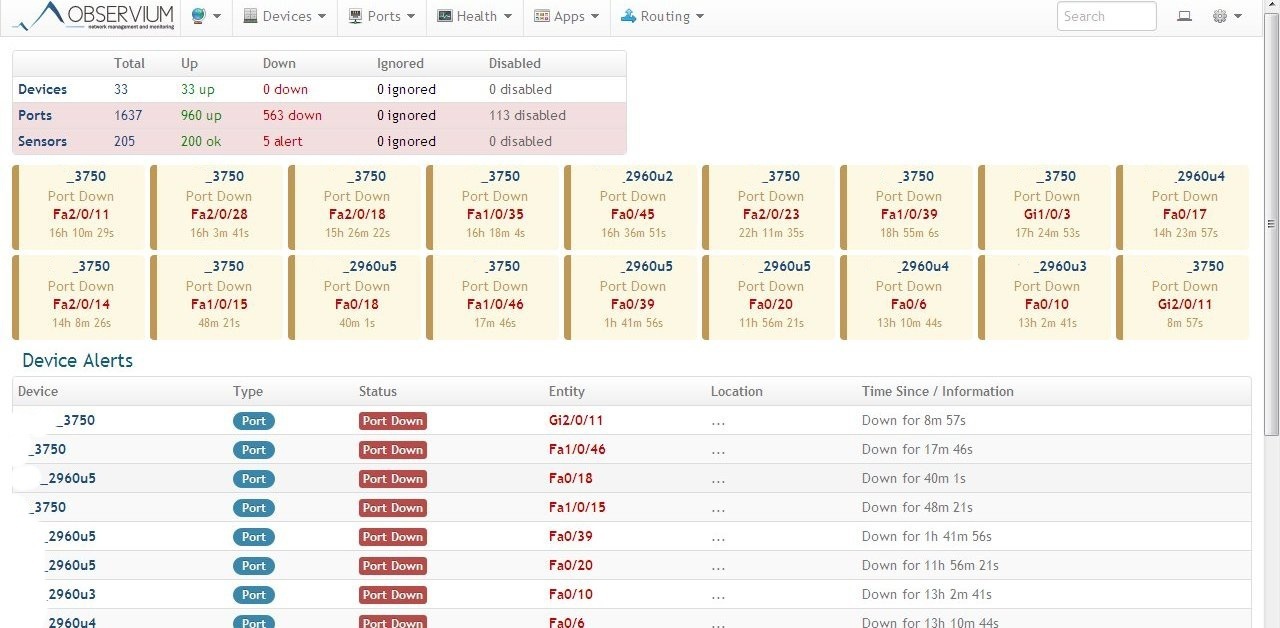
Of greatest interest is the Ports tab, which displays a list of available interfaces with IP and MAC addresses, the current download traffic Unicast Up / Down Link, Broadcast Up / Down Link and other useful information. The last column indicates neighboring devices (provided that they are also added to the monitoring), which is very convenient when drawing up a network map.
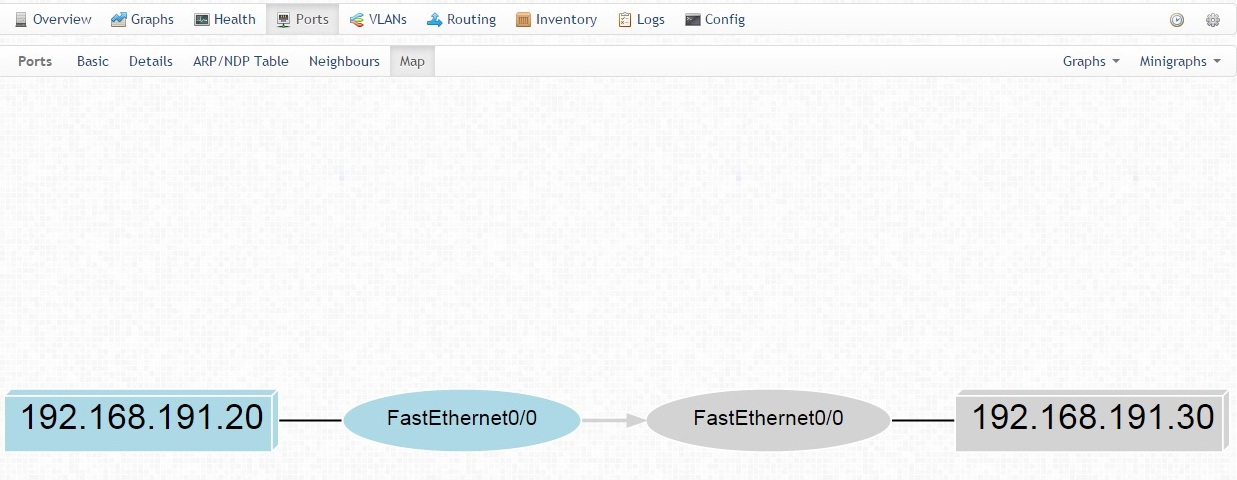
If CDP / LLDP is enabled on devices, you can see the neighbor map:
Information is also available on enabled routing protocols (OSPF example):

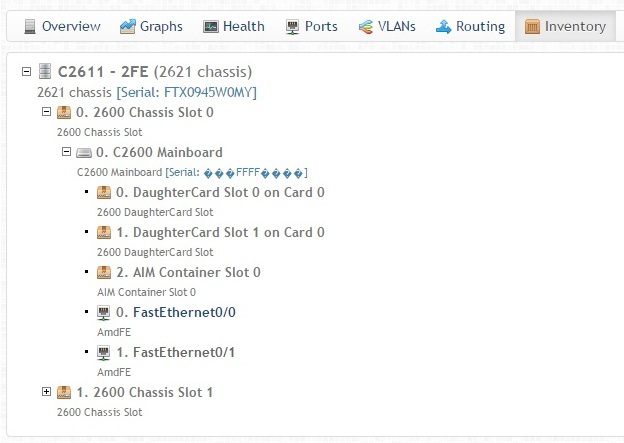
The Inventory tab contains a list of boards and serials, up to the SFP modules (here some of the information is displayed incorrectly, because the GNS3 emulator was used instead of the real router)
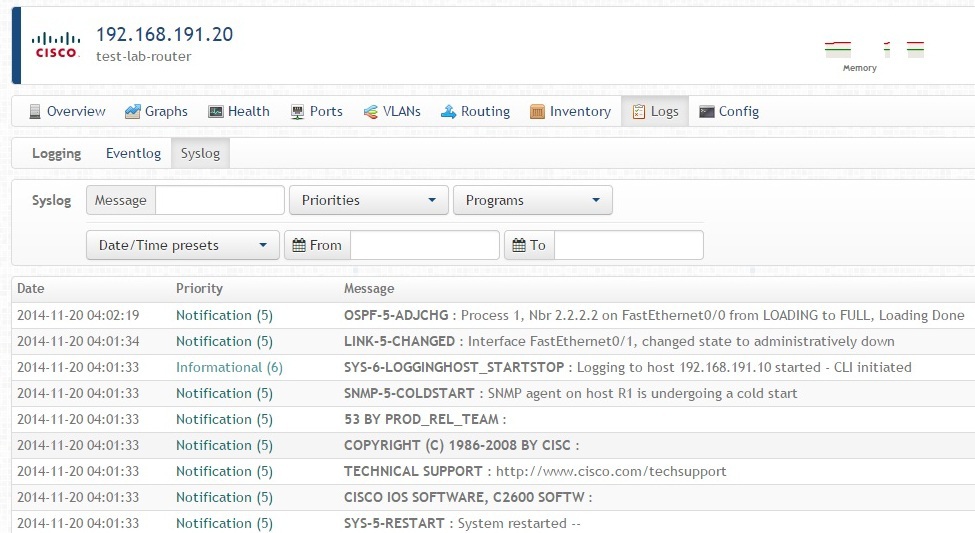
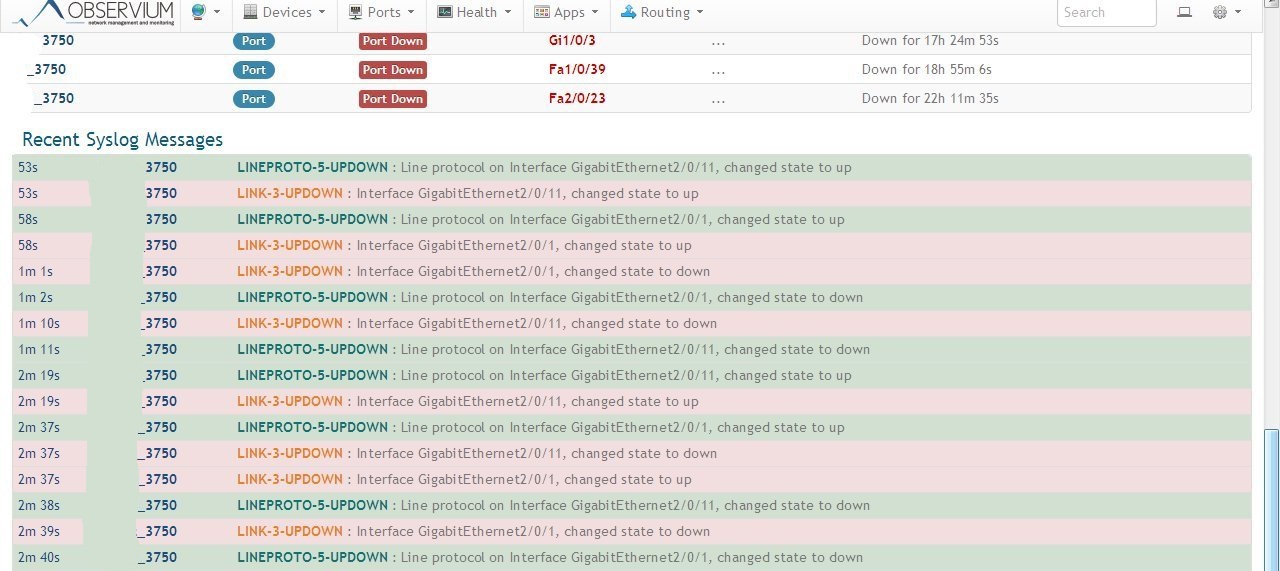
Observium can be used to view Syslog messages (integration with RSyslog):
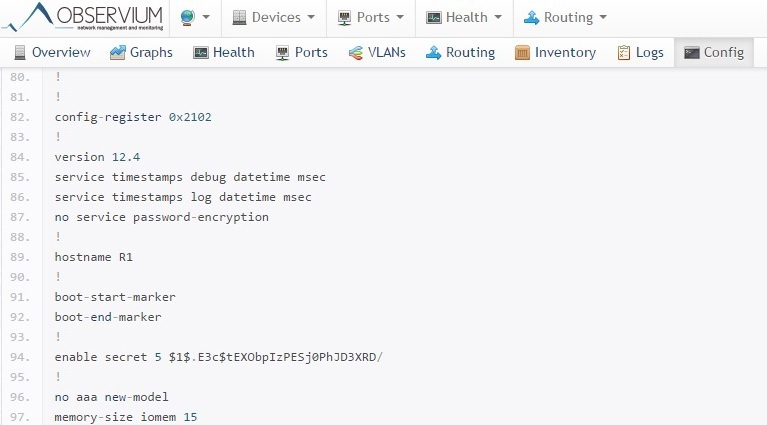
From third-party applications, the RANCID configs collector is also supported, which allows you to view the saved config:
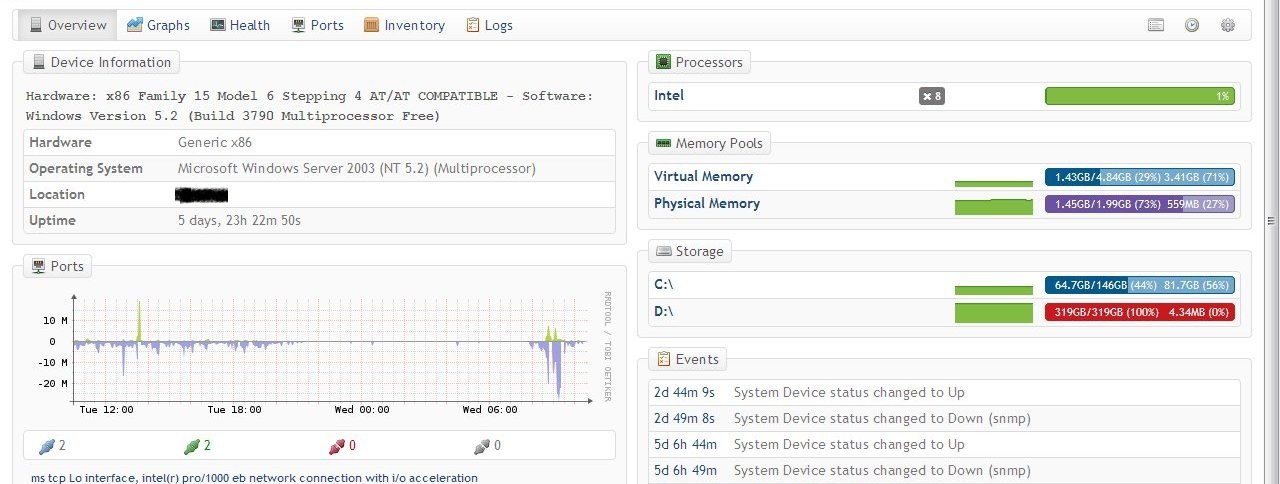
In addition to the network hardware, Observium can monitor Windows servers and workstations. You do not need to install the agent, just start and configure the SNMP service. As for routers, information on network cards is available - IP, MAC, the port of connection of the neighboring device. Here the disk space D ended:
Opportunities for monitoring Linux servers more. In the simplest case, snmpd installation is sufficient:

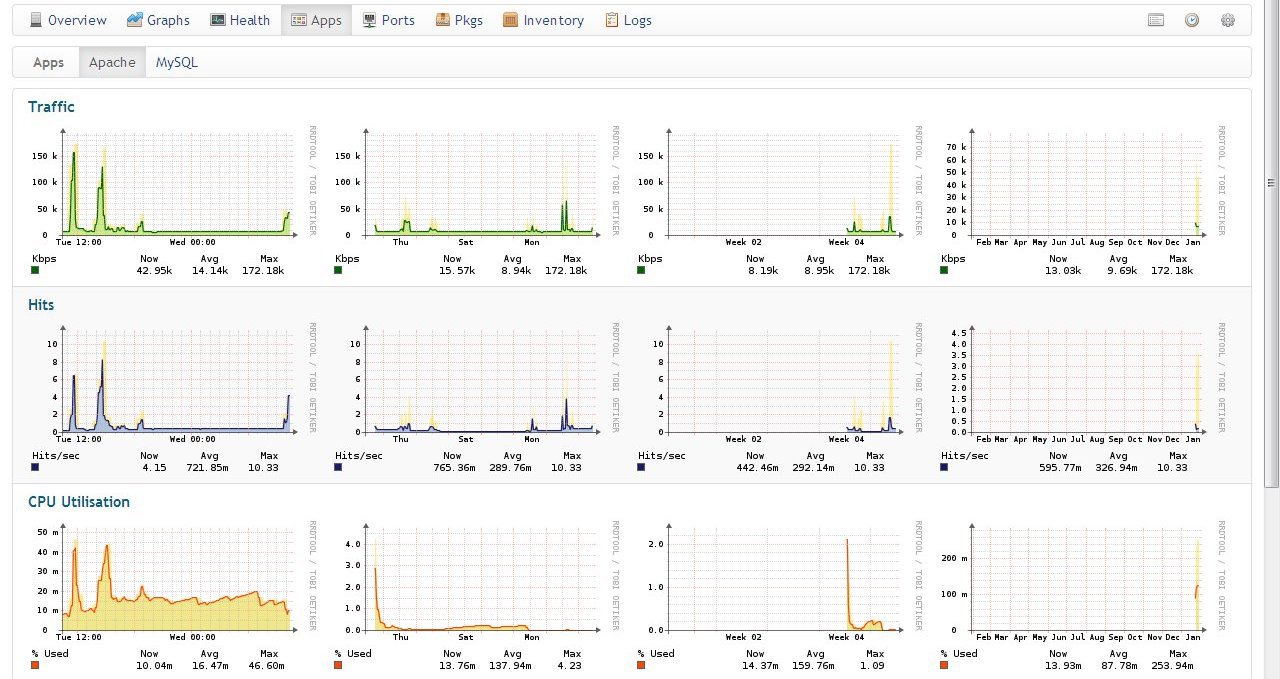
When installing additional Unix Agent scripts, you can monitor individual applications, such as Apache:
Actually, monitoring the Observium Community is suitable only for non-response time critical services, since SNMP devices are polled once every 5 minutes. In the paid version the module Alarms is provided.
The disadvantages can still be attributed not very conveniently implemented map with devices - it is tied to google maps, which requires an internet connection. Custom maps, as in the same zabbix, are not provided. An example of a home page with a disabled map:
At the bottom of the Syslog main page:
And finally, 2 examples of problems solved with the help of Observium.
1. The customer complains about the loss of packets in the channel between the central hub and the branch.
Interface loading graph on the central node (purple color - outgoing traffic):

Interface loading schedule in the branch (green color - incoming traffic):

As it turned out, the provider instead of the stated 10Mbit / s provided the service in the branch at a speed of 2Mbit / s. Also, the download schedules made it possible to properly configure QoS policies - it was necessary to shape outgoing traffic at the central site up to the branch rate of 10Mbit / s
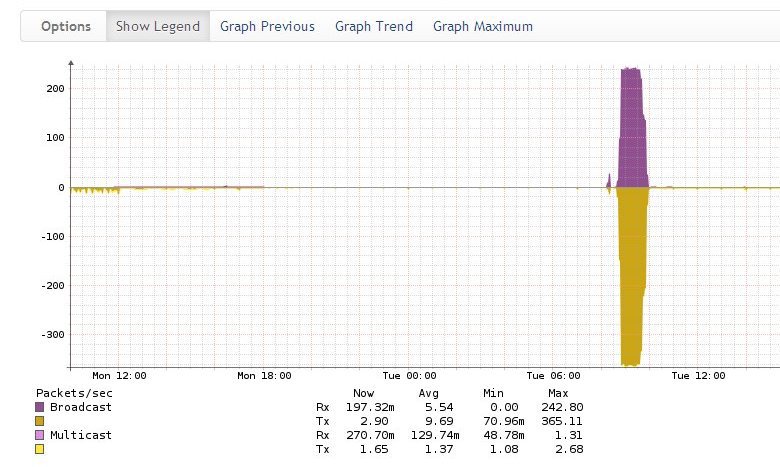
2. The customer complains about the delay in obtaining an IP address via DHCP.
An abnormal CPU usage on the switch has been detected:
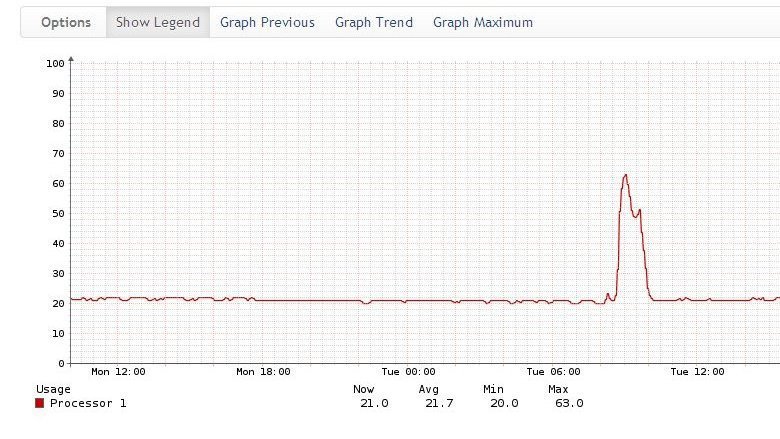
Which immediately suggests thoughts of a Broadcast storm. The Broadcast traffic graph confirms the guess - the time activity coincides with the CPU load:
Charts for all ports allow you to identify the source (purple):

That's all, there will be time, I will try to write an article on configuring Observium.
Source: https://habr.com/ru/post/249549/
All Articles