We decipher the formula of the Habr-rating or the restoration of functional dependencies according to the empirical data
If you have ever read the help section on Habré, you probably saw a most interesting line there:
from which district it is equal to what?
Today we will answer this question.

(we measure Habra-rating in parrots)
')
In this part, we consider the basic properties that any rating function should satisfy, and using our knowledge of the subject area, we will try to guess the specific type of function.
What does the rating depend on in principle? Rating of any user is formed by the actions of other users, or rather their vote for karma, topics and comments. There are no other ways to influence the users' indicators of Habra residents. This means that our function accepts the value of karma (rational), votes on topics (integer) and comments (integer) and returns a rational number.

Moreover, we know that karma and votes for comments and topics independently influence the rating, which means that our ternary function splits into some composition of three unary. Suppose it is a sum of three functions.

What boundary conditions must any rating function satisfy? Boundary conditions - any new user has a rating equal to zero; if the user has not written a single post, it means that the contribution of posts to the rating is also zero, etc.
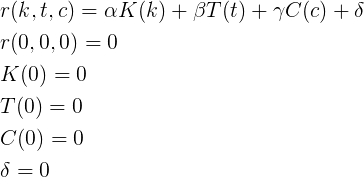
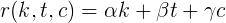
What else do we know about these features? They should be monotonically increasing and simple to calculate (that is, somehow simply expressed through elementary functions). Consider the simplest option - a linear relationship for each of the parameters.
Using boundary conditions, we can easily derive these coefficients. Consider the case when only karma has a contribution to the rating (i.e., there are no posts and comments for the last 30 days).

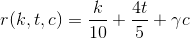
Substitute alpha equal to one tenth in the formula:

Having received the first coefficient, we can take another user for whom one of the undefined coefficients is zero and calculate the second coefficient:

We substitute 4/5 for the place of the beta in the formula:
And the final touch.
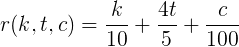
Taking any other user, and substituting all the parameters, we get that the gamma is equal to 1/100.
Then, the rating function from karma k , votes for topics t and comments c is equal to
It is clear that the formula derived by three points may be incorrect - there is an infinite number of functions passing through three points. Therefore, this hypothesis is worth testing. How? Let's try to get these coefficients directly from the data using classical regression and compare with those obtained.
If our hypothesis is correct, then we will get a model with coefficients similar to analytical (and high parameters of confidence in the model's correctness).
Data on the rating and the corresponding parameters of karma, votes for posts and comments (there are many other interesting and tasty data on Habra) are available here:
github.com/SergeyParamonov/HabraData/blob/master/users_rating.csv
Let's start
As we can see, the value of the coefficients for karma and posts actually coincides, and, judging by the parameters, the model is fairly confident in estimating these two parameters. But what about the third parameter (contribution of comments to the rating)? And where does the difference in coefficients come from, if it is known that the function should be deterministic?
It would seem that the classical regression seriously contradicts the formula we obtained - it differs in the estimation of the third parameter by 50% and does not coincide ideally in the other two. However, it is known that the classical regression is incredibly unstable to statistical outliers. Let's take a look at them, that is, the set of points whose rating value is significantly different from the analytical formula we obtained.
Here you can see that the author of this article is in the list. Why? Because there is an article written 30 days ago, which means it did not get into the data sample, but voices disappear within three days. From here there is a difference in a rating and indications of the received formula.
But this is not true for all points, for example, take the Guderian record. He has no boundary articles in the past 30 days. Where does the difference come from? Everything is very simple. TM incorrectly counted him a rating on Habré, since his article moved to megamozg, and he has the missing votes on articles for it.

Bingo! We explained where the wrong points come from:
But all this sounds like fitting the answer, not a beautiful verification of the hypothesis, is it? And here we come to the rescue ...
Suppose we have a set of emission points in the sample and it is small, well, for example, up to 5%, and a sufficient sample by users (1500 is experimentally short with the top), then we use emission-resistant regression methods ( robust regression , and here is an interesting KDD tutorial on topic).
Let's try to use the method right out of the box:
Voila, the coefficients are found and they coincide exactly with those obtained analytically.
Download here and apply on this data.
For those who do not want to go far behind the script:
Here, of course, an attentive reader can say: “Well, now TM will have to invent a new secret rating calculation function”, and this is why in this part we will discuss why it is useless to hide the rating function.
We give the main properties of the rating:
All this allows for the elementary collected data to restore this function automatically using the methods of stable regression and selection of unary functions separately from each other. Introducing noise, non-deterministic elements, and probabilities will only complicate the task a little and may have a marginal effect on the accuracy of the parameters.
Security through obscurity does not work here either.
When I wrote Habr-Monitor (this is part of Habr-analytics , if you write to Habr, then perhaps the resource will be useful to you), which displays the change of article parameters in time, the first thing I wanted to tie is the change in votes over time. For several reasons, this option is not available for viewing before voting for the post. Having an analytic function for the user's rating, you can always display the rating of his current article (provided that it is one and it does not have articles on which the voices “disappear” at the moment).
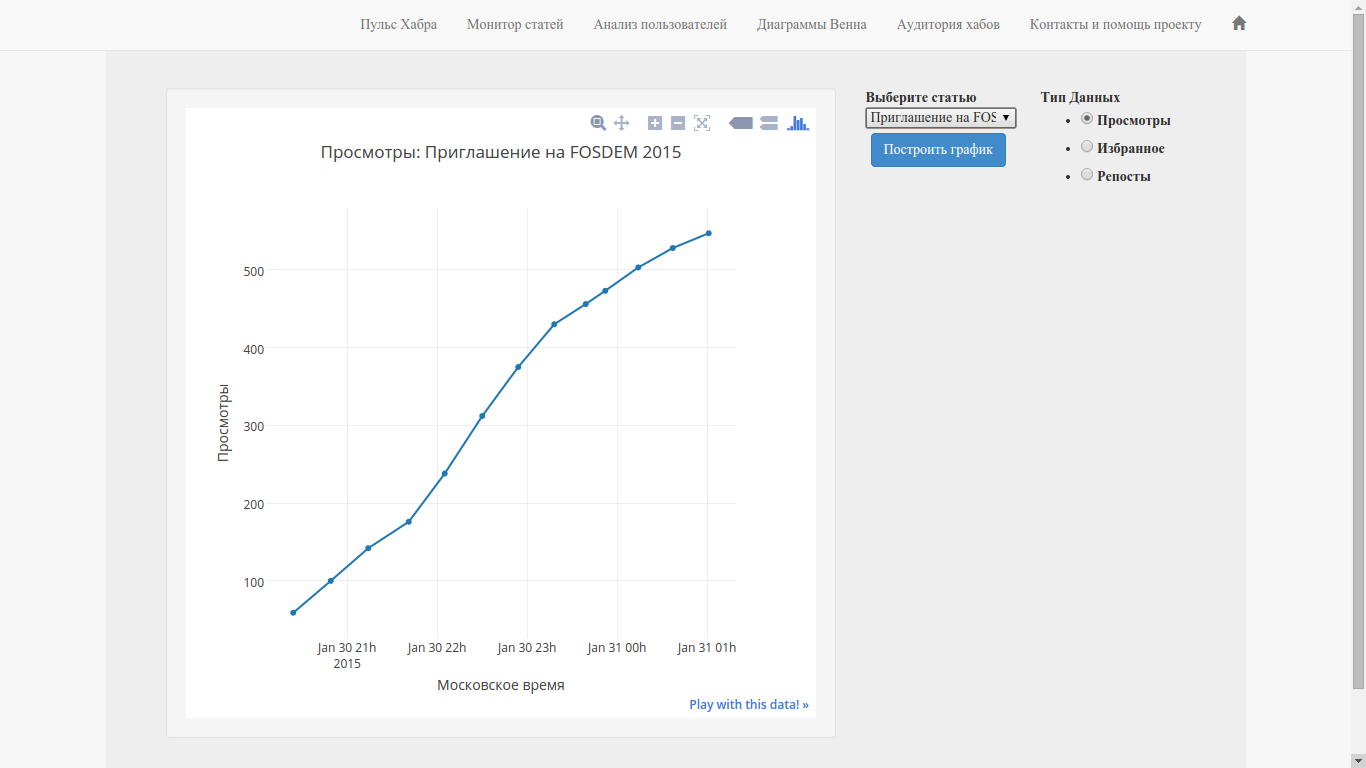
In fact, having this function it is possible to fasten the article rating parameter to the monitor (picture below).
It will also allow SoHabr to fasten a rating of articles.
Voices for comments have practically no contribution to the rating, even the highest- rated comments in the entire history of Habr (~ 400 +) add to the rating of 4-5 points, that is, the same amount as the article with 6-7 points.
Karma lost its weight in relation to the rating, it had previously had a coefficient of 0.5, and now it is 0.1, which makes the top much more dynamic (it was almost impossible to enter the top-10 before).
Every 5 votes for an article brings 4 points to the rating, that is, multiplying by 0.8 votes of the article, we get an increase to the rating. At the moment, this is the most significant and in fact the only determining user rating factor.
And yet, X = 80 .
PS statement ( from here )
Suppose you wrote a publication with a rating of +100 - this added the X value to your personal rating. After a few dozen days, this same X will be deducted, thereby returning you to its original place.then they probably wondered what kind of X is and
Today we will answer this question.
(we measure Habra-rating in parrots)
')
Article structure
- Analytical conclusion
- Regression
- Exceptions
- Sustained regression
- Script and data
- Why hide the function is useless
- What can be done with this?
- Interpretation of the formula
Analytical conclusion
In this part, we consider the basic properties that any rating function should satisfy, and using our knowledge of the subject area, we will try to guess the specific type of function.
Basic assumptions
What does the rating depend on in principle? Rating of any user is formed by the actions of other users, or rather their vote for karma, topics and comments. There are no other ways to influence the users' indicators of Habra residents. This means that our function accepts the value of karma (rational), votes on topics (integer) and comments (integer) and returns a rational number.
Moreover, we know that karma and votes for comments and topics independently influence the rating, which means that our ternary function splits into some composition of three unary. Suppose it is a sum of three functions.
What boundary conditions must any rating function satisfy? Boundary conditions - any new user has a rating equal to zero; if the user has not written a single post, it means that the contribution of posts to the rating is also zero, etc.
What else do we know about these features? They should be monotonically increasing and simple to calculate (that is, somehow simply expressed through elementary functions). Consider the simplest option - a linear relationship for each of the parameters.
Derivation of coefficients
Using boundary conditions, we can easily derive these coefficients. Consider the case when only karma has a contribution to the rating (i.e., there are no posts and comments for the last 30 days).
Substitute alpha equal to one tenth in the formula:
Having received the first coefficient, we can take another user for whom one of the undefined coefficients is zero and calculate the second coefficient:
We substitute 4/5 for the place of the beta in the formula:
And the final touch.
Final formula
Taking any other user, and substituting all the parameters, we get that the gamma is equal to 1/100.
Then, the rating function from karma k , votes for topics t and comments c is equal to
Regression
It is clear that the formula derived by three points may be incorrect - there is an infinite number of functions passing through three points. Therefore, this hypothesis is worth testing. How? Let's try to get these coefficients directly from the data using classical regression and compare with those obtained.
If our hypothesis is correct, then we will get a model with coefficients similar to analytical (and high parameters of confidence in the model's correctness).
Data on the rating and the corresponding parameters of karma, votes for posts and comments (there are many other interesting and tasty data on Habra) are available here:
github.com/SergeyParamonov/HabraData/blob/master/users_rating.csv
Let's start
1478 users regular regression Call: lm(formula = rating ~ karma + topic_score + comment_score - 1, data = data) Coefficients: Estimate Std. Error t value Pr(>|t|) karma 0.1017172 0.0006097 166.842 < 2e-16 *** topic_score 0.7862749 0.0020999 374.428 < 2e-16 *** comment_score 0.0153159 0.0031884 4.804 1.72e-06 *** As we can see, the value of the coefficients for karma and posts actually coincides, and, judging by the parameters, the model is fairly confident in estimating these two parameters. But what about the third parameter (contribution of comments to the rating)? And where does the difference in coefficients come from, if it is known that the function should be deterministic?
Exceptions
It would seem that the classical regression seriously contradicts the formula we obtained - it differs in the estimation of the third parameter by 50% and does not coincide ideally in the other two. However, it is known that the classical regression is incredibly unstable to statistical outliers. Let's take a look at them, that is, the set of points whose rating value is significantly different from the analytical formula we obtained.
>data$dif <- abs(rating - karma/10 - topic_score*0.8 - comment_score/100) >print(data[data$dif > 2, ]) user rating karma topic_score comment_score dif akrot 80.21 25.00 91 13 4.780 anegrey 60.30 31.50 114 15 34.200 Guderian 56.02 119.00 32 6 18.460 ilusha_sergeevich 154.27 157.75 177 11 3.215 ParyshevD 69.27 42.00 130 7 39.000 PatapSmile 48.75 246.00 0 0 24.150 rw6hrm 38.81 33.00 71 1 21.300 varagian 81.34 170.00 50 34 24.000 Here you can see that the author of this article is in the list. Why? Because there is an article written 30 days ago, which means it did not get into the data sample, but voices disappear within three days. From here there is a difference in a rating and indications of the received formula.
But this is not true for all points, for example, take the Guderian record. He has no boundary articles in the past 30 days. Where does the difference come from? Everything is very simple. TM incorrectly counted him a rating on Habré, since his article moved to megamozg, and he has the missing votes on articles for it.

Bingo! We explained where the wrong points come from:
- boundary articles written 30 to 33 days ago, with disappearing voices;
- moving and division Habr;
- articles cleaned up in drafts or offtopics (UFO or by the author).
But all this sounds like fitting the answer, not a beautiful verification of the hypothesis, is it? And here we come to the rescue ...
Sustained regression
Suppose we have a set of emission points in the sample and it is small, well, for example, up to 5%, and a sufficient sample by users (1500 is experimentally short with the top), then we use emission-resistant regression methods ( robust regression , and here is an interesting KDD tutorial on topic).
Let's try to use the method right out of the box:
library("MASS") ... Call: rlm(formula = rating ~ karma + topic_score + comment_score - 1, data = data) Coefficients: Value Std. Error t value karma 0.10 0.00 23463021.30 topic_score 0.80 0.00 54494665.88 comment_score 0.01 0.00 448681.05 Voila, the coefficients are found and they coincide exactly with those obtained analytically.
Script and data
Download here and apply on this data.
For those who do not want to go far behind the script:
R regression code
library("MASS") data <- read.csv("users.csv", header=T, stringsAsFactors=F) names(data) <- c("user","rating","karma","topic_score","comment_score") fit <- lm(data=data, rating ~ karma + topic_score + comment_score - 1) print("regular regression") print(summary(fit)) fit <- rlm(data=data, rating ~ karma + topic_score + comment_score - 1) print("robust regression") print(summary(fit)) attach(data) data$dif <- abs(rating - karma/10 - topic_score*0.8 - comment_score/100) print(data[data$dif > 2, ]) Why hide the function is useless
Here, of course, an attentive reader can say: “Well, now TM will have to invent a new secret rating calculation function”, and this is why in this part we will discuss why it is useless to hide the rating function.
We give the main properties of the rating:
- the rating depends only on the actions of other users and channels for voting, of which there are only three: votes for posts, comments and karma;
- votes for posts, karma and comments are independent of each other the function is always decomposed into a composition of three independent unary functions from posts, comments and karma;
- each of these functions should be simply and quickly computable, since rating indicators need to be recalculated all the time for a large number of users;
- for the same reason, it must be expressible in elementary and monotonically increasing functions;
- the function must be deterministic and without noise, ie, for two users with equal indicators of karma, votes for posts and comments, the rating must be the same (for the effective period = 30 days).
All this allows for the elementary collected data to restore this function automatically using the methods of stable regression and selection of unary functions separately from each other. Introducing noise, non-deterministic elements, and probabilities will only complicate the task a little and may have a marginal effect on the accuracy of the parameters.
Security through obscurity does not work here either.
What can be done with this?
When I wrote Habr-Monitor (this is part of Habr-analytics , if you write to Habr, then perhaps the resource will be useful to you), which displays the change of article parameters in time, the first thing I wanted to tie is the change in votes over time. For several reasons, this option is not available for viewing before voting for the post. Having an analytic function for the user's rating, you can always display the rating of his current article (provided that it is one and it does not have articles on which the voices “disappear” at the moment).
In fact, having this function it is possible to fasten the article rating parameter to the monitor (picture below).

It will also allow SoHabr to fasten a rating of articles.
Interpretation of the formula
Voices for comments have practically no contribution to the rating, even the highest- rated comments in the entire history of Habr (~ 400 +) add to the rating of 4-5 points, that is, the same amount as the article with 6-7 points.
Karma lost its weight in relation to the rating, it had previously had a coefficient of 0.5, and now it is 0.1, which makes the top much more dynamic (it was almost impossible to enter the top-10 before).
Every 5 votes for an article brings 4 points to the rating, that is, multiplying by 0.8 votes of the article, we get an increase to the rating. At the moment, this is the most significant and in fact the only determining user rating factor.
And yet, X = 80 .
PS statement ( from here )
[...] over time, the rating will take on the value of half karma.already wrong.
Source: https://habr.com/ru/post/249375/
All Articles