How-to: What to consider when developing a strategy for a trading robot
Previously, we considered the stages of developing trading systems and studied ways to test the operation of the robot using historical data , but did not pay attention to another important aspect - the creation of the very strategy of working in the market. Today we fill this gap and talk about what needs to be considered when developing a strategy for a trading robot.
What you need to consider first
In order to succeed in the stock market, the developer of an algorithmic trading system must take into account their own personal qualities. Algorithmic trading requires a lot of discipline, patience and emotional stability. It is necessary to remember that the robot will carry out transactions - and it is necessary not to get involved in its work for good reason (and this can be difficult, especially if the so-called “drawdown” moment has arrived and the algorithm temporarily runs negative).
')
In addition to the nature of the character, several other important aspects need to be considered:
- Availability of time - does the future investor work full day or remotely, live near the office or have to spend several hours on the road? Answers to these questions will help determine the “frequency” of the trading strategy to be chosen. It is obvious that people who spend most of the day on the road and in the office should not create high-frequency strategies because they cannot control the operation of the robot. If the investor has a significant amount of time, then he might be more interested in plunging into the world of high-frequency trading (HFT)
- The importance of continuous market research - very rarely trading strategies can work successfully for a long time. As a rule, they constantly need to make changes to reflect the current market situation. As a result, the creators of trading systems devote a significant portion of their time to market research and the search for new trading ideas.
- The amount of available funds - transaction costs for algorithmic traders can be quite significant ( direct connection to the stock exchange, server rental for launching the robot, exchange commission and broker - ITinvest rates by reference ). It is believed that for an algorithmic strategy, the average starting capital should be about $ 50,000 - this opinion, in particular, is shared by the “quantum”, developer and investor Mike Halls-Moore.
- The ability to program - knowledge of programming languages such as C ++, C # Java, Python, R (or TradeScript - here are examples of robots in this scripting language) allows you to create all the elements of the robot - from the trading engine to the backtesting system.
- The financial goal - contrary to popular myth, algorithmic traders do not swim in money (at least very quickly get rich by creating a trading robot, most likely will not work). This is a long and painstaking work that must be considered. If a trader hopes to receive a stable income and withdraw a certain amount of money from a brokerage account, then he should choose the “frequency” strategy accordingly - the need to constantly withdraw funds will require a higher frequency strategy with little volatility, long-term investors can afford a more “calm” strategy of behavior the market.
How to look for ideas for trading strategies
Before you begin work on creating a trading strategy, you need to get general information about the stock market (here are our top 10 best books for this purpose), work on it in test mode (with virtual money). Mike Hulse-Moore mentioned above also recommends the following books (in English):
- Ernest Chan, Quantitative Trading: Your Own Algorithmic Trading Business
- Barry Johnston, Algorithmic Trading and DMA:
- Sheldon Neutenberg, Option Volatility & Pricing: Advanced Trading Strategies and Techniques
- Ewan Sinclair, Volatility Trading
- Larry Harris, Trading and Exchanges: Market Microstructure for Practitioners
A large amount of interesting information can be found in thematic communities, forums and blogs. Here are just some of them:
- Smart-Lab.ru - Russian-speaking community of traders;
- Moscow Exchange Forum ;
- Forum ITinvest ;
- Informational and analytical portal Elite Trader ;
- Developer Forum for Wealth Lab [ru];
- Blog The Whole Street [en];
- Quantopian Blog;
It should be understood that very often traders who post messages on forums too rely on technical analysis and the use of various indicators that help to detect trends and “reversal patterns”. This is a very popular method, but professionals in algorithmic trading consider it to be not the most effective (Halls-Moore calls it “as effective for an algorithm trader as reading a horoscope or guessing the coffee grounds”).
You can go further and study the so-called “academic strategies” that are published in scientific journals - this is also very useful and interesting, but there are also disadvantages: to get access to some journals you need a subscription, the strategies presented in them are often outdated and not always detailed described (for example, what type of orders is used - “by market” or “limit”?).
The streamlined process of monitoring a variety of thematic resources will help the trader to create a “knowledge machine” (as defined by Dropbox founder Drew Houston) and to constantly expand their horizons and a set of trading strategies. However, it is also obvious that not all strategies obtained in this way should even be tried to implement in real life.
Evaluation of trading strategy
The most important thing is to immediately give yourself an answer to the question “Do I understand this strategy?”. You also need to analyze the strategy for its realism (how often on the market there are situations that can lead to events described by the strategy). sustainability (how the strategy will behave if a new law regulating the market appears), the presence of complex statistical and mathematical rules in it, whether it depends on classes of financial instruments or financial time series . It is necessary to study all these factors, otherwise there is a high risk to spend a large amount of time on programming and testing on historical data of an absolutely unworkable strategy.
After the strategy has passed the primary filter, it is necessary to analyze once more how it suits a particular trader according to his personal qualities. If it is difficult for a person to survive long drawdowns of a deposit (that is, periods when work goes “in the minus”) that are embedded in some strategies, then he can “break” and stop the work of the robot, fixing losses just before the strategy in plus. There should be no emotion in the evaluation of the strategy; only well-defined criteria should be used.

Here is a list of some of the criteria proposed by Michael Hulse-Moore:
Methodology
How complicated is the strategy? How many parameters must be taken into account for its implementation (the more there are, the greater the likelihood of “optimization errors”)? Will the strategy be able to survive significant changes in the market (for example, changing laws or tightening regulation of financial markets)?
Sharpe Ratio
Using this ratio, the ratio of the possible profit to the riskiness of the strategy is estimated. The higher the Sharpe ratio, the better the results that the investment portfolio shows in relation to the risks taken.
Shoulder
Does the strategy involve the use of "leverage" (that is, borrowed funds) for the successful implementation of trade? Do derivative instruments that bargain with leverage participate in the strategy (such instruments usually have high volatility, which can lead to margin calls)? Does the trader have enough capital that can be conveyed to avoid closing positions?
Frequency
Higher frequency strategies require more capital, as well as more difficult to implement, than more "quiet" strategies. However, most often they have a higher Sharpe ratio.
Volatility
Volatility affects the riskiness of a strategy. The higher the volatility of the financial instruments used, the lower the Sharpe ratio, as a rule.
Total income and number of losing trades
There are generally profitable strategies in which the number of losing trades can even exceed the number of profitable ones - the main thing is that in case of success, the profit should be significantly greater than the possible losses.
Max drawdown
The value of the largest allowable capital reduction during the execution of the strategy. Momentum strategies are characterized by significant and long periods of deposit drawdown - even if backtesting proved that such behavior is normal for a strategy and does not affect its profitability, it will be hard for a trader not to close positions at the time of serious losses.
Number of parameters
The greater the number of parameters used in the strategy, the higher the likelihood of obtaining incorrect data in the optimization process, since in this case it will be hard to qualitatively test the strategy on historical data.
Benchmarks
The performance of most strategies is measured in comparison with some benchmark, the role of which is most often an index characterizing a large segment of financial assets similar to those used in the strategy. Such benchmarks can be the S & P 500 index, in Russia - the MICEX and RTS indices (here’s the material on why stock indices are needed ).
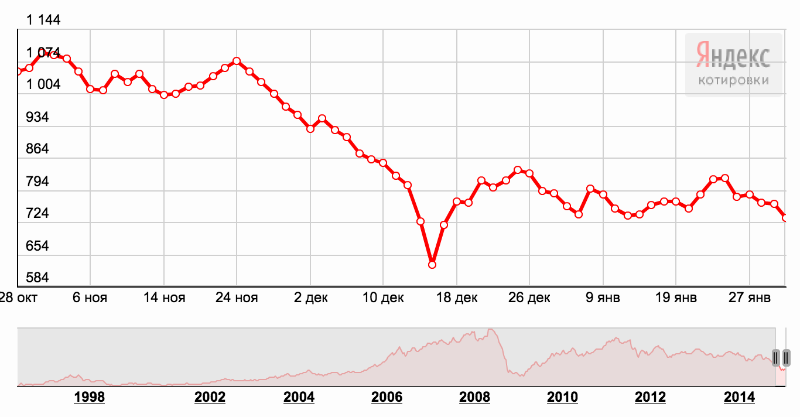
RTS Index Dynamics
The profitability of a strategy at a specific point in time cannot be a significant criterion in its evaluation, since it provides somewhat limited information about its effectiveness. It is always necessary to take into account not only possible profits, but also risks, as well as associated parameters, such as drawdowns.
At this stage, a significant number of previously selected strategies will be rejected, since they will not meet the criteria for capital availability, restrictions on leverage or drawdown. Strategies that have passed this filter can be tested on historical data.
Work with historical data
Before you start testing on historical data, you need to determine what data you need to get, where to get it, how and where to store, and also to understand whether it will not be too expensive.
Basic data
Data on macroeconomic trends, such as open interest , inflation, corporate actions (dividend payments, etc.), applications for IPOs, financial statements of companies, meteorological data, and so on. Such data is often used to evaluate specific companies or asset classes at a fundamental level. Some of this information can be found for free on the websites of stock exchanges, companies and government agencies, while other long-term fundamental data can be very expensive. There is no need to spend a lot of resources on their storage (if there is no need to simultaneously analyze the shares of many companies).
News data
There is no doubt that news affects the stock market - and there is much more such information. This includes news bulletins of large and small media, blog posts and microblogs. NoSQL databases are well suited for storing such unstructured data.
Data on asset price and frequency
This type includes true price series of specific assets - stocks, bonds, commodities and foreign stock indices. The simpler the asset (for example, a share), the easier it is to get such data (often this can be done for a small amount of money - here is the information about the fee for accessing the data on the Moscow Exchange trading). However, the volume of such data may require significant investment in their storage.
The higher the frequency of the data, the higher their cost and storage requirements. Some strategies require tick data and even copies of the so-called “order book” (order book). Work with such data is very difficult technologically. Among other things, the strategies described above will most likely be compared with benchmarks (S & P500 and FTSE100 index), which means that we will need data on these benchmarks.
Conclusion
As can be seen from the above, in order to create a successful strategy, it is necessary not only to study a large number of very different strategies, but also to take into account a large number of risks and other parameters. In addition, even before the stage of testing on historical data, you should think about what specific information you will need in order to get consistent and correct results, as well as how much you will have to pay for all this. Only after that you can proceed to the actual testing - this process we described in detail here .
Thanks for attention! We will be happy to answer questions in the comments.
Source: https://habr.com/ru/post/249299/
All Articles