Clustering: tell me what you buy and I will tell you who you are
The task of Datawiz.io : clustering loyalty program clients in retail.
Clustering is a method of searching for patterns, intended to split a set of objects into homogeneous groups (clusters) or search for existing structures in data.
')
The purpose of clustering is to obtain new knowledge . It's like “finding treasure in your own basement.”
Why do companies need it? To get to know your customers better . To find an individual approach to each client, and not to work with all equally.
Despite the fact that many companies use loyalty programs and possess enormous data, their analysts first determine the person of the buyer, and only then analyze her behavior.
Solution : Machine Learning allows you to go from the reverse, from personal preferences - to the person. We at Datawiz.io use clustering as a method of grouping customers according to their behavior — purchases, banking transactions, credit histories.
For clustering the data array (checks, data on loyalty programs) we use the K-means algorithm. It scales well and is optimized for Hadoop .
Also as an alternative, you can use the Affinity Propagation algorithm. Of course, it has a number of significant drawbacks: it is slow and does not scale well. But in particular cases, if desired, and the availability of free time, you can use it for clustering for short periods of time.
So, step by step.
1. Clean Data.
Before forming a matrix, we must clean the information without fail. We remove that does not affect the behavior of customers and is informational noise. For retailers, for example, you can exclude promotional products, issued discount cards, scratch cards, containers and packages purchased at the checkout. After the data is cleared, proceed to the formation of the matrix.
2. Form a matrix with input data.
Important : The results of clustering are very dependent on the period of time over which it is carried out. If we choose a short period, we will see current trends .
For example, after clustering before the New Year, we will see clusters that are not visible over a long period of time. (For example, the cluster “Lovers“ Olivier ”and“ Herring under a fur coat ”). Clustering over a long period will allow you to see the whole picture, that is, clients with stable behavior (“lifestyle”). “Students”, “Housewives”, “Pensioners”, etc.
For example, a retailer wants to cluster by a loyalty program in six months.
The store has Vasya's checks, which in six months bought 1 bread, 2 milk and 1 loaf; and Olya’s checks — she bought 3 breads, 5 milk and 2 loaves in six months, etc.
So the matrix for this retailer will look like this:
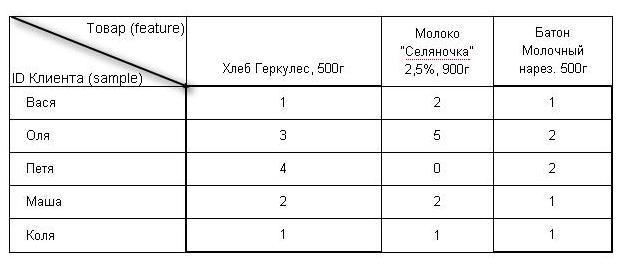
For the retailer, on average, features = 15 thousand SKU, and samples = 60 thousand customers.
Take each client separately, for example Vasya with all his checks for six months. Depending on the number of occurrences of all products for all his checks, we will place Vasya (and others) on the chart, where:
number of axles = number of goods ( features )
number of points = number of clients ( samples ) participating in the loyalty program.
Visual (and very sketchy :) image:

But the result of clustering by the k-means algorithm will look like this:

You can also carry out clustering on different levels of product categorization ( feature reduction ), then the matrix will look like this:

After the matrix is formed, you can proceed to the choice of the number of clusters.
3. Choose the optimal number of clusters.
We choose the number of clusters experimentally, based on our own experience. A small number of clusters will be ineffective and not informative, because in this case we get one or two “megaclusters”, which will include 98% of customers and several useless small clusters.
With a large number of clusters, there will be too many small groups. In addition, no one wants to analyze 5000 individual small clusters. For each case should be its own individual approach.
For long periods and a large number of clusters we use K-means.
4. We carry out clustering.
We select the K-means algorithm (or Affinity Propagation), use the scikit-learn Python library, give the resulting matrix to the input, start clustering.
5. Analyzing the results of clustering.
The result of the algorithm is the labeling of all customers loyalty program, depending on their behavior / purchase. Clients with the same behavioral characteristics fall into one cluster.
If you spend clustering for the entire period of work, then all the clients of the loyalty program participate in it. If for a certain period (year, month), then only those customers who made purchases in a given period participate in clustering.
So, we carried out clustering according to the loyalty program for the retailer for half a year, with the number of clusters 75. Consider how the customers were distributed among the clusters, and which products they prefer in various clusters:
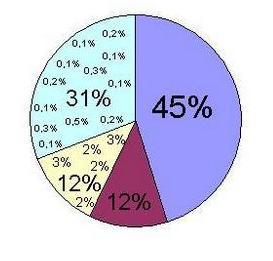
- 45% of clients got to “Cluster 1” during this period. The top sellers on goods here were: butter, bananas, eggs, milk, long loaf, sour cream.
- In “Cluster 2” there were 12% of clients. Here, several types of bread and sour cream, bananas and non-food items are more popular than the rest.
- Five subsequent clusters are not so big anymore, each of them includes only 2-3% of clients. (In total, 12% of clients fell into these clusters for the selected period). Here, customer preferences are very interesting, for example: dairy products + fruits, biscuits + yogurts \ cheese, yogurts \ desserts + cereals, chicken + beer + cat food.
- The remaining 31% of buyers are scattered over 68 clusters. which include 0.1-2% of customers. Also, the cluster can be very small and consist of 1-2 people. What can be interesting in such a cluster? Read in the cases at the end of the article.
When clustering, the algorithm detects non-standard client behavior . The analysis of individual “features” (characteristics and features) of each individual cluster will help to reveal this behavior.
6. Analyzing the characteristics of each cluster.
- The name of the cluster. You can simply number the clusters, or you can assign names to them, depending on the behavioral characteristics within each cluster - from “Housewives”, “Bachelors”, “Businessmen” to “Cat Lovers Club” :)
- The turnover of the cluster. Allows you to identify the clusters that bring the greatest income.
- Cluster share in turnover. As a percentage of the total turnover of clustering for the selected period.
- The number of clients in the cluster.
- The number of new customers in the cluster. (For the first time, they used the discount card for the selected clustering period).
- The number of men and women in the cluster as a percentage. Allows you to identify typical male and typical female purchases, in addition to the obvious.
- The total number of checks in the cluster.
- The number of checks per client in the cluster. Allows you to track how many times the client returned for the selected clustering period.
- The average amount of goods in the check.
- The average cost of the check. Allows you to determine in which cluster the most expensive goods are sold.
After analyzing the characteristics of each cluster and using them to determine the person of the buyer, you can proceed to the personalized distribution.
7. We carry out a personalized distribution for each cluster.
Using customer clustering, you can get a clear system of recommendations for the staff - which product, which customer, and at what time to offer.
Knowing what to offer to which group of people, companies will be able to avoid the “carpet bombing” method when using sms or e-mail distribution. By offering customers only the products they need (not forgetting related products), you can achieve a much greater response and conversion into a purchase.
Consider a few cases from Datawiz.io .
Improving the effectiveness of promotional mailings through clustering.
As a result of the clustering of customers of one of the chain stores, we received 75 clusters. For example, consider three of them: “young family”, “student” and “retired”.
- Clients of the “young family” cluster were most susceptible to proposals for the purchase of diapers, baby food, fruit and milk;
- “students” were offered discounts on fast food and beer products;
- and “pensioners” for cereals and vegetables.
As a result of this distribution, the conversion to purchase increased by 14.5%.
Promotion of a new product.
Option 1. To find out who will be interested in the new product, we have sent out a newsletter to all customers of the loyalty program. By the results of the response, we learned the person of the buyer, who needs to market a new product. Next, we tracked the buyers we needed in clusters. We have already sent out mailings only to the clusters of interest.
Option 2. The company did not want to conduct mailing to all customers, as the base is very extensive. Therefore, we have created a hypothesis of how this client cluster is interesting. Of all the clusters we are interested in, we took randomly 1% of clients and conducted a test mailing to them. With those clusters that showed the highest conversion in the purchase after the test distribution, and worked in the future, offering a new product to the entire cluster.
Non-standard customer behavior.
We carried out clustering for the store of one of the network. The algorithm issued a cluster in which there were only 2 clients. But attention was attracted by the amount of turnover in this cluster for a short period. It would seem, well, people buy a lot of different products and goods.
Another interesting detail was that many checks were made with a difference of a few minutes. When these clients were tracked in the loyalty program database, it turned out that the owners of the two discount cards were the store employees.
Question: Can employees thus inclined customers to purchase? or earn yourself a discount points? or sold the goods at full cost, and appropriated the difference, that is, cheated?
Instead of output.
Using clustering will allow companies to build personal relationships with customers and work with them in new ways. An individual approach to each client will increase customer loyalty, and will undoubtedly lead to increased profits.
Source: https://habr.com/ru/post/248863/
All Articles