Modern Business Intelligence (BI) systems by the example of IBM Cognos BI
In the modern world, there are certain classes of software that are focused mainly on the corporate segment (large and medium business) and, accordingly, are not widely used. But some software systems have quite interesting functions that can be used not only in the small business, but also as a personal tool. That's about one of these software systems and will be discussed in this article.
Note
I am a technical specialist, respectively, the article has a more technical bias. If you want to read information on the product, focused on the business of users, then you are on the offsite IBM.
The main goal of this article is to show you how to make your first “Hello World” (similar to programming) in IBM Cognos BI.
')
I also want to note that I have a lot of experience writing step-by-step instructions with screenshots of each step. But this article will not be another step-by-step instruction, here I want to show the concept of working with the system, and not to make another manual.
What is BI?
So, what is the BI system? In three words, this is an advanced reporting system. To make it clearer, below I will list the main functions that modern BI class systems have:
- ability to connect to various data sources (from Excel file to universal ODBC connection)
- the ability to construct both simple reports (such as a graph or a table), as well as complex parameterized reports with a combined structure and reference links (Drill-Trough, Drill-Up / Drill-Down)
- the ability to work transparently with different data sources (for example, Excel and SQL Server) with full processing of the links between them
- possibility of interactive work with data (on-the-fly reporting)
- the ability to present relational data as multidimensional
- the ability to distribute access rights using both internal sources of authentication and external (NTLM, LDAP, etc.)
- ability to start generating reports both manually and automatically according to the schedule
- the ability to automatically send the generated reports
- ability to build reports in various formats (Excel, HTML, PDF, etc.)
In simple Russian, the BI system is such a program that provides the user with convenient tools for analyzing virtually any data (be it an Excel file or an industrial data warehouse).
Ability to use the BI system as a personal tool
The question immediately becomes, how can this system be used as a personal tool? I will answer by personal example, I use IBM Cognos BI as a tool for analyzing statistics in my projects and a tool for analyzing home accounting statistics.
Here, of course, you can argue that something in the spirit of “I use traditional SQL queries to perfectly analyze statistics” or “Excel’s built-in functions are enough to analyze all the home bookkeeping,” but “everything is relative.” As practice shows, it is much easier to simply drag the desired data elements with the mouse and get the result in a ready-made form than fiddling with writing SQL queries or reconfiguring Excel functions.
Again, everything written is personally my opinion, with which you are not obliged to agree.
IBM Cognos BI Architecture
The system architecture is relatively simple (as for an enterprise-class system). So, the key element of the system is the IBM Cognos BI server (see diagram below), which works with data sources using a user-created description (called metadata). Further, through Web access, the IBM Cognos BI server provides access to all major system functions.
The conceptual architecture of the IBM Cognos BI complex (the scheme is very cumbersome)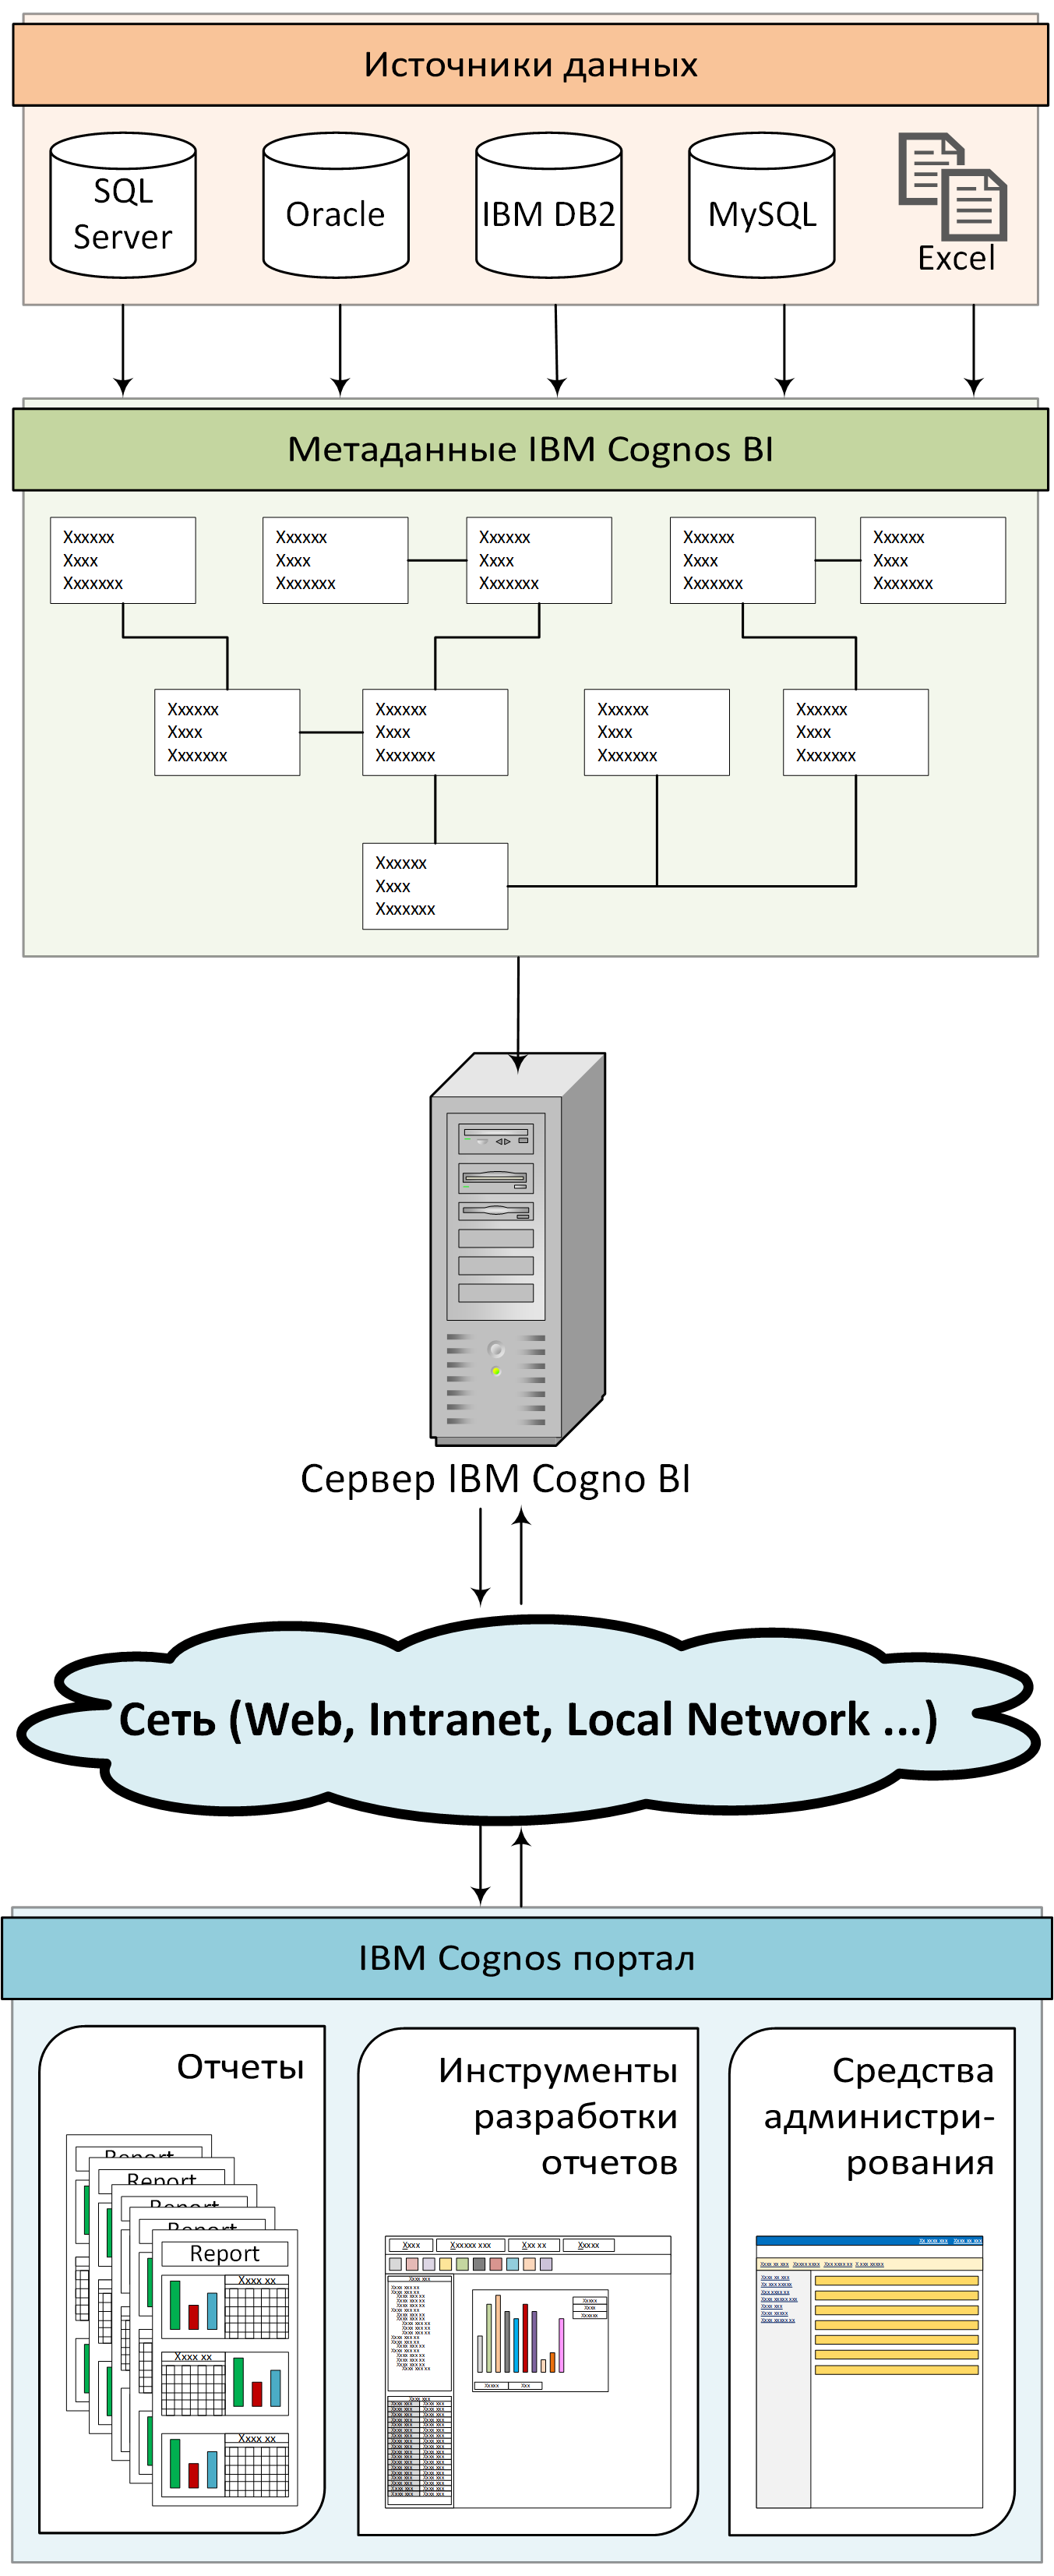
Stages of working with the system
To make your first report you need to perform several basic steps:
- Create connection to data source
- Generate data source description, i.e. create metadata
- Create and publish a metadata package on the IBM Cognos BI server
- Create a report
The structure of the test data source
Before proceeding with the implementation of the steps described above, I want to say a few words about the test data source. On the one hand, the structure of the test data source is relatively simple (as for industrial data storage), on the other hand, it is somewhat more complicated than a simple Excel sheet. All data in the source are synthetic (generated by algorithms based on random numbers), because of this, the aggregate indicators look very smooth.
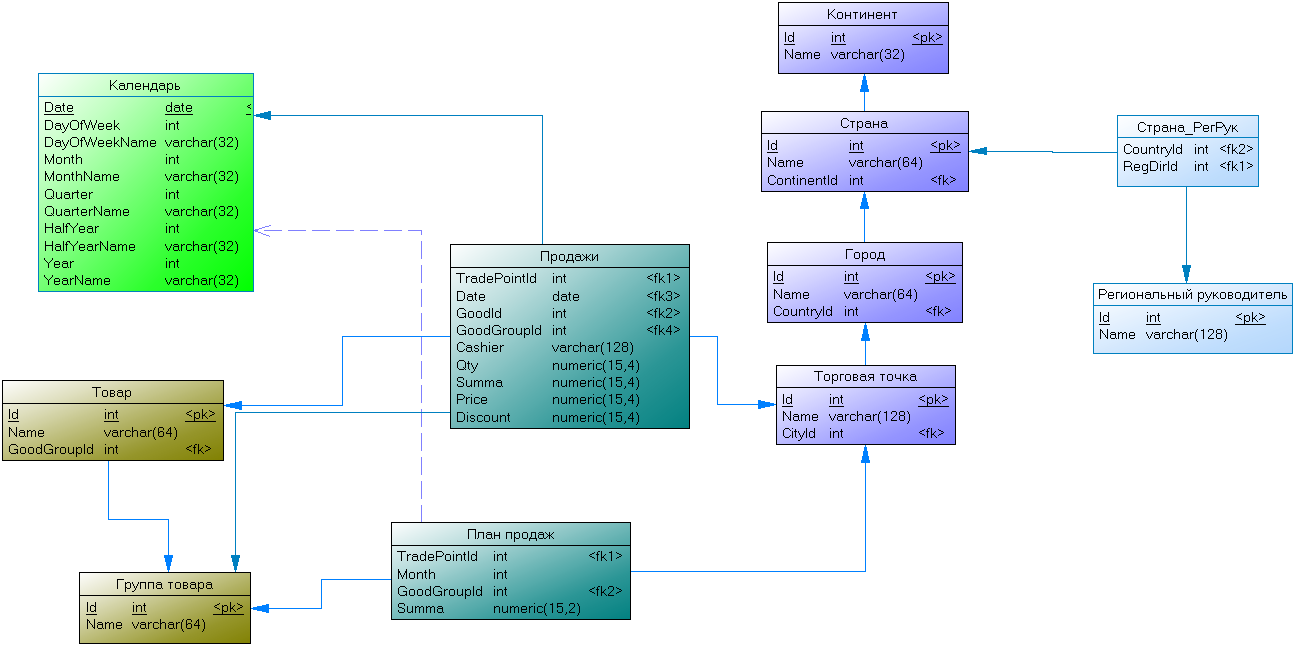
As can be seen in the diagram above, the test database contains 3 hierarchical measurements: “Product group -> Product”, “Continent -> Country -> City -> Point of sale”, “Year -> Half year -> Quarter -> Month -> Date"; 2 flat (one-dimensional) dimensions: "Cashier", "Regional Manager"; and 2 fact tables: Sales, Sales Plan.
Moreover, the “Cashier” dimension is located in one of the fact tables in a denormalized form, and the “Regional Manager” dimension is tied to the “Country” level of the “Point of sale” link with a “many to many” link (it is assumed that one manager can manage different countries).
Connect to data source
In IBM Cognos BI, all the necessary parameters for connecting to data sources are stored in special system objects, which are called “Data Source Connections”. To create a new connection, you need to perform several simple steps: go to the IBM Cognos BI portal, go to the “Administration” section, open the Configuration tab, select the Data Source Connections subsection ( Data Source Connections ”) and click on the“ New Data Source ”button in the toolbar. Next, a series of dialog boxes will appear in which you will need to specify several parameters, such as the connection name, connection type, server, login, password, etc.
Metadata Development
Development of metadata is one of the most difficult and crucial moments. The quality of the metadata depends on how the system works (the speed of generating reports, the correctness of the generated results, etc.) and the ease of developing reports. But despite the above, the complexity of developing metadata is directly proportional to the complexity of the data source. For example, to build a relational description of our test data source, simply launch the metadata construction wizard, click the Next button several times, and the metadata is ready.
So, as I wrote earlier, metadata is a description of the data source. In IBM Cognos BI. The foundation of the metadata are the objects “Query Subject” and the links between them. The “Query Subject” object is a synonym for “View” from relational DBMS. That is, the basis for the “Query Subject” is a query to the DBMS, which defines the structure of the source object, and the relationship between the “Query Subject” is a description of the logical interaction between these queries.
To create metadata in IBM Cognos BI, a separate IBM Cognos Framework Manager application is used (the only non-Web application in the IBM Cognos BI complex). After starting the Framework Manager, you will be prompted to create a new project (you will need to enter the project name and its location in the local file system).
It should be understood that the Framework Manager project (also referred to as the Framework Manager model) is a set of local files that the local program works with, and the metadata package is the result that resides on the IBM Cognos BI server (if you draw an analogy with programming, then the project is the source code, and the package is the compiled application). Multiple sets of packages can be created based on a single Framework Manager project.
After the Framework Manager project is created, it is best to start by launching the metadata import wizard (Action -> Run Metadata Wizard ...). The import wizard will offer to select an existing data source or create a new one and allow you to select the necessary objects for import. In the simplest case (for example, when the data source is an Excel file, which in 99.9% of cases contains data in a denormalized form) you will need to specify the correct type of use (attribute “Usage”) in the fields of the “Query Subject” object Framework Manager can complete and begin building and publishing a metadata package. In a more complex version (as in our test example), it will be necessary to check the correctness of the imported links between Query Subject objects, correct the incorrect ones and add the missing ones. In more professional versions, it is possible to create calculated fields, change the structure of the “Query Subject”, form a multidimensional representation, define security algorithms, etc.

Creating and publishing a metadata package
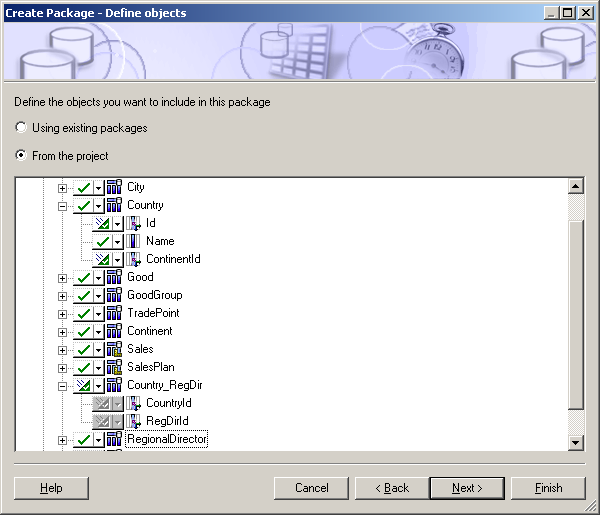
After the metadata is created, you need to create a meta package and publish it on the IBM Cognos BI server. As I mentioned earlier, metapacking is a subset of metadata that is published on the server and that all IBM Cognos BI Web applications work with. Meta-package settings allow you to hide or not publish some metadata objects. For example, in the test metadata there is some “Query Subject” [Country_RegDir] that affects the logic of processing the source data (it is a link between the country and the regional director), but does not represent value in the development of reports; package. Or, for example, fields with identifiers, it also makes sense to hide them from meta-package users.
To create a meta package, you need to be in Framework Manager, in the “Packages” section, call the context menu and select the item “Create -> Package”, after which the meta meta package creation wizard will appear. After the meta package has been created, the system will immediately offer to publish it on the server. A novice user can greatly ignore the options of the package publishing wizard (just click Next and Publish). The only thing is that on the last tab (where the Next button is not the Next button, but the Publish button) is the “Verify package before publish” bird, it determines whether the meta package is checked for logical ambiguities before publication and displays a list of these ambiguities, if found. I strongly recommend never to skip this step and correct all found ambiguities before publication.
Report generation (data analysis)
So we slowly and got to the most interesting and regular process - this is the creation of reports. It turned out that the tools for creating regular reports and tools for quick analysis of data in IBM Cognos BI are the same (although in some it is more convenient to perform a quick analysis, and in others it is more convenient to generate regular reports, they all allow you to save your results as reports).
Personally, I prefer to use the IBM Cognos Report Studio tool for all BI tasks. This is the most versatile tool that allows you to build reports of virtually any complexity and at the same time provides relatively convenient tools for quick data analysis.
Suppose that we need to create a quick report containing the fact of sales by country, product group and periodicity per quarter. This fairly simple report can be done by following these steps:
- launch the IBM Cognos Report Studio web application
- In the welcome window, click the "create" button
- in the list of basic templates select “cross table” (“corsstab”)
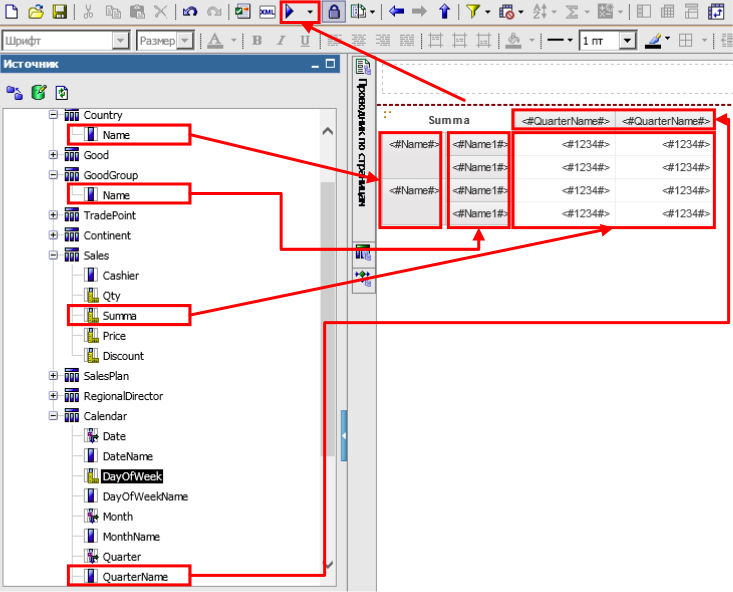
- place the data items as shown below
- run the report for execution
After launching the report for execution, you will get something like this.
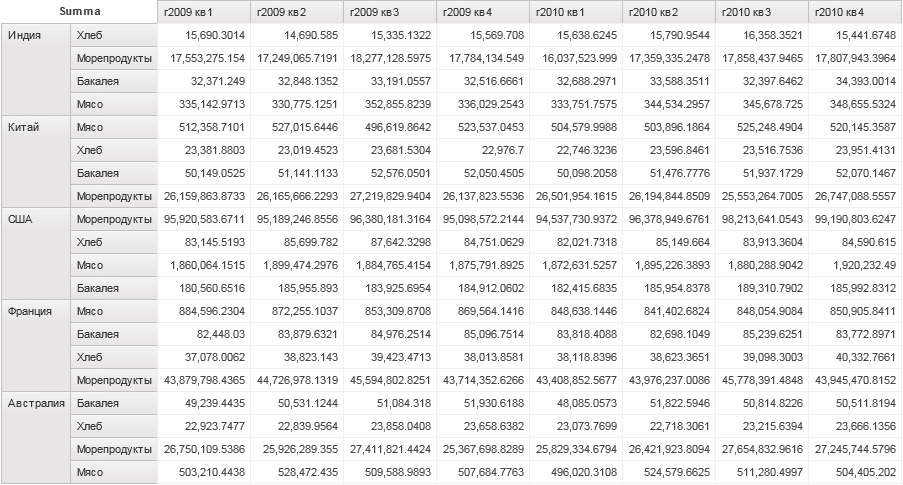
Looking at the resulting report, we can safely say that it is frankly badly designed, numbers are not formatted, the economic meaning is frankly doubtful, etc. But all these design flaws can be removed by setting the properties of the corresponding settings, and to make the economic sense more interesting For example, make a plan / fact analysis.
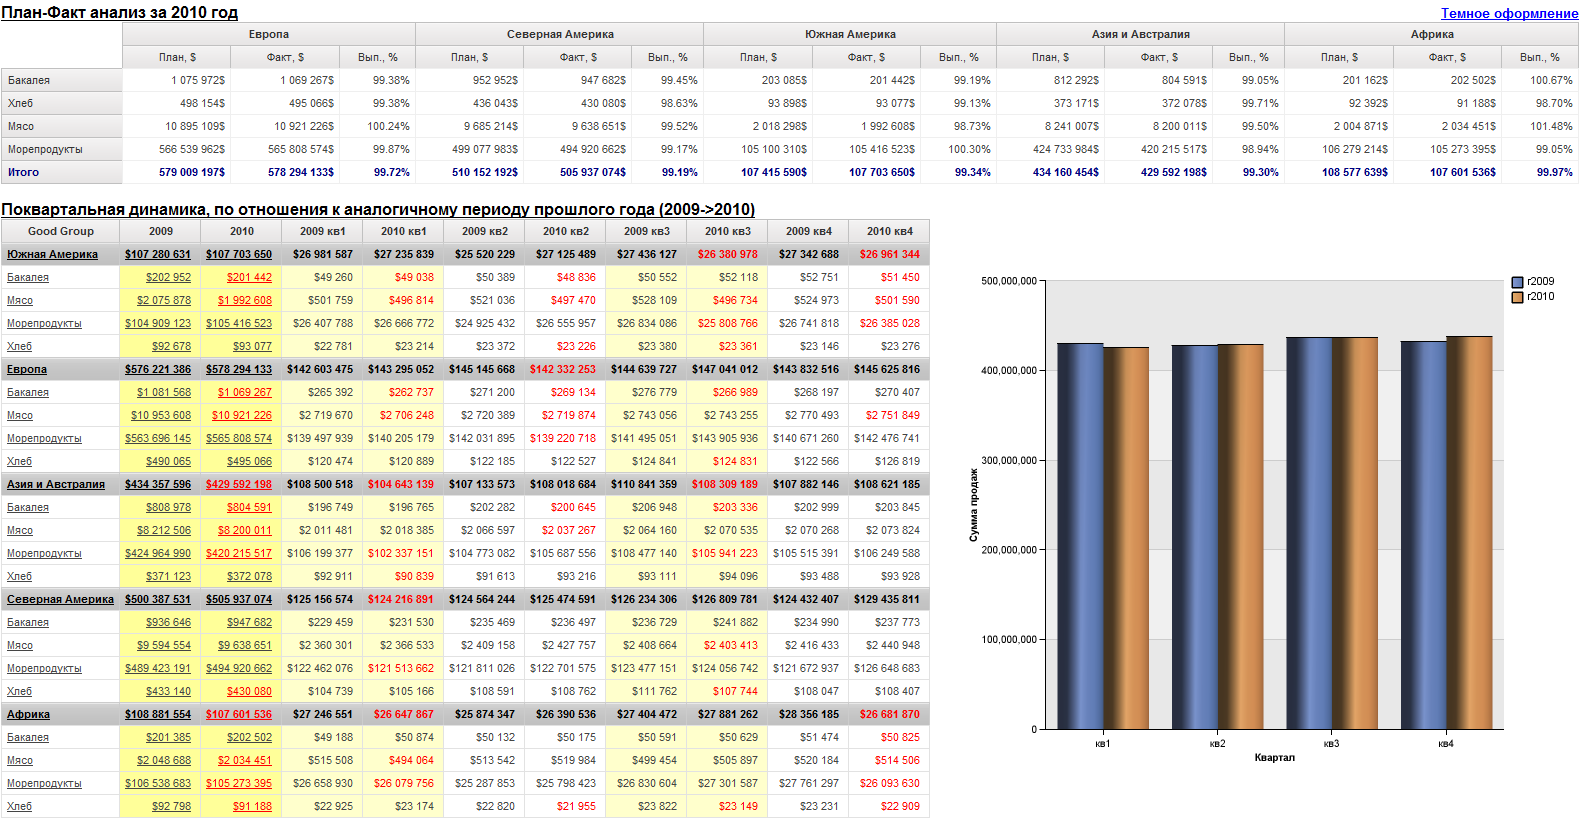
For example, to make the report shown below (on the finished metadata), as an expert with experience, I spent somewhere between 20-30 minutes.
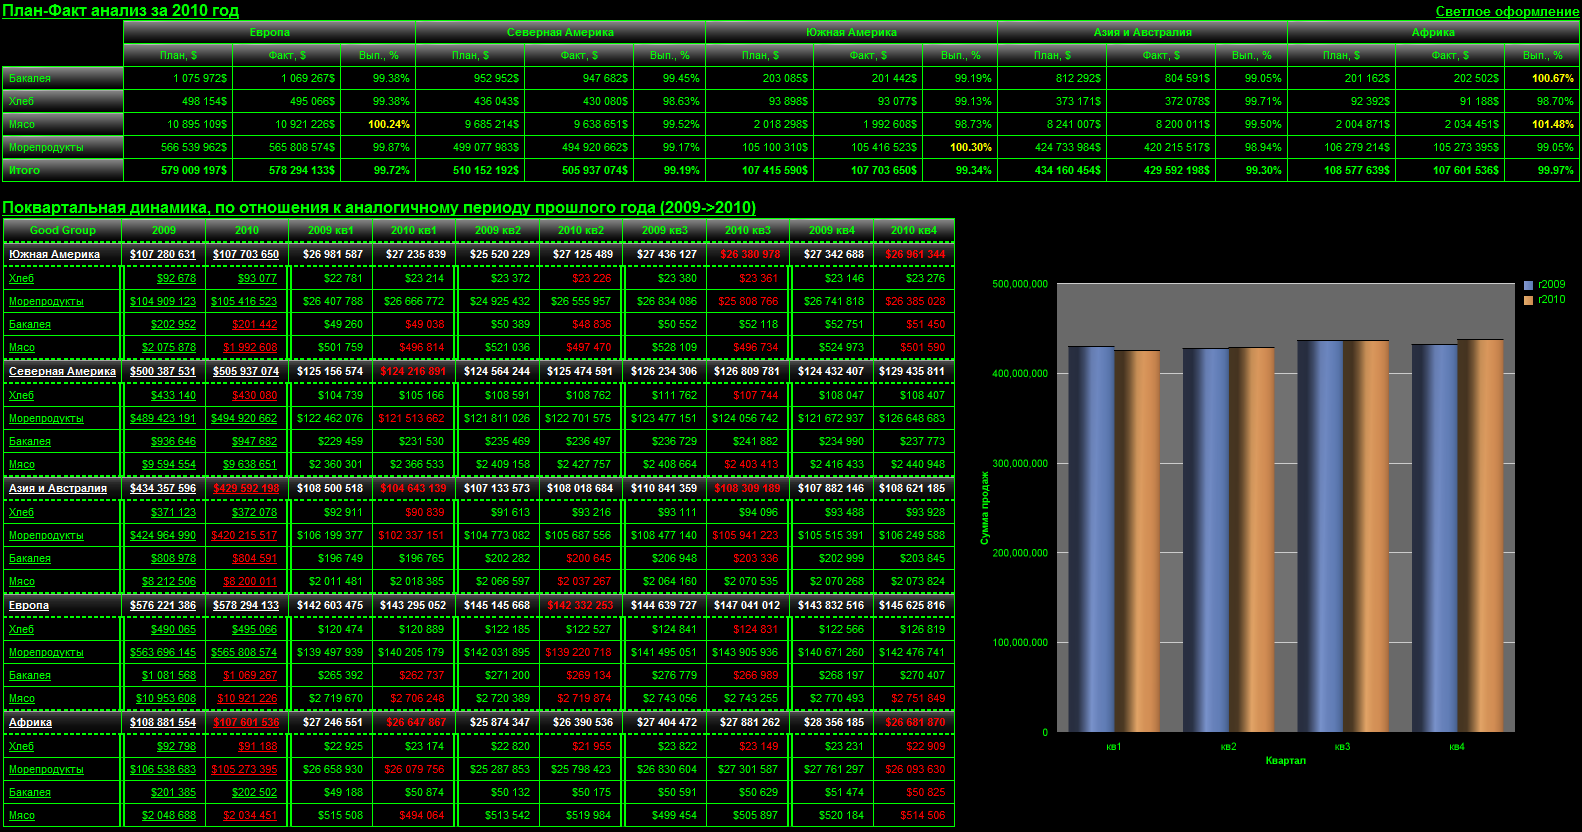
And in order to completely renew it into a dark color scheme, I spent somewhere else 10 minutes.
Conclusion
I hope that in this article the reader was able to get general information about BI systems and how they work. Of course, within a small article, it is impossible to consider in detail any of the aspects concerned (for example, how to correctly generate metadata, you can write a whole book), but I think that if you decide to try, then this article will tell you where to start and what result is expected.
I also didn’t touch on some interesting mechanisms and functions (for example, the mechanism of representing a relational data source as multidimensional), but this is because the amount of material needed (minimum theory and practice) draws on a separate article.
Little about licenses
If you decide to buy a separate IBM Cognos BI system for personal use or for a small company, then surely the prices will surprise you unpleasantly, but IBM has a special integrated IBM Cognos Express system, which is designed for small organizations and contains several products (including BI) and costs much less.
Source: https://habr.com/ru/post/248829/
All Articles