Gnuplot on homepage
What for?
 When developing an accessible online database for storing the results of calculations, there was an overwhelming desire to present information not only in tabular form, but also in the form of graphs. You can go in different ways, for example, to draw curves in PHP, but more correctly (in the sense of the UNIX-way) you will use an external program that already knows how to build graphs, such as Gnuplot .
Particularly intriguing is the possibility of displaying graphs in the form of a set of JS commands for drawing on an HTML5 canvas, which we will do.
About Gnuplot wrote a lot, including on Habré ( 1 , 2 ), so there is no need for a detailed description of its syntax.
To my surprise, I did not find a good tutorial on how to link the output of gnuplot with a dynamically configured page. Perhaps this is due to a lack of knowledge about Java Script and in fact, everything is obvious, but nevertheless, there is hope that this article will be useful.
')
Gnuplot HTML5 Canvas output
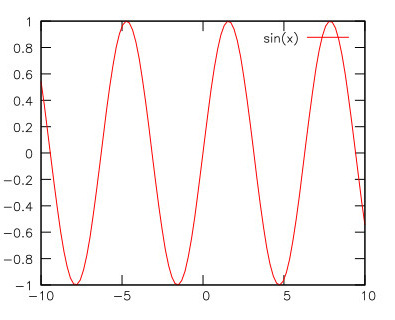
To get an idea of the capabilities of this mode, let's create a minimal script that draws a piece of a sinusoid in the output.html file:
#!/usr/bin/gnuplot set terminal canvas set output "output.html" plot sin(x) with lines Here, the first line specifies the command interpreter, the second - sets the output format to canvas. For particularly successful graphs, it would be possible to replace the canvas with pdf and immediately insert the result into an article for, say, Nature. The third line indicates the file name for the record, if it is not there, the stream will be sent to stdout, which we will use when generating the html page. The last line contains the actual command to build a sine graph.
Opening the generated file output.html, you can see the graph:
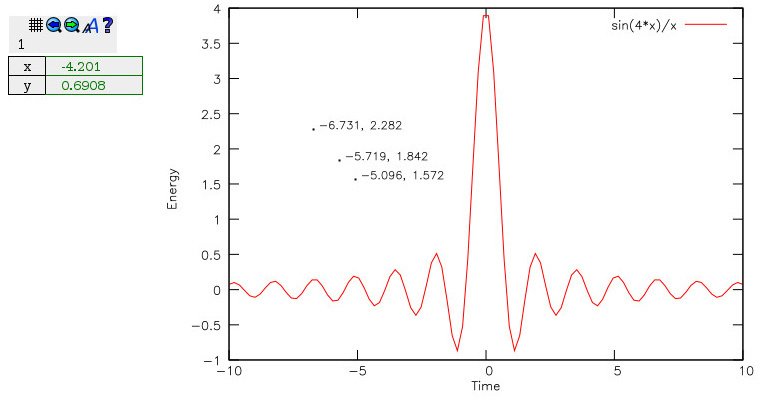
Well, but such a result could be obtained by inserting pictures obtained by the terminal png, but I would like interactivity! To do this, just specify the parameters of the terminal enhanced mousing :
set terminal canvas enhanced mousing set output "output.html" set xlabel 'Time' set ylabel 'Energy' plot sin(4*x)/x with lines linewidth 2 As a result, a panel will appear with control buttons, the ability to put points and zoom in on the area of interest:
Already more similar to the examples from the developers site , but from a remote computer will not work, since for supporting JS-scripts there is a call to the local file system, since the generated file contains lines like:
<script src="/usr/share/gnuplot/gnuplot/4.6/js/gnuplot_common.js"></script> That is, you need to place the files from /usr/share/gnuplot/gnuplot/4.6/js on your site by copying them or creating a link. To work, it is enough to have the files canvastext.js, gnuplot_common.js, gnuplot_mouse.js, gnuplot_mouse.css and png-icons. You must also specify the path to these files in the terminal parameters:
set terminal canvas enhanced mousing jsdir 'js' PHP and gnuplot interaction
So, there is a path to the calculation folder, you need to build a graph according to the selected items on the html-page.
We divide the task into several parts, as shown in the diagram:
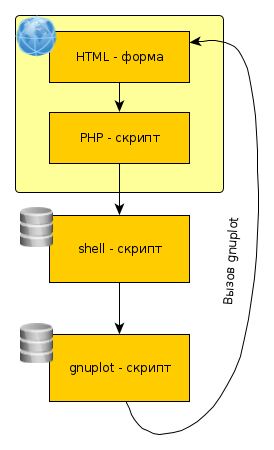
Such a scheme may be redundant, and all the functionality can be implemented in php, but this separation splits the code according to its functions and access rights:
- The shell script has access to the files on the disk and the launch of gnuplot, but should not be accessible from the outside,
- php and html - on the contrary, are accessible from the outside and should not have access to files outside the site,
- a separate .gp file allows you to repeat the construction of the graph, but in a more convenient for publication format by choosing pdf or png terminals.
PHP / HTML
The html form and the php script are combined into one plot_calc.php file:
<?php // : $path = $_GET['path']; // user-friendly , $fullpath = "/srv/calculations/".$path."/"; // $nSites = $_GET['nsites']; // - '' $fSite = 1; // '' if (isset($_POST["fSite"])) { $fSite = $_POST["fSite"]; } // echo '<a href=index.html>Back</a>'; echo '<h1>Plot Calculation Data</h1>'; echo '<form id="form_plots" method="post" action=plot_calc.php?path='.$path.'&nsites='.$nSites.'>'; echo ' <input id="plotProb" type="submit" name="plotProb" value="Prob" />'; echo ' <input id="plotEnergy" type="submit" name="plotEnergy" value="Energy" />'; // ... echo ' <label>Site number to plot</label>'; echo ' <input id="fSite" name="fSite" type="text" value='.$fSite.' />'; echo '</form>'; if (isset($_POST["plotProb"])) { // plotProb $input='./plot_calc.sh'.' '.'p '.$nSites.' '.$fullpath.' '.$fSite; echo "Probability plot for Site #".$fSite; } if (isset($_POST["plotEnergy"])) { // plotEnergy $input='./plot_calc.sh'.' '.'E '.$nSites.' '.$fullpath.' '.$fSite; echo "Energy plot for Site #".$fSite; } // ... $output = shell_exec($input); // echo $output; // echo '</body>'; echo '</html>'; ?> As noted in the comments, calling shell_exec in this form is a dangerous undertaking, so at least you should filter the data using the filter_input function.
SHELL
The plot_calc.sh script task is to form commands for gnuplot according to the specified external parameters. The script creates a file in the temporary directory / tmp, the contents of which is transferred to gnuplot, and the result of the execution is returned, where it is already waiting for a php script.
#!/bin/bash # : # 1 - # 2 - # 3 - # 4 - ( p) # -------------- # # E energy # p probaility # .... #------------------------------# # : TFILE="/tmp/$(basename $0).$$.gp" # gnuplot: echo "# Automatically generated Gnuplot script " > $TFILE echo "set terminal canvas enhanced mousing jsdir 'js'" >> $TFILE ### Probability ### if [ $1 == 'p' ] then echo "set xlabel 'Time'">>$TFILE echo "set ylabel 'Probability'">>$TFILE let icol=$4+1 echo "plot '$3prob.res' u 1:$icol wi li">>$TFILE fi # ... ### Energy ### if [ $1 == 'E' ] then let col=$4*2 let col1=$4*2+1 echo "set xlabel 'Time'">>$TFILE echo "set ylabel 'Energy'">>$TFILE echo "plot '$3Energ.res' u 1:$col:$col1 wi err">>$TFILE fi /usr/bin/gnuplot $TFILE This file will require execution rights:
chmod +x plot_calc.sh Gnuplot
The shell script generates an output file whose name contains the name of the calling script and a random number, the inside of it looks something like this:
# Automatically generated Gnuplot script set terminal canvas enhanced mousing jsdir 'js' set xlabel 'Time' set ylabel 'Probability' plot '/srv/calculations/GoodCalc/prob.res' u 1:6 wi li You can check the work by sending a browser to the address http: //servername/plot_calc.php? Path = GoodCalc & nsites = 10.
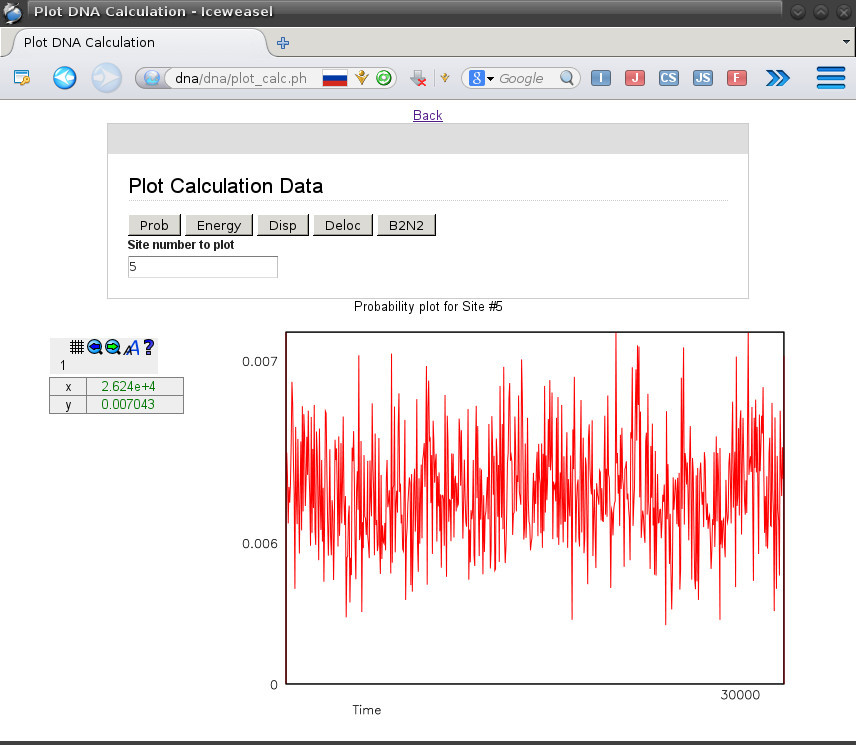
As a result, it will be possible to build graphs based on the data from the prob.res and Energy.res files, and you should get a page similar to:
Generated files in / tmp should be cleaned from time to time, for this the cron task (as root) will fit:
crontab -e 0 */1 * * * rm -v /tmp/plot*.gp >> /var/log/rmplotgp.log Conclusion
- Testing and demonstration were done on Debian Jessie, but should work on other systems;
- The gnuplot JS files must be accessible from the external network;
- It is possible to generate not only html-pages, but also js-scripts, managed by user code.
- Issues of load and safety are not considered here and will require additional attention ...
Source: https://habr.com/ru/post/248383/
All Articles