Having trouble analyzing user behavior? Meet a newbie guide on creating an effective conversion funnel

Probably, you have already read tons of articles on how to start setting up a metric on your site, measure its key performance indicators (KPI) and make informed decisions based on the data obtained. And, if you already apply this knowledge in practice, by starting to create your own metric and track events on the resource, you know perfectly well how difficult it is.
We spent a lot of time to put all the information together. In this article, we will try to explain to you how the measurement of performance indicators should be organized and what tools are best suited for this. You should not take the information below as a final guide to action, but we hope that this review will serve as an excellent additional tool to increase the conversion of your business.
')
The first thing to understand ...
We strictly observe the principle of "lean methodology": Construction-> Measurement-> Study-> Construction-> Measurement-> Study.
Thus, the company must be the person responsible for the metric.
As practice shows, such a concept as “analyzing the behavior of visitors based on events” can provoke a novice to study only those indicators that are in the growth stage. But the most competent strategy is the use of ALL of the data received from users, the construction of a conversion funnel and the modification of its product based on it.
Determining which aspects of the conversion funnel is most important for the success of a startup, and is the main task for every reputable company. Below is an example in which it is clearly visible that something in the service does not work as it should, and it is time to think about problems, and then work out effective ways to solve them.
The first thing to do before you start tracking and analytics is to determine which metric is most important for your organization. It’s not at all as difficult as designing and assembling a rocket: everyone with a certain zeal can become a competent analyst. What you are dealing with is two groups of data:
- Demographic : generalized information about users (name, geolocation, age, etc.)
- Events : what these users do on the target site (follow links, subscribe, comment, etc.)
Simply put, you have "users" and "events"
In this article, we are primarily interested in events. They include the entire history and the entire path of the user on the site: which pages he visited, where he clicked, how many invitations he sent, whether he left comments, etc. To some extent, Google Analytics (GA) can help with this, but our opinion is very limited. This is a great tool to understand where your visitor has come from; you can use it to build the highest point of the conversion funnel. Analyzing how many users visited my “landing page” (landing page), and then subscribed or left a post - these are certainly important points that directly affect the conversion. But, unfortunately, GA is not suitable for in-depth analysis of events and actions that the user performs on your site.
Without an event-based analysis, uncertainty is generated, which leads to conjecture-based actions. Guessing about what actually happens inside your product. But do users use the right functions, do they do it right, do they return to your site, do they do it regularly, do they invite new people, where do they go, what should be improved on the site?
We would recommend using GA to improve the strategy of “getting” users to your site, but such services as Mixpanel.com or Carrotquest.io are much better suited for tracking the “events” that these users make. .
What do we need to track?
There are reasons why people beat their heads against the wall when it comes to building a conversion funnel. The main difficulty is to answer the question “What should I keep track of?” We have prepared for you a number of simpler questions that will help you come to an understanding of what you should follow and what to analyze:
Step 1. What is the task of your site? What is the main purpose of your entire business?
Consider a few simple examples:
- For an online shoe store, the main goal is to sell shoes directly;
- For community sites like Airbnb - to attract as many people as possible who will book accommodation;
- For our Carrot Quest service, the challenge is to encourage people to communicate with their users, analyze their behavior and improve their product;
Step 2: What needs to be done to achieve these goals? What are the main KPIs that will show that your business is developed at a sufficient level? There is no need to invent hundreds of such indicators: it is better to limit to 1-2 characteristics. Let's try to show it in our examples:
- For an online shoe store, the main KPI is the number of shoes sold;
- For Airbnb, the number of places set up for rent and the number of places booked by guests;
- For Carrot Quest, this is the number of events monitored and messages sent (manually or automatically). And to a lesser extent, this is the number of user segments created.
Step 3. What leads the user to the actions indicated in the last paragraph?
Here it is a little more complicated: depending on the structure of your site, to lead the user from the event “Came to the landing page” to the final event (“Placed an order for goods”, “Booked accommodation”, “Created an automatic message”), which we designated as KPI, can many ways. The trick is to find such paths (remember that we consider such events as “pressed a button”, “visited a certain page”, “filled in a specific field”) so that ALL users can go from the “landing page” directly to key action. Sometimes this can mean the absence of such elements as search, transition through certain pages or other paths from the funnel, since it is possible for the user to move from Event # 1 immediately to the Final KPI event without performing such actions. This is what we are talking about in the example of Airbnb, where someone was looking for an apartment to rent:
- Path 1: visit the landing page> search by city> filter of search results by price> go to the page of a particular apartment> select the date> click on the button "Book"> Press the button "Make a payment"
- Path 2: visit the landing page> select the date> go to the specific apartment page> select “Similar place to rent”> press the button “Book”> Press the button “Make a payment”
In this case, only the events marked in color are common to the two paths. Tracking other events is not necessary. The example may not be the best, but the basic principle is easy to understand. But back to our three examples and create funnels for them:
- Shoe store conversion funnel: Visit page> Go to specific product page> Add to cart> Click “Order”> Click “Make payment”;
- Conversion funnel for Airbnb (landlord): Visit page> Click “Add housing to the list”> Click “Next”> Click “Confirm”;
- Conversion funnel for Airbnb (guest): Visit the page> Go to the specific housing page> Click "Book"> Click "Make a payment";
- Conversion funnel for Carrot Quest №1: I visited the landing page> Signed up> Put the code on the site> Created an event (started tracking an event);
- Conversion funnel for Carrot Quest №2: I visited the landing page> Signed up> Put the code on the site> Created an automatic message (any of 3 types);
- Conversion funnel for Carrot Quest №3: I visited the landing page> I registered> I put the code on the site> I created the event (I sent the message manually - to one user or segment);
- Conversion funnel for Carrot Quest №4: I visited the landing page> Signed up> Put the code on the site> Created a user segment;
These are just the most basic examples. There are quite a few other events that you may also have to track. Now, when we know what to track, we should eliminate errors in obtaining specific data.
How to read the necessary information?
Naturally, we do not want to check the same event a huge number of times. And we are not so much interested in the number of events (for example, today only 432 messages have been sent) - it is much more necessary to analyze who initiated these events (for example, Ivan sent 8 messages today, and Olga Vladimirovna - 53). Events are step by step related to each other by the same user ID - thanks to this, one can analyze the various steps of each site visitor. That is why one should clearly distinguish between the number of users and the actions they take.
But do not worry! Proper delineation does not require significant programming experience, but the person responsible for collecting information about user actions should be technically savvy (or, at least, he should not be afraid of confronting difficult tasks).
To learn how to set up events, read one of the past articles: Creating site funnels and measuring coffee conversion without a line of code .
In order for this data to be any good, you should delve a little into the analysis. Why only 10% of visitors view the registration page? Did the "right" people visit the main page? Is the CTA (call-to-action, call-to-action) organized attractively enough on the site? And finally, why only 1% of visitors make a purchase? Are we asking too much from them? Perhaps the registration form is too complicated? Start from the very beginning of the funnel and analyze the user's entire journey: from the first visit to the site to registration and purchase of your product.
Focus on the highest interruption rates. Try to understand why users leave your site and find a way to keep them. For a more accurate analysis of why users leave the landing page, Yandex Webvisor is suitable (although they will not show what happens after the user has registered and entered his personal account).
Great and terrible analytics setting
Most analytics tools today allow you to get started as quickly as possible and without significant pre-configuration. The best and most advanced tools have round-the-clock technical support via email, instant messengers or telephone. The lion's share of events is no more difficult to set up than adding a couple of lines of code to the site page. And sometimes it's just even easier to use the visual interface.
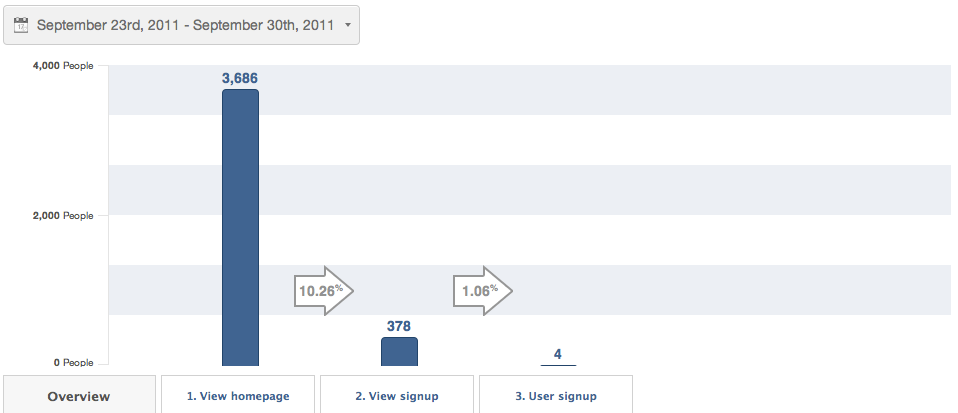
Now you need to make sure that the most important events are tracked correctly. Let's go back to our Carrot quest example. When you first encounter the Carrot quest, you need to register and install the code on the site. This is important for the service, because without the installed code no further work is possible.
The funnel in this case is as follows:
The example clearly shows that the main problems for users are created by Step 1 - Step 2. Thus, it is easy to identify where the zone of greatest interruption is in the funnel, and to begin to correct this problem.
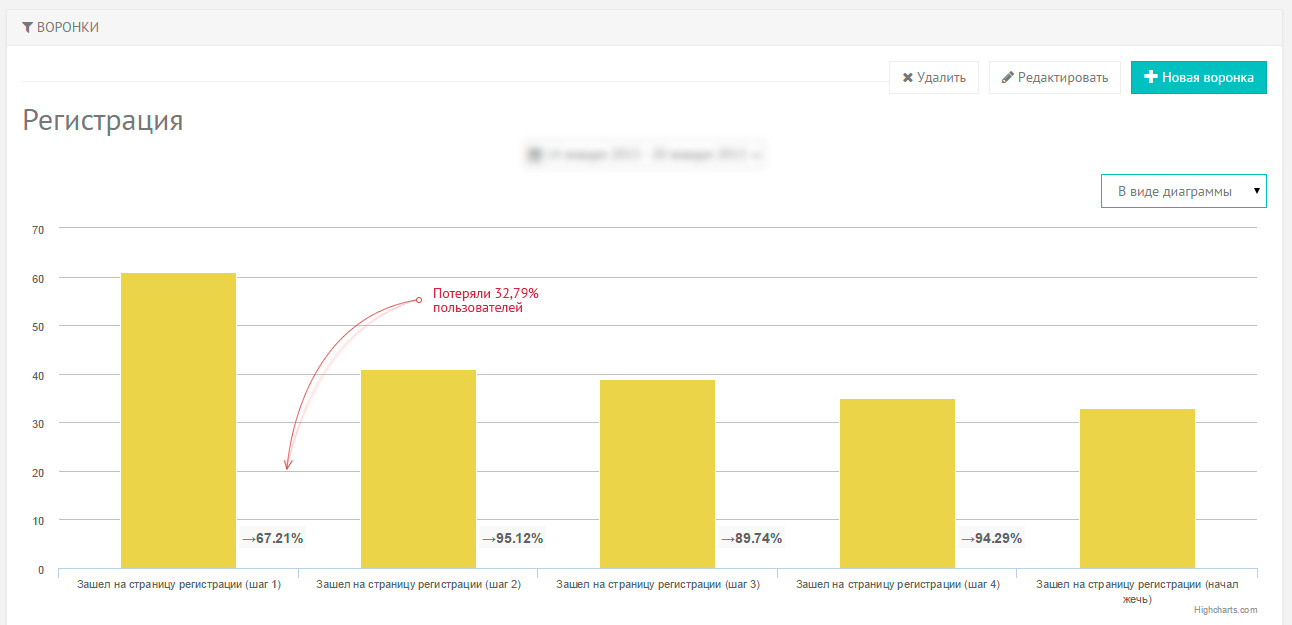
If you still think funnels are not that important ... think again
Even the smallest problem in your funnel can in the long run deprive you of a significant amount of income (if you achieve a positive business result at all). Take a look at the statistics presented just below - the average per 1,000 visitors.
Using such schemes will help you understand why an interruption occurs and make the cost of customer acquisition (CAC) much lower.
Maybe you're targeting the wrong people - check out demographic factors. Perhaps your CTAs are unclear, incorrect, or incorrectly located — they should be changed or moved, an AB test should be performed. It is worth remembering that the analyst shows only one side of the coin. With its help you can find out what is happening on the site. But the most important factor, in our opinion, is understanding why this happens. The analyst will not give you the answer to this question. The only way to understand WHY conversion is reduced is to ask your users. But this is a topic for another article ...
Steep you products.
Team service analysis and communication with users - Carrot Quest.
Source: https://habr.com/ru/post/248333/
All Articles