We write fast and economical JavaScript code
A JS engine like Google’s V8 (Chrome, Node) is designed to run large applications quickly. If during development you are concerned about efficient use of memory and speed, you need to know something about the processes running in the JS browser engine.
Whatever it is - V8, SpiderMonkey (Firefox), Carakan (Opera), Chakra (IE) or something else, knowing the internal processes will help you optimize the performance of your applications. But do not urge you to optimize the engine for a single browser or engine - do not do so.
Ask yourself a question:
- can something in my code be made more efficient?
- what optimization is performed by popular JS engines?
- that the engine cannot compensate, and can garbage collection clean up everything the way I expect from it?
')

There are many traps associated with efficient memory use and speed, and in this article we will explore some approaches that have shown themselves well in tests.
Although it is possible to develop large applications without a proper understanding of the JS engine, any car owner will tell you that he has ever looked under the hood of a car. Since I like the Chrome browser, I’ll tell you about its JavaScript engine. V8 consists of several main parts.
- The main compiler , which processes the JS and issues the machine code before its execution, instead of executing bytecode or simply interpreting it. This code is usually not very optimized.
- V8 converts objects into an object model . In JS, objects are implemented as associative arrays, but in V8 they are represented by hidden classes , which are an internal type system for optimized search.
- a runtime profiler that monitors system operation and defines “hot” functions (code that takes a long time to execute)
- an optimizing compiler that recompiles and optimizes hot code, and does other optimizations, such as inlining
- V8 supports deoptimization when the optimizing compiler rolls back if it detects that it has made some too optimistic assumptions when parsing the code
- garbage collection . The idea of its work is just as important as the idea of optimization.
This is one form of memory management. The collector tries to reclaim the memory occupied by objects that are no longer in use. In a language with garbage collection support, objects that still have links are not cleared.
Almost always you can not delete links to objects manually. Simply placing the variables where they are needed (ideally, the more local, the better - inside the functions that use them, and not in the external scope), you can achieve normal operation.

In JS, you can't force garbage collection to work. This does not need to be done, because this process is controlled at runtime, and he knows better when and what to clean.
In some disputes online about returning memory to JS, the delete keyword appears. Although initially it is intended to delete keys, some developers believe that it can be used to force the removal of links. Avoid using delete. In the example below, delete ox does more harm than good, because it changes the hidden class of o and makes it a slow object.
You will definitely find references to delete in many popular JS libraries, because it makes sense. The main thing that needs to be learned is that there is no need to change the structure of “hot” objects during program execution. JS engines can recognize such “hot” objects and try to optimize them. It will be easier to do if the structure of the object does not change much, and delete just leads to such changes.
There is also a lack of understanding about how null works. Setting an object reference to null does not reset an object. Writing ox = null is better than using delete, but it doesn't make sense.
If this link was the last object reference, then the garbage collector will clean it up. If this was not the last link, it can be reached, and the collector will not pick it up.
One more note: global variables are not cleaned up by the garbage collector while the page is running. No matter how long it is open, variables in the scope of the global object will exist.
Global variables are cleared when the page is reloaded, moving to another page, closing a bookmark, or exiting the browser. Variables from the scope of a function are cleared when the scope disappears — when the function exits and there are no more references to them.
In order for garbage collection to work as early as possible and to collect as many objects as possible, do not hold onto objects that you do not need. Usually this happens automatically, but this is what you need to remember:
- A good alternative to manually deleting links is to use variables with the correct scope. Instead of assigning a global variable to null, use a variable local to the function that disappears when the scope disappears. The code gets cleaner and less worries arise.
- Ensure that you remove event handlers when they are no longer needed, especially before removing the DOM elements to which they are attached.
- When using a local data cache, make sure that you have cleared it, or used an aging mechanism, so as not to store large unnecessary pieces of data.
Now let's turn to the functions. As we have already said, garbage collection frees the used memory blocks (objects), which cannot be reached. To illustrate - a few examples.
Upon returning from foo, the object pointed to by bar will be cleared by the garbage collector, since nothing is referenced to it.
Compare with:
Now we have a reference to an object that persists until the code that called the function assigns anything else to b (or until b goes out of scope).
When you meet a function that returns an internal function, then the internal one has access to the field of view outside of it, even after the end of the external function. This is the closure - an expression that can work with variables from the selected context. For example:
The garbage collector cannot tidy up the created functional object, since it still has access, for example, through sumA (n). Here is another example. Can we get access to largeStr?
var a = function () {
var largeStr = new Array (1000000) .join ('x');
return function () {
return largeStr;
};
} ();
Yes - through a (), so it, too, is not eliminated by the collector. How about this:
We no longer have access to it, so it can be cleaned up.
One of the worst places for leaks is a loop, or in a pair of setTimeout () / setInterval (), although this is a common problem. Consider an example:
If we do
to start the timer, every second “Time is up!” will be displayed. If we do:
the timer will continue to work anyway. myObj cannot be cleaned up since the closure passed to setTimeout continues to exist. In turn, it stores references to myObj via myRef. This is the same as if we passed the closure to any other function, leaving references to it.
It must be remembered that the links inside setTimeout / setInterval calls, such as functions, must be executed and terminated before they can be cleared.
It is important not to optimize the code prematurely. You can get carried away with micro tests that say that N is faster than M in V8, but the real contribution of these things to the finished module may be much less than you think.

Let's say we need a module that:
- reads from the local source data having numerical id;
- draws a plate with this data;
- adds event handlers for cell clicks.
Immediately there are questions. How to store data? How to effectively draw a label and insert it into the DOM? How to handle events in an optimal way?
The first and naive approach is to store each piece of data in an object that can be grouped into an array. You can use jQuery to crawl data and draw a table, and then add it to the DOM. Finally, you can use event binding to add click behavior.
Here's how you should NOT do it:
Cheap and angry.
However, in this example, we pass only by id, by numeric properties, which could be represented more simply as an array. In addition, direct use of DocumentFragment and native DOM methods is more optimal than using jQuery to create a table, and of course, processing events through the parent element will be much faster.
jQuery behind the scenes directly uses DocumentFragment, but in our example, the code calls append () in a loop, and each of the calls does not know about the others, so the code may not be optimized. Maybe it's not scary, but it's better to check it through tests.
Adding the following changes will speed up the script.
Let's look at other ways to improve performance. You could read somewhere that the prototype model is more optimal than the module model. Or, that frameworks for working with templates are highly optimized. Sometimes this is true, but mostly they are useful because the code becomes more readable. And still it is necessary to do precompilation. Let's check these statements:
It turns out that in this case the advantages in speed are negligible. These things are not used because of speed, but because of readability, inheritance model and maintainability.
More complex problems - drawing pictures on canvas and working with pixels. Always check what speed tests do before using them. It is possible that their checks and restrictions will be so artificial that they will not be useful to you in the world of real applications. All optimization is better to test in the complete code.
We will not give absolutely all the tips, but dwell on the most necessary.
- Some models interfere with optimization, for example a bunch of try-catch. Details on which functions can or cannot be optimized can be extracted from the d8 utility with the help of the command --trace-opt file.js
- try to keep your functions monomorphic, i.e. so that the variables (including properties, arrays, and function parameters) always contain only objects from the same hidden class. For example, do not do this:
- do not boot from non-initialized or deleted items
- do not write huge functions, since they are harder to optimize
- to store a heap of numbers or a list of similar objects, use an array
- if semantics requires an object with properties (of different types), use an object. This is quite effective in terms of memory, and quite quickly.
- on elements with integer indices, iteration will be faster than on object properties
- properties of objects - a complex thing, they can be created through setters, with different numbering and recording capabilities. Elements of arrays cannot be configured this way - they are either there or they are not. From the point of view of the engine, this helps optimize performance. Especially if the array contains numbers. For example, when working with vectors, use an array instead of an object with x, y, z properties.
There is one major difference between arrays and objects in JS - the length property. If you track this parameter yourself, then objects will be about as fast as arrays.
Create objects through the constructor. Then all objects will have one hidden class. Also, it is slightly faster than Object.create ().
There are no restrictions on the number of different types of objects and their complexity (within reasonable limits - long chains of prototypes are harmful, and objects with a small number of properties are represented by the engine somewhat differently and slightly faster than large ones). For “hot” objects, try to make short chains of inheritance and a small number of properties.
A common problem. Be careful about copying big things - it usually happens slowly. It is especially bad to use for this cycles for..in, which work slowly in any engines.
When you really need to quickly copy an object, use an array or a special function that directly copies each property. This will be the fastest:
This technique can improve performance. Those variants of the example below, which you probably met, are likely to work more slowly, because they create member functions all the time.
Here is a test for the performance of prototypes against modules:
If you do not need a class, do not create it. Here is an example of how you can improve performance by getting rid of the overlays associated with the classes jsperf.com/prototypal-performance/54 .
Do not remove items. If empty spaces are formed in the array, the V8 switches to the dictionary method of working with arrays, which makes the script even slower.
Useful because hint V8 about the types and number of elements in the array. Suitable for small and medium sized arrays.
Do not mix different types in the same array (var arr = [1, “1”, undefined, true, “true”])
Testing performance of mixed types
From the test you can see that the array of integers works the fastest.
In such arrays, access to the elements is slower - V8 does not take up memory for all elements if only a few are used. She works with him with the help of dictionaries, which saves memory, but affects speed.
Sparse Array Testing
Avoid leaky arrays resulting from the removal of elements, or assigning a [x] = foo, where x> a.length). If you delete only one element, the work with the array slows down.
Test of holey arrays
You should not pre-fill large arrays (more than 64K elements). Nitro (Safari) works better with pre-filled arrays. But other engines (V8, SpiderMonkey) work differently.
Prefilled Array Test
For web applications, speed is paramount. Users do not like to wait, so it is critical to try to squeeze all possible speed from the script. This is quite a difficult task, and here are our recommendations for its implementation:

- measure (find bottlenecks)
- understand (find what the problem is)
- forgive fix
The usual principle of measuring speed is to measure the execution time and compare. One comparison model was proposed by the jsPerf team and is used in SunSpider and Kraken :
The code is placed in a loop and executed several times, then the start time is subtracted from the end time.
But this is too simple an approach - especially for testing work in different browsers or environments. Even garbage collection can affect performance. This should be remembered even when using window.performance
For serious immersion in code testing, I recommend reading JavaScript Benchmarking.
Chrome Developer Tools support profiling. You can use it to find out which functions are being uploaded most of the time, and optimize them.
Profiling begins with determining the point of reference for the speed of your code — the Timeline is used for this. It indicates how long our code was executed. The “Profiles” tab shows in more detail what is happening in the application. The JavaScript CPU profile shows how much CPU time the code took, the CSS selector took how much time it took to process selectors, and Heap snapshots shows the memory usage.
Using these tools, you can isolate, tweak and repurpose code by measuring how program performance changes.
Good profiling instructions are here: JavaScript Profiling With The Chrome Developer Tools .
Ideally, the installed extensions and programs should not affect profiling, so run Chrome with the - user-data-dir <empty_directory> option.
Google Chrome Developer Tools are actively used in projects like Gmail to detect and fix leaks.
Some of the parameters that our teams pay attention to are private memory usage, JS heap size, number of DOM nodes, storage cleanup, event handler counter, garbage collection. Familiar with event-based architectures will be interested in the fact that we encountered the most frequent problems when listen () does not have unlisten () (closure) and when there is no dispose () for objects that create event handlers.
There is a wonderful presentation of the “ 3 pictures ” technique, which helps to find leaks through DevTools.
The idea is that you record several actions in your application, start garbage collection, check if the number of DOM nodes returns to the expected value, and then analyze three heap snapshots to determine if there are leaks.
In modern single-page applications, it is important to manage memory (AngularJS, Backbone, Ember frameworks) because they do not reboot. Therefore, memory leaks can quickly manifest themselves. This is a big trap for such applications, because memory is limited, and applications run for a long time (email clients, social networks). Big power is big responsibility.
In Backbone, make sure you get rid of the old views and references through dispose (). This function has been added recently, it removes all handlers added to the events object, and all handler collections when the view is passed as the third argument (in callbacks). dispose () is also called in the view remove () function, which solves most simple memory cleanup problems. In Ember, clear browsers when they discover that an item has been removed from view.
Advice from Derik Bailey ::
In this article, Derrick describes a lot of memory errors when working with Backbone.js, and also offers solutions to these problems.
Another good debugging tutorial on Node .
Such recalculations block the page for the user, so you need to figure out how to reduce the recalculation time. Methods that cause recalculation should be collected in one place and rarely used. You need to do as little as possible directly with the DOM. DocumentFragment – . DOM, , DOM.
, 20 div . div 20 .
DocumentFragment, div , DOM appendChild. .
– Make the Web Faster , JavaScript Memory Optimization Finding Memory Leaks .
To help with leak detection, a utility for Chrome Developer Tools was developed, working through a remote work protocol that takes heaps of images and finds out which objects are causing the leak.
I recommend to read the post on this topic or read the project page .
Optimization tracking:
More details:
trace-opt – ,
trace-deopt – ,
trace-gc –
(*), – (~).
V8 .
High resolution time ( High Resolution Time The , the HRT) - JS is an interface to access a timer with a resolution of less than a millisecond, which is independent of the user's time shifts. Useful for writing performance tests.
Available in Chrome (stable) as window.performance.webkitNow (), and in Chrome Canary without the prefix -window.performance.now (). Paul Irish wrote about this in detail in his post on HTML5Rocks .
If we need to measure the work of the application on the web, the Navigation Timing API will help us . With it, you can get accurate and detailed measurements performed when loading the page. Available through window.performance.timing, which can be used directly in the console:
From this data you can learn a lot of useful information. For example, the network delay responseEnd-fetchStart; the time it took to load the page after receiving from the server loadEventEnd-responseEnd; the time between loading the page and starting the loadEventEnd-navigationStart navigation.
For details, see Measuring Page Load with Speed Navigation Timing .
about: tracing in Chrome shows intimate details about the speed of the browser, recording all its activities in each of the threads, bookmarks and processes.
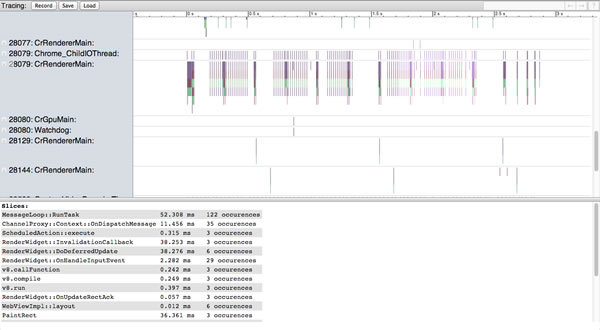
Here you can see all the details needed for profiling the script and correct the JS extension to optimize downloads.
Good article about using about: tracing for profiling WebGL games.
about: memory in Chrome is also a useful thing that shows how much memory each tab uses - this can be used to search for leaks.
In the amazing and mysterious world of JS engines there are a lot of pitfalls associated with speed. There is no universal recipe for improving performance. By combining various optimization techniques and testing applications in a real environment, you can see how to optimize your application. Understanding how engines process and optimize your code can help you tweak applications. Measure, understand, correct and repeat.
Do not forget about optimization, but do not micro-optimize at the expense of convenience. Think about what optimization is important for the application, and without what it can do.
Keep in mind that as the JS engines get faster, the next bottleneck is the DOM. Recalculation and redrawing should also be minimized - touch the DOM only if absolutely necessary. Do not forget about the network. HTTP requests also need to be minimized and cached, especially for mobile applications.
Whatever it is - V8, SpiderMonkey (Firefox), Carakan (Opera), Chakra (IE) or something else, knowing the internal processes will help you optimize the performance of your applications. But do not urge you to optimize the engine for a single browser or engine - do not do so.
Ask yourself a question:
- can something in my code be made more efficient?
- what optimization is performed by popular JS engines?
- that the engine cannot compensate, and can garbage collection clean up everything the way I expect from it?
')
There are many traps associated with efficient memory use and speed, and in this article we will explore some approaches that have shown themselves well in tests.
And how does JS work in V8?
Although it is possible to develop large applications without a proper understanding of the JS engine, any car owner will tell you that he has ever looked under the hood of a car. Since I like the Chrome browser, I’ll tell you about its JavaScript engine. V8 consists of several main parts.
- The main compiler , which processes the JS and issues the machine code before its execution, instead of executing bytecode or simply interpreting it. This code is usually not very optimized.
- V8 converts objects into an object model . In JS, objects are implemented as associative arrays, but in V8 they are represented by hidden classes , which are an internal type system for optimized search.
- a runtime profiler that monitors system operation and defines “hot” functions (code that takes a long time to execute)
- an optimizing compiler that recompiles and optimizes hot code, and does other optimizations, such as inlining
- V8 supports deoptimization when the optimizing compiler rolls back if it detects that it has made some too optimistic assumptions when parsing the code
- garbage collection . The idea of its work is just as important as the idea of optimization.
Garbage collection
This is one form of memory management. The collector tries to reclaim the memory occupied by objects that are no longer in use. In a language with garbage collection support, objects that still have links are not cleared.
Almost always you can not delete links to objects manually. Simply placing the variables where they are needed (ideally, the more local, the better - inside the functions that use them, and not in the external scope), you can achieve normal operation.
In JS, you can't force garbage collection to work. This does not need to be done, because this process is controlled at runtime, and he knows better when and what to clean.
Errors with deleting references to objects
In some disputes online about returning memory to JS, the delete keyword appears. Although initially it is intended to delete keys, some developers believe that it can be used to force the removal of links. Avoid using delete. In the example below, delete ox does more harm than good, because it changes the hidden class of o and makes it a slow object.
var o = { x: 1 }; delete ox; // true ox; // undefined You will definitely find references to delete in many popular JS libraries, because it makes sense. The main thing that needs to be learned is that there is no need to change the structure of “hot” objects during program execution. JS engines can recognize such “hot” objects and try to optimize them. It will be easier to do if the structure of the object does not change much, and delete just leads to such changes.
There is also a lack of understanding about how null works. Setting an object reference to null does not reset an object. Writing ox = null is better than using delete, but it doesn't make sense.
var o = { x: 1 }; o = null; o; // null ox // TypeError If this link was the last object reference, then the garbage collector will clean it up. If this was not the last link, it can be reached, and the collector will not pick it up.
One more note: global variables are not cleaned up by the garbage collector while the page is running. No matter how long it is open, variables in the scope of the global object will exist.
var myGlobalNamespace = {}; Global variables are cleared when the page is reloaded, moving to another page, closing a bookmark, or exiting the browser. Variables from the scope of a function are cleared when the scope disappears — when the function exits and there are no more references to them.
Simple rules
In order for garbage collection to work as early as possible and to collect as many objects as possible, do not hold onto objects that you do not need. Usually this happens automatically, but this is what you need to remember:
- A good alternative to manually deleting links is to use variables with the correct scope. Instead of assigning a global variable to null, use a variable local to the function that disappears when the scope disappears. The code gets cleaner and less worries arise.
- Ensure that you remove event handlers when they are no longer needed, especially before removing the DOM elements to which they are attached.
- When using a local data cache, make sure that you have cleared it, or used an aging mechanism, so as not to store large unnecessary pieces of data.
Functions
Now let's turn to the functions. As we have already said, garbage collection frees the used memory blocks (objects), which cannot be reached. To illustrate - a few examples.
function foo() { var bar = new LargeObject(); bar.someCall(); } Upon returning from foo, the object pointed to by bar will be cleared by the garbage collector, since nothing is referenced to it.
Compare with:
function foo() { var bar = new LargeObject(); bar.someCall(); return bar; } // - var b = foo(); Now we have a reference to an object that persists until the code that called the function assigns anything else to b (or until b goes out of scope).
Closures
When you meet a function that returns an internal function, then the internal one has access to the field of view outside of it, even after the end of the external function. This is the closure - an expression that can work with variables from the selected context. For example:
function sum (x) { function sumIt(y) { return x + y; }; return sumIt; } // var sumA = sum(4); var sumB = sumA(3); console.log(sumB); // 7 The garbage collector cannot tidy up the created functional object, since it still has access, for example, through sumA (n). Here is another example. Can we get access to largeStr?
var a = function () {
var largeStr = new Array (1000000) .join ('x');
return function () {
return largeStr;
};
} ();
Yes - through a (), so it, too, is not eliminated by the collector. How about this:
var a = function () { var smallStr = 'x'; var largeStr = new Array(1000000).join('x'); return function (n) { return smallStr; }; }(); We no longer have access to it, so it can be cleaned up.
Timers
One of the worst places for leaks is a loop, or in a pair of setTimeout () / setInterval (), although this is a common problem. Consider an example:
var myObj = { callMeMaybe: function () { var myRef = this; var val = setTimeout(function () { console.log(' !'); myRef.callMeMaybe(); }, 1000); } }; If we do
myObj.callMeMaybe(); to start the timer, every second “Time is up!” will be displayed. If we do:
myObj = null; the timer will continue to work anyway. myObj cannot be cleaned up since the closure passed to setTimeout continues to exist. In turn, it stores references to myObj via myRef. This is the same as if we passed the closure to any other function, leaving references to it.
It must be remembered that the links inside setTimeout / setInterval calls, such as functions, must be executed and terminated before they can be cleared.
Fear performance traps
It is important not to optimize the code prematurely. You can get carried away with micro tests that say that N is faster than M in V8, but the real contribution of these things to the finished module may be much less than you think.
Let's say we need a module that:
- reads from the local source data having numerical id;
- draws a plate with this data;
- adds event handlers for cell clicks.
Immediately there are questions. How to store data? How to effectively draw a label and insert it into the DOM? How to handle events in an optimal way?
The first and naive approach is to store each piece of data in an object that can be grouped into an array. You can use jQuery to crawl data and draw a table, and then add it to the DOM. Finally, you can use event binding to add click behavior.
Here's how you should NOT do it:
var moduleA = function () { return { data: dataArrayObject, init: function () { this.addTable(); this.addEvents(); }, addTable: function () { for (var i = 0; i < rows; i++) { $tr = $('<tr></tr>'); for (var j = 0; j < this.data.length; j++) { $tr.append('<td>' + this.data[j]['id'] + '</td>'); } $tr.appendTo($tbody); } }, addEvents: function () { $('table td').on('click', function () { $(this).toggleClass('active'); }); } }; }(); Cheap and angry.
However, in this example, we pass only by id, by numeric properties, which could be represented more simply as an array. In addition, direct use of DocumentFragment and native DOM methods is more optimal than using jQuery to create a table, and of course, processing events through the parent element will be much faster.
jQuery behind the scenes directly uses DocumentFragment, but in our example, the code calls append () in a loop, and each of the calls does not know about the others, so the code may not be optimized. Maybe it's not scary, but it's better to check it through tests.
Adding the following changes will speed up the script.
var moduleD = function () { return { data: dataArray, init: function () { this.addTable(); this.addEvents(); }, addTable: function () { var td, tr; var frag = document.createDocumentFragment(); var frag2 = document.createDocumentFragment(); for (var i = 0; i < rows; i++) { tr = document.createElement('tr'); for (var j = 0; j < this.data.length; j++) { td = document.createElement('td'); td.appendChild(document.createTextNode(this.data[j])); frag2.appendChild(td); } tr.appendChild(frag2); frag.appendChild(tr); } tbody.appendChild(frag); }, addEvents: function () { $('table').on('click', 'td', function () { $(this).toggleClass('active'); }); } }; }(); Let's look at other ways to improve performance. You could read somewhere that the prototype model is more optimal than the module model. Or, that frameworks for working with templates are highly optimized. Sometimes this is true, but mostly they are useful because the code becomes more readable. And still it is necessary to do precompilation. Let's check these statements:
moduleG = function () {}; moduleG.prototype.data = dataArray; moduleG.prototype.init = function () { this.addTable(); this.addEvents(); }; moduleG.prototype.addTable = function () { var template = _.template($('#template').text()); var html = template({'data' : this.data}); $tbody.append(html); }; moduleG.prototype.addEvents = function () { $('table').on('click', 'td', function () { $(this).toggleClass('active'); }); }; var modG = new moduleG(); It turns out that in this case the advantages in speed are negligible. These things are not used because of speed, but because of readability, inheritance model and maintainability.
More complex problems - drawing pictures on canvas and working with pixels. Always check what speed tests do before using them. It is possible that their checks and restrictions will be so artificial that they will not be useful to you in the world of real applications. All optimization is better to test in the complete code.
Optimization Tips for V8
We will not give absolutely all the tips, but dwell on the most necessary.
- Some models interfere with optimization, for example a bunch of try-catch. Details on which functions can or cannot be optimized can be extracted from the d8 utility with the help of the command --trace-opt file.js
- try to keep your functions monomorphic, i.e. so that the variables (including properties, arrays, and function parameters) always contain only objects from the same hidden class. For example, do not do this:
function add(x, y) { return x+y; } add(1, 2); add('a','b'); add(my_custom_object, undefined); - do not boot from non-initialized or deleted items
- do not write huge functions, since they are harder to optimize
Objects or arrays?
- to store a heap of numbers or a list of similar objects, use an array
- if semantics requires an object with properties (of different types), use an object. This is quite effective in terms of memory, and quite quickly.
- on elements with integer indices, iteration will be faster than on object properties
- properties of objects - a complex thing, they can be created through setters, with different numbering and recording capabilities. Elements of arrays cannot be configured this way - they are either there or they are not. From the point of view of the engine, this helps optimize performance. Especially if the array contains numbers. For example, when working with vectors, use an array instead of an object with x, y, z properties.
There is one major difference between arrays and objects in JS - the length property. If you track this parameter yourself, then objects will be about as fast as arrays.
Tips for using objects
Create objects through the constructor. Then all objects will have one hidden class. Also, it is slightly faster than Object.create ().
There are no restrictions on the number of different types of objects and their complexity (within reasonable limits - long chains of prototypes are harmful, and objects with a small number of properties are represented by the engine somewhat differently and slightly faster than large ones). For “hot” objects, try to make short chains of inheritance and a small number of properties.
Cloning objects
A common problem. Be careful about copying big things - it usually happens slowly. It is especially bad to use for this cycles for..in, which work slowly in any engines.
When you really need to quickly copy an object, use an array or a special function that directly copies each property. This will be the fastest:
function clone(original) { this.foo = original.foo; this.bar = original.bar; } var copy = new clone(original); Caching Functions in the Modular Model
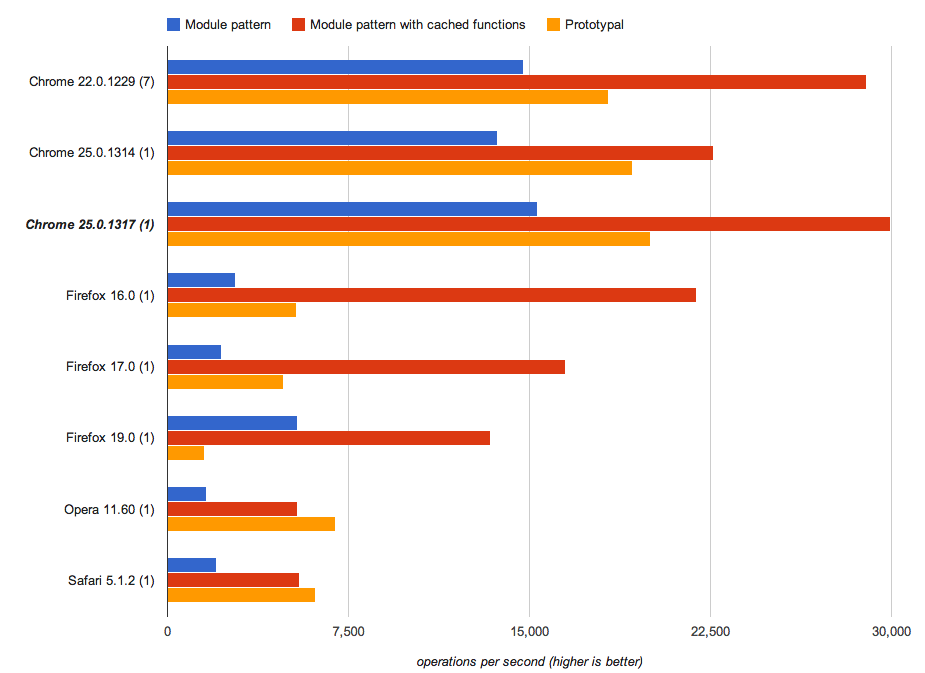
This technique can improve performance. Those variants of the example below, which you probably met, are likely to work more slowly, because they create member functions all the time.

Here is a test for the performance of prototypes against modules:
// Klass1 = function () {} Klass1.prototype.foo = function () { log('foo'); } Klass1.prototype.bar = function () { log('bar'); } // Klass2 = function () { var foo = function () { log('foo'); }, bar = function () { log('bar'); }; return { foo: foo, bar: bar } } // var FooFunction = function () { log('foo'); }; var BarFunction = function () { log('bar'); }; Klass3 = function () { return { foo: FooFunction, bar: BarFunction } } // // var i = 1000, objs = []; while (i--) { var o = new Klass1() objs.push(new Klass1()); o.bar; o.foo; } // var i = 1000, objs = []; while (i--) { var o = Klass2() objs.push(Klass2()); o.bar; o.foo; } // var i = 1000, objs = []; while (i--) { var o = Klass3() objs.push(Klass3()); o.bar; o.foo; } // If you do not need a class, do not create it. Here is an example of how you can improve performance by getting rid of the overlays associated with the classes jsperf.com/prototypal-performance/54 .
Array Tips
Do not remove items. If empty spaces are formed in the array, the V8 switches to the dictionary method of working with arrays, which makes the script even slower.
Array literals
Useful because hint V8 about the types and number of elements in the array. Suitable for small and medium sized arrays.
// V8 , 4 : var a = [1, 2, 3, 4]; // : a = []; // V8 - for(var i = 1; i <= 4; i++) { a.push(i); } Single or mixed types
Do not mix different types in the same array (var arr = [1, “1”, undefined, true, “true”])
Testing performance of mixed types
From the test you can see that the array of integers works the fastest.
Sparse arrays
In such arrays, access to the elements is slower - V8 does not take up memory for all elements if only a few are used. She works with him with the help of dictionaries, which saves memory, but affects speed.
Sparse Array Testing
Leaky Arrays
Avoid leaky arrays resulting from the removal of elements, or assigning a [x] = foo, where x> a.length). If you delete only one element, the work with the array slows down.
Test of holey arrays
Pre-filling arrays or filling on the fly
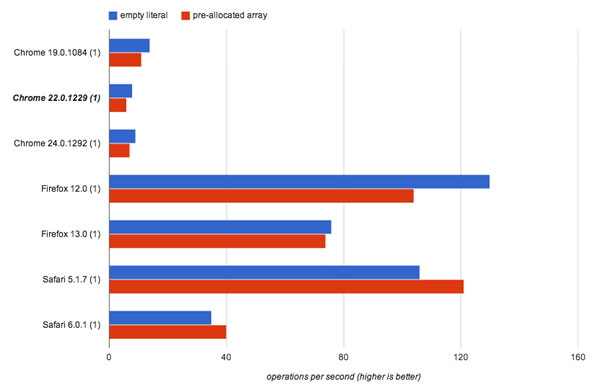
You should not pre-fill large arrays (more than 64K elements). Nitro (Safari) works better with pre-filled arrays. But other engines (V8, SpiderMonkey) work differently.

Prefilled Array Test
// var arr = []; for (var i = 0; i < 1000000; i++) { arr[i] = i; } // var arr = new Array(1000000); for (var i = 0; i < 1000000; i++) { arr[i] = i; } Application optimization
For web applications, speed is paramount. Users do not like to wait, so it is critical to try to squeeze all possible speed from the script. This is quite a difficult task, and here are our recommendations for its implementation:

- measure (find bottlenecks)
- understand (find what the problem is)
- forgive fix
Speed tests (benchmarks)
The usual principle of measuring speed is to measure the execution time and compare. One comparison model was proposed by the jsPerf team and is used in SunSpider and Kraken :
var totalTime, start = new Date, iterations = 1000; while (iterations--) { // } // totalTime → , // 1000 totalTime = new Date - start; The code is placed in a loop and executed several times, then the start time is subtracted from the end time.
But this is too simple an approach - especially for testing work in different browsers or environments. Even garbage collection can affect performance. This should be remembered even when using window.performance
For serious immersion in code testing, I recommend reading JavaScript Benchmarking.
Profiling
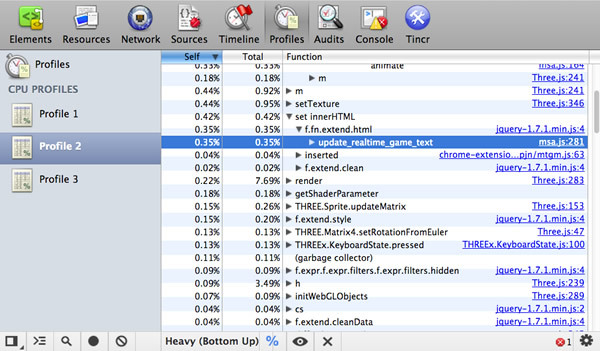
Chrome Developer Tools support profiling. You can use it to find out which functions are being uploaded most of the time, and optimize them.

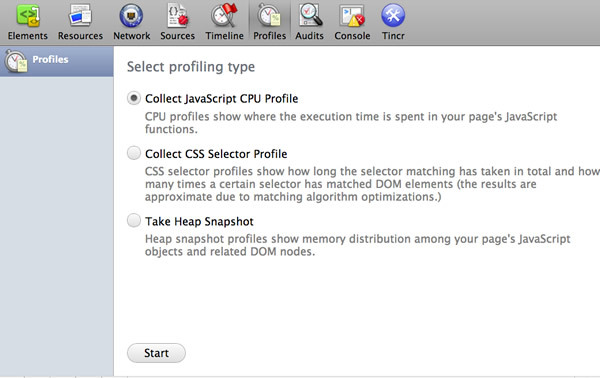
Profiling begins with determining the point of reference for the speed of your code — the Timeline is used for this. It indicates how long our code was executed. The “Profiles” tab shows in more detail what is happening in the application. The JavaScript CPU profile shows how much CPU time the code took, the CSS selector took how much time it took to process selectors, and Heap snapshots shows the memory usage.
Using these tools, you can isolate, tweak and repurpose code by measuring how program performance changes.

Good profiling instructions are here: JavaScript Profiling With The Chrome Developer Tools .
Ideally, the installed extensions and programs should not affect profiling, so run Chrome with the - user-data-dir <empty_directory> option.
Avoid memory leaks - a technique of three snapshots of memory
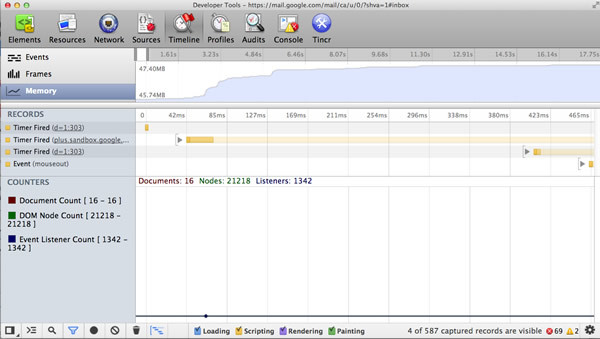
Google Chrome Developer Tools are actively used in projects like Gmail to detect and fix leaks.

Some of the parameters that our teams pay attention to are private memory usage, JS heap size, number of DOM nodes, storage cleanup, event handler counter, garbage collection. Familiar with event-based architectures will be interested in the fact that we encountered the most frequent problems when listen () does not have unlisten () (closure) and when there is no dispose () for objects that create event handlers.
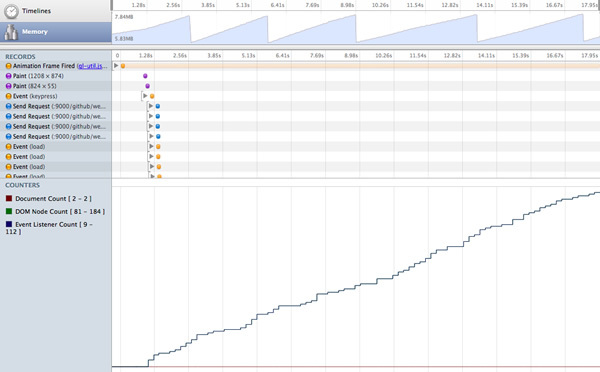
There is a wonderful presentation of the “ 3 pictures ” technique, which helps to find leaks through DevTools.
The idea is that you record several actions in your application, start garbage collection, check if the number of DOM nodes returns to the expected value, and then analyze three heap snapshots to determine if there are leaks.
Memory management in one-page applications
In modern single-page applications, it is important to manage memory (AngularJS, Backbone, Ember frameworks) because they do not reboot. Therefore, memory leaks can quickly manifest themselves. This is a big trap for such applications, because memory is limited, and applications run for a long time (email clients, social networks). Big power is big responsibility.
In Backbone, make sure you get rid of the old views and references through dispose (). This function has been added recently, it removes all handlers added to the events object, and all handler collections when the view is passed as the third argument (in callbacks). dispose () is also called in the view remove () function, which solves most simple memory cleanup problems. In Ember, clear browsers when they discover that an item has been removed from view.
Advice from Derik Bailey ::
Understand how, from the point of view of links, events work, and otherwise follow the standard rules for working with memory, and everything will be OK. If you upload data to the Backbone collection, in which there are many User objects, this collection must be cleaned up so that it does not use more memory, you need to remove all references to it and all objects separately. When you delete all the links, everything will be cleared.
In this article, Derrick describes a lot of memory errors when working with Backbone.js, and also offers solutions to these problems.
Another good debugging tutorial on Node .
Minimize the recalculation of the positions and sizes of elements when updating the page appearance
Such recalculations block the page for the user, so you need to figure out how to reduce the recalculation time. Methods that cause recalculation should be collected in one place and rarely used. You need to do as little as possible directly with the DOM. DocumentFragment – . DOM, , DOM.

, 20 div . div 20 .
function addDivs(element) { var div; for (var i = 0; i < 20; i ++) { div = document.createElement('div'); div.innerHTML = 'Heya!'; element.appendChild(div); } } DocumentFragment, div , DOM appendChild. .
function addDivs(element) { var div; // Creates a new empty DocumentFragment. var fragment = document.createDocumentFragment(); for (var i = 0; i < 20; i ++) { div = document.createElement('a'); div.innerHTML = 'Heya!'; fragment.appendChild(div); } element.appendChild(fragment); } – Make the Web Faster , JavaScript Memory Optimization Finding Memory Leaks .
JavaScript
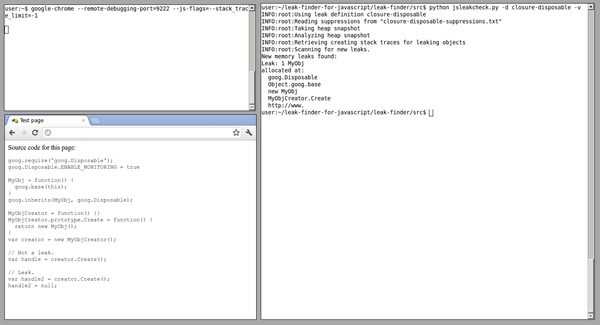
To help with leak detection, a utility for Chrome Developer Tools was developed, working through a remote work protocol that takes heaps of images and finds out which objects are causing the leak.

I recommend to read the post on this topic or read the project page .
V8 flags to optimize debugging and garbage collection
Optimization tracking:
chrome.exe --js-flags="--trace-opt --trace-deopt" More details:
trace-opt – ,
trace-deopt – ,
trace-gc –
(*), – (~).
V8 .
Navigation Timing API
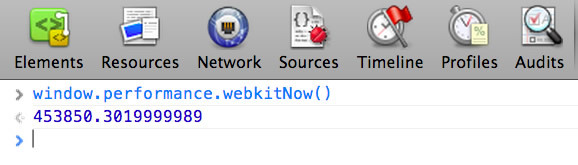
High resolution time ( High Resolution Time The , the HRT) - JS is an interface to access a timer with a resolution of less than a millisecond, which is independent of the user's time shifts. Useful for writing performance tests.
Available in Chrome (stable) as window.performance.webkitNow (), and in Chrome Canary without the prefix -window.performance.now (). Paul Irish wrote about this in detail in his post on HTML5Rocks .
If we need to measure the work of the application on the web, the Navigation Timing API will help us . With it, you can get accurate and detailed measurements performed when loading the page. Available through window.performance.timing, which can be used directly in the console:

From this data you can learn a lot of useful information. For example, the network delay responseEnd-fetchStart; the time it took to load the page after receiving from the server loadEventEnd-responseEnd; the time between loading the page and starting the loadEventEnd-navigationStart navigation.
For details, see Measuring Page Load with Speed Navigation Timing .
about: memory and about: tracing
about: tracing in Chrome shows intimate details about the speed of the browser, recording all its activities in each of the threads, bookmarks and processes.

Here you can see all the details needed for profiling the script and correct the JS extension to optimize downloads.
Good article about using about: tracing for profiling WebGL games.
about: memory in Chrome is also a useful thing that shows how much memory each tab uses - this can be used to search for leaks.
Conclusion
In the amazing and mysterious world of JS engines there are a lot of pitfalls associated with speed. There is no universal recipe for improving performance. By combining various optimization techniques and testing applications in a real environment, you can see how to optimize your application. Understanding how engines process and optimize your code can help you tweak applications. Measure, understand, correct and repeat.

Do not forget about optimization, but do not micro-optimize at the expense of convenience. Think about what optimization is important for the application, and without what it can do.
Keep in mind that as the JS engines get faster, the next bottleneck is the DOM. Recalculation and redrawing should also be minimized - touch the DOM only if absolutely necessary. Do not forget about the network. HTTP requests also need to be minimized and cached, especially for mobile applications.
Source: https://habr.com/ru/post/248111/
All Articles