Calculate the average temperature at the hospital
It is worth starting with the fact that this article is absolutely not serious. New Year, a holiday, there are no forces to do something serious both for writers and readers. That is why it was decided to write an article about, suddenly, statistics.
This article is indirectly related to one of the discussions in which we participated, regarding the possibility of some regularity in the occurrence of errors in certain places when copying code. We very often refer to the article “ Last line effect ” - according to observations, in the same type obtained by copying and pasting lines of code, the error is most often found in the last of them. The discussion concerned whether it was possible in some way to derive a certain regularity in the appearance of an error in other places of the same type of blocks. Unfortunately, the examples are structured in such a way that it is rather difficult to collect any statistics regarding the occurrence of such errors. However, it gave the idea to conduct a small statistical study on our database of examples.
Let's say right away that this article will be a comic character, since we could not find any serious patterns. Many people remember that " There are three types of lies: lies, blatant lies and statistics, " therefore, they are often suspicious of any statistical research. And rightly so, because the statistics, focused on the "crowd", is often used to look for patterns where there are none. One of the most prominent examples is the " Mars Effect ." But we are not so. We initially say that this statistical study does not pretend to be serious. Any statistical dependencies that will be described here are either fairly obvious in their own right, or have the nature of a “ false correlation ”, or do not exceed the statistical error due to the small sample size.
Well, let's get started? So far, Google collects statistics, which is not popular with people, we will collect statistics, which is not to the analyzer.
')
Assumption 1. Some words are more common
Come on? You must be joking?
Any person who is familiar with any programming language may say that some words or characters are found in the text of the program more often than others. Even in Brainfuck programming, the '+' character occurs more often than the '.' Character. The only "programming language" in which someone once really wrote and where one can argue with this fact is that programming is not even in assembler, but directly in machine codes. Connoisseurs in addition to this will surely name counterexamples from esoteric languages like Malbolge and so on. What about C ++? And so it is clear that the keyword int will occur in the source code on average more often than float, public - than protected and class - than struct or, moreover, union. But still. What are the most common words in parts of C ++ code containing an error? The calculation was done by elementary calculation of the number of words in all the examples; that is, if in one example the word if was encountered twice, then it was counted twice. Words in the comments were not considered. So, a list of the most common words (the number before the colon indicates the number of times how many words were encountered in all examples):
- 1323: if
- 798: int
- 699: void
- 686: i
- 658: const
- 620: return
- 465: char
- 374: static
- 317: else
- 292: sizeof
- 258: bool
- 257: NULL
- 239: s
- 223: for
- 194: unsigned
- 187: n
- 150: struct
- 146: define
- 137: x
- 133: std
- 121: c
- 121: new
- 115: typedef
- 113: j
- 107: d
- 105: a
- 102: buf
- 102: case
"Output": 'if' begets errors.
The following words give hope; rather, their number in comparison with if and even case:
- 15: goto
- 13: static_cast
- 6: reinterpret_cast
It seems that not everything is so bad with the structure of Open Source applications.
But the word auto was not noticed almost anywhere (less than five inclusions), as well as constexpr, and unique_ptr, and so on. On the one hand, this is logical, since the base of examples started typing examples a long time ago, when the implementation of the C ++ 11 standard was not even thought of. On the other hand, there is another subtext in this: language extensions are introduced primarily to simplify it and reduce the likelihood of new errors. We remind you that only examples with errors found by the PVS-Studio analyzer fall into our database.
Similar statistics were collected on numbers.
- 1304: 0
- 653: 1
- 211: 2
- 120: 4
- 108: 3
- 70: 8
- 43: 5
- 39: 16
- 36: 64
- 29: 6
- 28: 256
It is curious that the number 4 in the examples of the erroneous code is more common than the number 3, and this is not associated with 64-bit diagnostics - in the examples, if there are, then in a very small number (no more than one or two copies of the code). The vast majority of examples (at least 99%) were collected on general-purpose diagnostics.
Most likely, the appearance of the four above the three, albeit with a small margin, is due to the fact that four is a “round” number, and three is a “non-round”, if you know what I mean. For the same reason, it seems, the numbers 8, 16, 64 and 256 go to a significant gap. Here is such a strange distribution.
And then - on the wit and knowledge. What do you think, where did these numbers come from, 4996 and 2047?
- 6: 4996
- 5: 2047
The answer is at the end of the next section.
Assumption 2. The most common letter in the code - the letter 'e'
According to statistics , in literary English the letter 'e' occurs most often. The ten most common letters in English are e, t, a, o, i, n, s, h, r, d. And what is the probability to meet one or another symbol in the texts of source code in C ++? Let's put such an experiment. The approach to the experiment this time is even more brutal and heartless than the previous one. We just go through all the examples and just count the number of all characters. The register was not taken into account, that is, 'K' = 'k'. So, the results:
- 82100:
- 28603: e
- 24938: t
- 19256: i
- 18088: r
- 17606: s
- 16700: a
- 16466:
- 16343: n
- 14923: o
- 12438: c
- 11527: l
The most common character is a space. In literary English, the space character is a little ahead of the letter e, but in our case this is far from the case. The space is very widely used for code alignment, which provides it with a leading position by a wide margin, at least in our examples, because for convenience of formatting, we replace tabs with spaces. As for the rest of the characters - the characters i (the leader in the market of names for counters since 19XX) came out very strongly, r (according to our assumptions - there are several frequently used names such as run, rand, vector, read, write and especially - error) and s (std :: string s). However, due to a sufficiently large statistical sample, we can assert that the letters e and t are also the most frequent in the source code of the program, as in the texts in English.
About the point. Of course, the point is not as common in real programs as can be judged from the list above. The fact is that in our examples the four points very often drop the redundant code that is not required to understand the error. Therefore, in fact, the point is hardly included in the set of the most frequent characters of the C ++ language.
What did anyone say about entropy coding ?
And if you look from another angle. Which symbol is most rare in the examples?
- 90:?
- 70: ~
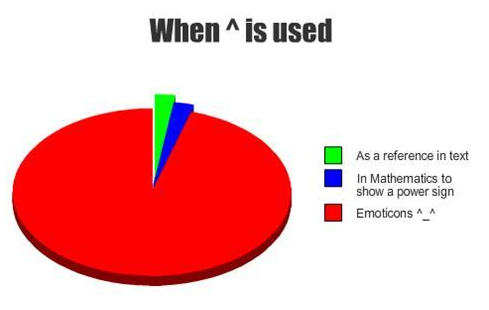
- 24: ^
- 9: @
- 1: $
Another very strange result that impressed us. Look at the number of these characters. It practically coincides (and in some places even coincides to the last sign!). Mysticism, and only. How could this happen?
- 8167: (
- 8157 :)
- 3064: {
- 2897:}
- 1457: [
- 1457:]
Oh, yes, the promised answer to the question from the previous section. 2047 = 2048 - 1, and the number 4996 was typed because of the lines in the style
#pragma warning (disable:4996) Assumption 3. There is a relationship between the occurrences of certain words.
This is a bit like a correlation analysis. The task was put like this: is there a relationship between the appearance of some two words in the examples?
Why only "reminds". We decided to calculate a relative value that is more similar to a linear correlation coefficient, but is not one, since it varies from 0 to 1 for convenience and measured for each pair of words (a, b) as follows: if the word a was found in Na examples, the word b - in Nb examples, and at the same time they met in Nab examples, then the coefficient Rab = Nab / Na, and Rba = Nab / Nb. Since it is known that 0 <= Nab <= Na, Nb; Na, Nb> 0 can obviously be deduced that 0 <= Rab, Rba <= 1.
How it works. Suppose that the word void occurs in 500 examples, the word int - in 2000, and the words void and int at the same time - in 100. Then the coefficient Rvoid, int = 100/500 = 20%, and the coefficient Rint, void = 100/2000 = 5 % Yes, the coefficient turned out to be asymmetric (Rab is not generally equal to Rba), but this can hardly be considered a hindrance.
Probably, we can talk about at least some statistical dependence, when R> = 50%. Why exactly 50%? Yes, simply because it wanted. In fact, the threshold values are chosen fairly closely, there are usually no recommendations here. The value of 95%, in theory, should indicate a strong dependence. In theory.

So, using the correlation analysis, we managed to find out the following surprising, unorthodox facts:
- In the examples where the else keyword is used, in the overwhelming majority of cases (95.00%) the if! Keyword is also used. (I wonder where the remaining 5% have gone?)
- In the examples where the public keyword is used, in the overwhelming majority of cases (95.12%) the keyword class is also used!
- In the examples where the keyword typename is used, in the overwhelming majority of cases (90.91%) the template keyword is also used!
And so on and so forth. Here are some "obvious" blocks below.
- 100.00% (18 of 18): argc -> argv
- 100.00% (18 of 18): argc -> int
- 94.44% (17 of 18): argc -> char
- 90.00% (18 of 20): argv -> argc
- 90.00% (18 of 20): argv -> char
- 90.00% (18 of 20): argv -> int
- 75.00% (12 of 16): main -> argv
- 60.00% (12 of 20): argv -> main
At least, this example shows that the program at least works, even if it makes senseless operations to identify all dependencies between main, argc and argv.
- 100.00% (11 out of 11): disable -> pragma
- 100.00% (11 of 11): disable -> default
- 100.00% (11 out of 11): disable -> warning
- 91.67% (11 of 12): warning -> pragma
- 91.67% (11 of 12): warning -> default
- 91.67% (11 of 12): warning -> disable
- 78.57% (11 of 14): pragma -> warning
- 78.57% (11 of 14): pragma -> disable
- 78.57% (11 of 14): pragma -> default
- 57.89% (11 of 19): default -> warning
- 57.89% (11 of 19): default -> disable
- 57.89% (11 of 19): default -> pragma
Madness of directives to the compiler. The analysis revealed all the dependencies between the words disable, pragma, warning and default. Apparently, all these examples were downloaded from the V665 diagnostic database - especially note that there are only eleven examples. By the way, these dependencies may seem completely obscure to those unfamiliar with the C ++ language, but for the programmer they may seem obvious.
And we continue.
- 100.00% (24 of 24): WPARAM -> LPARAM
- 92.31% (24 of 26): LPARAM -> WPARAM
- 91.30% (21 of 23): wParam -> WPARAM
- 91.30% (21 of 23): lParam -> LPARAM
- 91.30% (21 of 23): wParam -> LPARAM
- 87.50% (21 of 24): WPARAM -> wParam
- 86.96% (20 of 23): wParam -> lParam
- 86.96% (20 of 23): lParam -> wParam
- 86.96% (20 of 23): lParam -> WPARAM
- 83.33% (20 of 24): WPARAM -> lParam
- 80.77% (21 of 26): LPARAM -> wParam
- 80.77% (21 out of 26): LPARAM -> lParam
This, I think, does not need comments at all. A fairly strong relationship between the types of WPARAM, LPARAM, as well as their standard names lParam and wParam. These words, by the way, are drawn from 16-bit versions of Windows, and, it seems, even from Windows 3.11, which clearly shows us how much work Microsoft is doing in order to be compatible from year to year.
There were, however, more interesting results.
- 100.00% (12 of 12): continue -> if
- 100.00% (13 of 13): goto -> if
- 68.25% (43 out of 63): break -> if
The first two examples say that, most likely, in the examples there is no unconditional continue and goto. The third, in principle, shows nothing, since break can be used not only in the loop, but also in the switch statement, which itself replaces the “garland” from the if statements. Or not? Does the presence of an if statement in the example indicate that break / continue / goto is conditional? Did someone say something about diagnosing the V612 ? In my defense, I can say, however, that in the examples there is not one that is not unconditional continue and goto, but continue and goto in general! But with the break the situation is much more sad.
- 85.00% (17 out of 20): vector -> std
Still, the authors of the real code try to avoid constructing "using namespace std;" in the header files, which definitely has favorable consequences for readers, even if it is not quite convenient for programmers (well, five extra characters to type!).
- 94.87% (74 out of 78): memset -> 0
- 82.05% (64 of 78): memset -> sizeof
Most often, memory is filled with zeros, at least in our examples. Yes, most likely, the V597 diagnostics greatly influenced this statistic. And also V575 , V512 and so on. By the way, memory is filled with zeros more often than sizeof is used, which is at least strange and justified only if an array of bytes of a known size is filled. Well, or if an error was made, for example, V512 , when the third argument of memset simply forgotten sizeof.
- 76.80% (139 out of 181): for -> 0
In most cases, for loops start from zero. No, this is not a phrase in contrast to the language of Pascal or there, for example, Mathematica. Of course, that many cycles are counting from scratch. It is precisely because of this, probably, that a foreach loop was introduced in C ++ 11, which quite tolerably "deals" not only with classes with redefined begin (), end (), etc., but also with regular arrays ( but not with pointers to arrays). In addition, it is much more difficult to make a mistake in the foreach loop than in the for loop.
So it goes. By the way, this analysis took on our eight-core machine one hour and seven minutes in a release build.
Assumption 4. There are dangerous names of functions that are more often mistaken.
Actually, the title of the paragraph should speak for itself. There is a suspicion that in some functions they are mistaken more often. This suspicion was almost immediately broken about the harsh reality - the functions are called well, very differently, and in several projects the same function can be called ReadData (), readData (), read_data (), ReAdDaTa () and so on . Therefore, the first idea was to write an additional subroutine that would break the names of the functions into separate words, such as read and data in the first three cases, and the fourth would try to burn out fire.
After the breakdown of all the names of the functions in which errors were found, into words, this distribution was obtained.
- 159: get
- 69: set
- 46: init
- 44: create
- 44: to
- 38: on
- 37: read
- 35: file
- 34: is
- 30: string
- 29: data
- 29: operator
- 26: proc
- 25: add
- 25: parse
- 25: write
- 24: draw
- 24: from
- 23: info
- 22: process
- 22: update
- 20: find
- 20: load
Apparently, in functions with the word 'get', errors are allowed in the name more often than in functions with 'set'. Well, or perhaps our analyzer finds more errors in the get functions than in the set functions. Perhaps get functions are programmed more often than set functions.
On the set of words in the functions, an analysis was carried out, similar to the analysis in the previous paragraph. This time, the results are still not very large and can be brought here in full. The names of the functions are not very visible and any dependencies can be traced. Although I managed to isolate something.
- 77.78% (14 of 18): dlg -> proc
- 70.59% (12 of 17): name -> get
- 53.85% (14 of 26): proc -> dlg
- 43.48% (10 of 23): info -> get
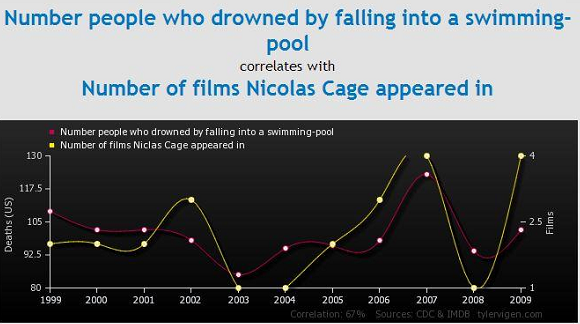
The level of validity of this result is somewhat comparable to this correlation:
Assumption 5. Some diagnostics work more often than others.
Again, the assumption is in fairly obvious style. During the development of the analyzer, no one set himself the task of making the various diagnostics issue with approximately the same frequency. And even if such a task was posed, some errors can be noticed almost immediately (such as V614 ) and are intended mainly to speed up development by automatically displaying a message in incremental analysis. And some, on the contrary, may go unnoticed until the end of the product life cycle (such as V597 ). The database also contains errors found by the results of the analysis of Open Source (for the most part) of the projects, and mostly these are the stable versions. Needless to say, in such cases, where are errors of the second class more often than the first?
The method of calculation is quite simple. Let us consider an example. The database contains the following entry:
NetXMS V668 There is no sense in .... calltip.cpp 260 PRectangle CallTip::CallTipStart(....) { .... val = new char[strlen(defn) + 1]; if (!val) return PRectangle(); .... } Identical errors can be found in some other places: V668 There is no sense in .... cellbuffer.cpp 153 V668 There is no sense in .... document.cpp 1377 V668 There is no sense in .... document.cpp 1399 And 23 additional diagnostic messages. The first line is the short name of the project. It will be needed later. The second entry contains information about the error — the number of the diagnostics that failed, a description of the diagnosis, the name of the .cpp file in which the error was detected, and the line number. Next comes the code that is not interesting to us. Next, there is a record of additional places where the diagnosis was found, also with a diagnostic message, the module name and the line in which the error was found. This information may well not be. The last line is also optional and contains only the number of errors omitted for brevity. As a result, from this example, we get information that in the NetXMS project, the V668 diagnostics detected 1 + 3 + 23 = 27 errors. You can handle the following.
So, the numbers of the most common diagnostics:
- 1037: 668
- 1016: 595
- 311: 610
- 249: 547
- 231: 501
- 171: 576
- 143: 519
- 141: 636
- 140: 597
- 120: 512
- 89: 645
- 83: 611
- 81: 557
- 78: 624
- 67: 523
Two diagnostics associated with working with memory, clearly lead. It is not surprising, because in C / C ++ languages there is just “dangerous” memory management. Diagnostics V595 searches for cases when object dereferencing by null pointer is possible, and V668 diagnostics warns that it is meaningless to check the pointer issued by the new operator that it will be zero, because new throws an exception if memory cannot be allocated. Yes, 9X.XX% programmers make mistakes when working with memory in C / C ++ languages.

And then the idea arose to check in which projects the most errors were found and even what they were. Well, it is said - done.
- 640: Miranda NG :
- - V595 : 165 (25.8%)
- - V645 : 84 (13.1%)
- - V668 : 83 (13%)
- 388: ReactOS :
- - V595 : 213 (54.9%)
- - V547 : 32 (8.25%)
- 280: V8 :
- - V668 : 237 (84.6%)
- 258: Geant4 :
- - V624 : 71 (27.5%)
- - V668 : 70 (27.1%)
- - V595 : 31 (12%)
- 216: icu :
- - V668 : 212 (98.1%)
Assumption 6. The error density at the beginning of the file is higher than at the end.
The latter assumption also did not differ particularly elegant. The idea is this: are there any lines or groups of lines (for example, from 67 to 75), where programmers make mistakes most often? It is pretty obvious that programmers will rarely make mistakes in the first ten lines (well, in those where #pragma once or #include “file.h” is often written), it was also quite obvious that programmers rarely make mistakes in lines from 30,000 to 30100. At least because such large files in real projects usually simply do not exist.
Actually, the calculation method was quite simple. Each diagnostic error message contains the line number of the error file. Yes, that's just not all the errors show the line number: from the example above, you can get only four line numbers from the possible twenty-seven, since the remaining twenty-three are not described. But with the help of this tool you can get a lot of errors from the database. That's just the total size of the .cpp file for later normalization is not saved anywhere, so there will be no reduction to relative percentages. In other words, based on the examples it is impossible to just take and test the hypothesis that 80% of errors occur in the last 20% of the file .
This time, instead of textual information, we will provide a full-fledged histogram.
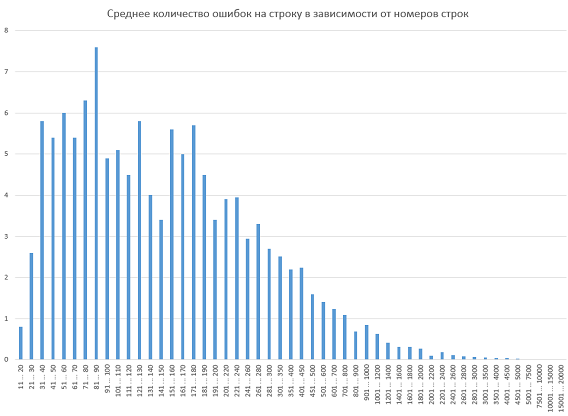
Figure 1 - The histogram of the density distribution of errors depending on the number of the code line
The calculation was carried out as follows (using the first column as an example): we calculated how many errors occurred in lines 11 through 20 and divided this number by the number of lines between the twentieth and eleventh inclusive (that is, 10). As a result, a little less than one error was made for all projects on lines 11 through 20. This indicator is displayed in the histogram. I remind you that we did not make normalization - more important were not the exact values, which still are unlikely to reflect the dynamics due to the small sample size, but at least the type of graph.
Despite the fact that the histogram shows abrupt deviations from the norm (and this norm is somewhat similar to the log-normal distribution ), we decided not to delve into the proof that from 81 to 90 lines of the error code are most frequently committed. Still, drawing a graph is one task, and mathematically rigorously proving something on its basis is another, and much more complicated. As for the same schedule, it was decided to limit ourselves to a vague phrase. "Unfortunately, all deviations, it seems, in their magnitude do not exceed the statistical error." That's all.
Conclusion
In this article, it was clearly shown how you can, while engaging in absolute nonsense, write scientific texts and get paid for it.
But seriously - the fishing of statistical information on the database of errors has two serious problems. The first problem is what are we looking for? It is quite possible to confirm the “last line effect” manually (and even necessary, since automating the search for similar blocks is a thankless task), and everything else simply stumbles upon a lack of ideas. The second problem - is the sample size sufficient? It is possible that sampling is quite sufficient for frequency analysis of symbols, but this cannot be said for the rest of the statistics. The same can be said about statistical significance. Moreover, after collecting a database with a large number of experiments, it is not enough just to repeat the same thing. For a strict confirmation of a certain statistical hypothesis, it is necessary to carry out a lot of complicated mathematical calculations, for example, with the selection of the distribution function and the calculation of the Pearson approval criterion . Of course, if the dependency is supposed to be somewhere at the level of the astrologer's predictions, such tests are meaningless in principle.
This article was originally intended to search for directions, where exactly to dig in the statistics on the database of errors. If somewhere there was a sharp deviation from the norm, one could think about it and conduct more detailed experiments. However, this is nowhere seen, alas, was not.
Source: https://habr.com/ru/post/247677/
All Articles