Chart Wars: Charts Strike Back
What could be worse than a pie chart?We all have seen more than once what could go wrong with data visualization. Today we will discuss several important principles that underlie high-quality graphics, and what is much more interesting, we will find out what happens if these rules are NOT followed.
Two pie charts! Edward Tufty
Article structure
- Measurement Perception
- Ink-data ratio
- Deception factor
- Simpson's Paradox
- John Snow still knows something - an example of a classic visualization
- What else to see, read
- Real life pie chart
( * careful traffic * )
')
Measurement Perception
Most often we need to depict linear values on the graph, i.e. the dependence of one variable X, for example, time in hours, on the second Y, for example, the distance traveled in km. Let 1 cm on the graph is 1 hour X and 5 km Y. Vasya rides a bicycle 10 km per hour and rode for 4 hours. Hence, the change in X will be 4 cm, and in Y 40/5 = 8 cm.
What can go wrong in this situation?
Area and 3D effects
The whole trick is in the details: imagine that some real measured quantity X 1 corresponds to the point Y 1 on the graph, and X 2 to the point Y 2 , which means that if the data changes from X 1 to X 2, the difference in the graph will be Y 2 - Y 1 . But it was not there - on a pie chart it would correspond to the difference in areas, and if you add three-dimensional effects, then volumes.
Examples in the studio! Imagine that the share of Android has grown by a few percent. Then on the graph below, the proportion will increase in proportion to the volume, rather than a linear scale. What does it threaten with? First of all, this leads to an absolute misunderstanding by the reader of the quantities in question and the impossibility of correct comparison of quantities. Who can guess what proportion Blackberry has on this chart and how much less is it on the iPhone?

Volume perception
Will the figures clearly saved on the chart save the situation? Not really. Consider a simple example where all values are explicitly spelled out. In the graph below, the green part is clearly twice as large as yellow, but in fact it is not.

(clickable; taken from here )
Cake party
Here the attentive reader can state that we have considered only pathological examples with three-dimensional effects, and if we use standard pie charts, then everything will go like clockwork. Attention is the question, how accurately can the data be compared between categories on a given chart?

(clickable)
Ink-data ratio
We now turn from the question of perception of data on the chart to informativeness. Question: How much information does this chart convey?

Answer: 4 (!) Numbers, with the brown part visually looking noticeably less green due to the three-dimensional perspective.
Can we improve this pie chart? To do this, ask some important questions:
- Is color really necessary here? If so, what function does it perform?
- What functional role does the three-dimensional effect play here?
- Is it easy to compare numbers with each other, is it worth changing the type of chart?
- Does background facilitate reading and perception of graphics?
- Do not duplicate the functional elements of each other, such as text labels and the use of color?
If we answer these questions, we can get something similar to this schedule:

Minimalistic example, not distracting the reader from the main.
On this topic I strongly recommend the course on Udacity: Data Visualization and D3.js
In particular on this issue, they have a great video:
After watching the video, compare this visualization.

and this

(although some do not agree with this example as “incorrect visualization”, and the debate will not end to this day).
Deception factor
If the graphs with areas and volumes did not convince, then it is time to write a convincing formula.

On the graph above, the number of miles per gallon of fuel changed from 18 to 27.5 , that is, by 53% , the growth on the graph was 783% , now let's calculate the deception factor.

Substituting the numbers, we get 783/53 = 14.8, we exaggerated the growth with the help of graphics almost 15 (!) Times.
More details and examples can be found here .
Exercise with an asterisk: calculate the factor of deception, taking into account the fact that the graph shows the volume instead of linear dimensions. It seems to me, or is there really 11 incredibly more than 9, and 6 and 11 are not comparable at all?

(Taken from here )
Simpson's Paradox
The catch can be where they least expect it. When visualizing the data, we often break them down into categories or groups and one of the classic surprises that may arise and is called the Simpson paradox.

Consider as an example Homer, who decided to improve his health and began to run around the stadium and record the results of training for months. The first four months he steadily increased the load, but in the fifth month he found a box with donuts and stopped training. After two months, the conscience and excess weight again pushed him to start training and again every month he increased the load.
It turns out, and in the first period, and in the second load grew, and on average the load steadily fell.
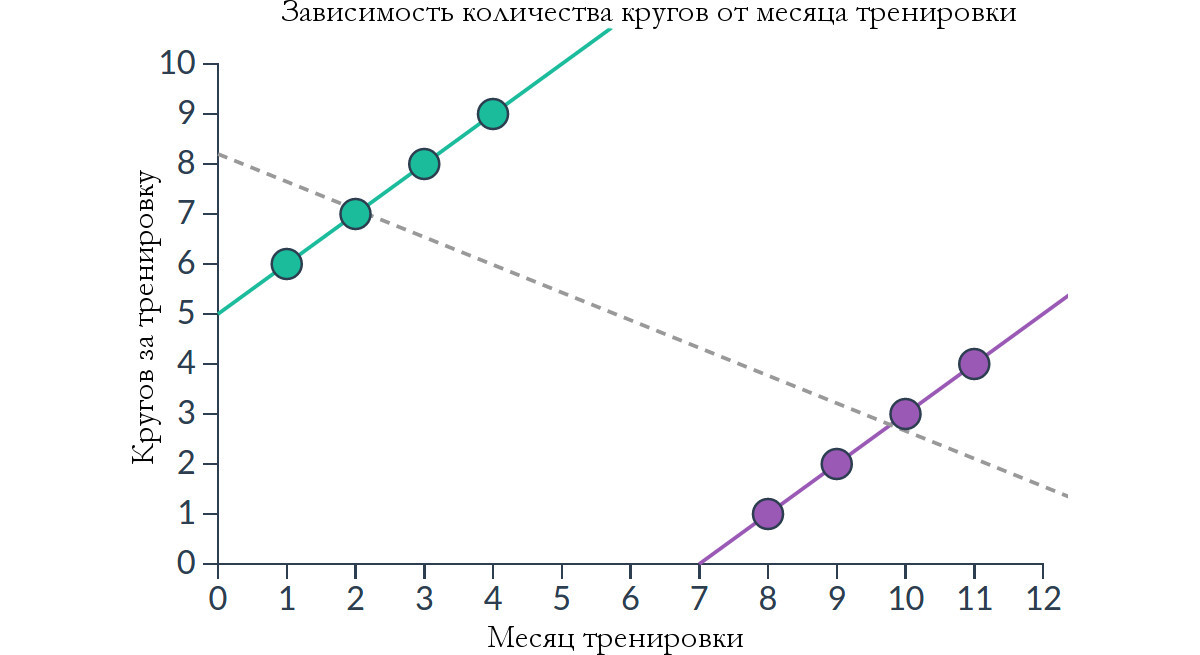
The paradox is that by breaking the data into groups, you can turn a negative trend into a positive one and vice versa.
Graphs and examples along with a detailed explanation of the paradox can also be found here (I recommend ).
John Snow still knows something - an example of a classic visualization
John Snow not only guarded the Wall , but also saved the inhabitants of London from cholera , using visualization. He plotted every dead person on the map and noticed that there was a cluster of deaths around the water column on Broad Stree. It was then that he hypothesized that the source of cholera in the contaminated water column. And he was right.

(clickable)
One of the interesting findings was that the brewery was the safest place (zero deaths), the water used and the cooking process itself made the beer much safer to drink than ordinary column water (though only in the middle of the 19th century in London).
Detailed story with an interactive map here .
What else to see, read
Video about the growth of the role of visualization in political life.

( video will transfer to another page ; you can also click here )
Useful books (must read, now enjoy reading first)
- The Visual Display of Quantitative Information by Edward Tufte
- Functional Art by Alberto Cairo
- The Grammar of Leland Wilkinson
Real life pie chart
<humor> Pie chart in real life </ humor>

Happy friday
Source: https://habr.com/ru/post/247607/
All Articles