Reports for NORD POS. Part 1
Take the data, JasperReports and fill in the template in iReport
This article is not so much about how to do this beautifully from the point of view of design, but how to make the reports clear for the user and convenient for further use by the integrator using the available JasperReports tools. Since JasperReports is not primarily a standalone application, but an extension library for programs written in Java, we will use the database from NORD POS as a source of information for building reports (more about this project in a separate article ). At the same time, I hope that the material described under the cut will be of interest not only to users of my POS, but also to all those who want to learn more about the powerful reporting tool for their application, and there is not a lot of JasperReports materials in Russian.
')
Load the base
The basis for building any report using JasperReports is a template with jrxml extension. This XML file can be created from scratch, either in a text editor, or assembled from elements (and in fact XML tags) in the visual iReport shell. The iReport application is available as a plugin for NetBeans or as a standalone program. For this article, I chose the second option, as more visual from my point of view.
The first thing that needs to be done after installing and launching iReport is to create a clean sheet of a template for later filling in with report elements ( File -> New ... command). I chose the A4 format template, located portrait.
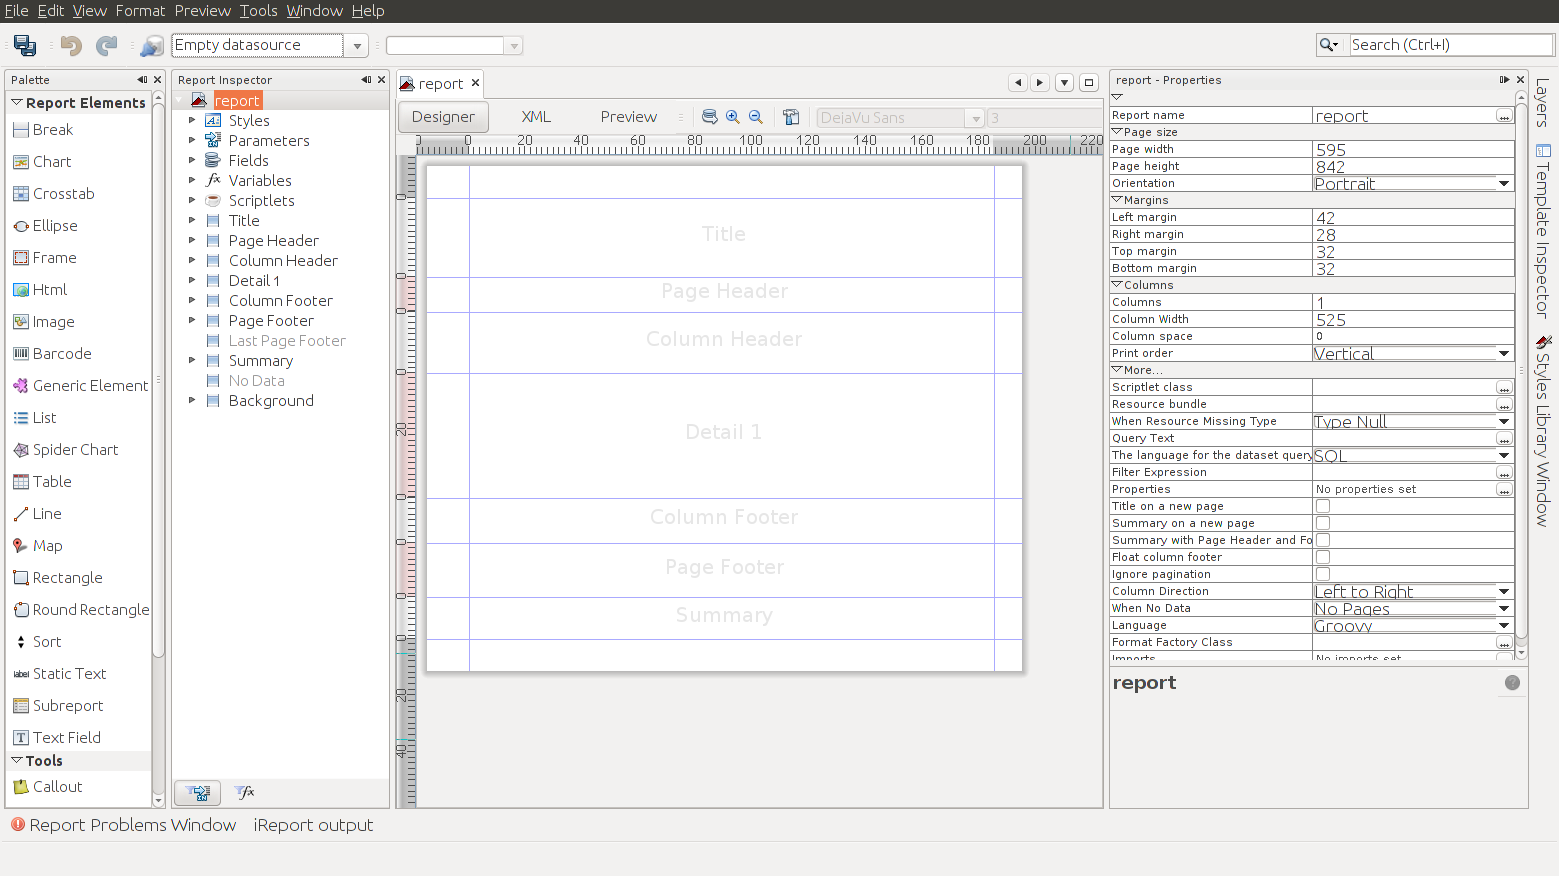
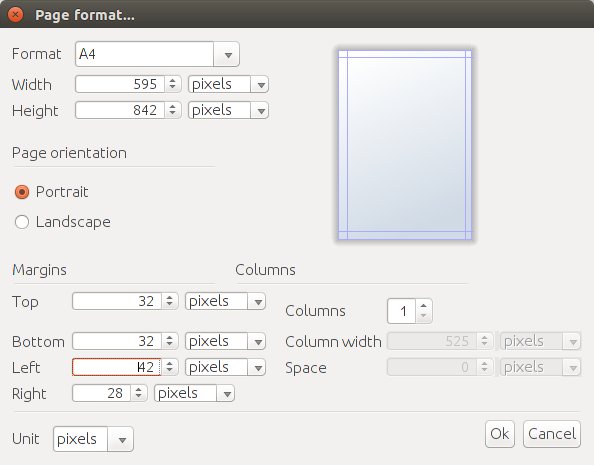
In the future, you can change both the paper format and the margin fields on it (the Format command -> Page format ... ). And here you will encounter the first problem, which you will have to take into account in the course of all the work with JasperReports, the inability to accurately set the values in millimeters familiar to us. You can accurately set only the value in pixels, while for one inch there are 72 pixels, but in millimeters it will always be a fractional value of 25.4 mm. In a regular report from the columns, this is not very significant, but if you make a label template, then this approach to the calculations will spoil your nerves considerably, since there is only a millimeter ruler on hand and it will be necessary to experimentally pick up the number of pixels that will fit when printing on the etiquette tapes. Here's how I did it:
Same empty report form in XML
<?xml version="1.0" encoding="UTF-8"?> <jasperReport xmlns="http://jasperreports.sourceforge.net/jasperreports" xmlns:xsi="http://www.w3.org/2001/XMLSchema-instance" xsi:schemaLocation="http://jasperreports.sourceforge.net/jasperreports http://jasperreports.sourceforge.net/xsd/jasperreport.xsd" name="report" language="groovy" pageWidth="595" pageHeight="842" columnWidth="525" leftMargin="42" rightMargin="28" topMargin="32" bottomMargin="32" uuid="fd614d3e-f49f-4d37-848f-ffffd7b3d536"> <property name="ireport.zoom" value="1.0"/> <property name="ireport.x" value="0"/> <property name="ireport.y" value="0"/> <background> <band splitType="Stretch"/> </background> <title> <band height="79" splitType="Stretch"/> </title> <pageHeader> <band height="35" splitType="Stretch"/> </pageHeader> <columnHeader> <band height="61" splitType="Stretch"/> </columnHeader> <detail> <band height="125" splitType="Stretch"/> </detail> <columnFooter> <band height="45" splitType="Stretch"/> </columnFooter> <pageFooter> <band height="54" splitType="Stretch"/> </pageFooter> <summary> <band height="42" splitType="Stretch"/> </summary> </jasperReport> And these dimensions will correspond approximately to the indents at the top and bottom of 11 mm, on the left 15 mm, and on the right 10 mm.
Connect the source
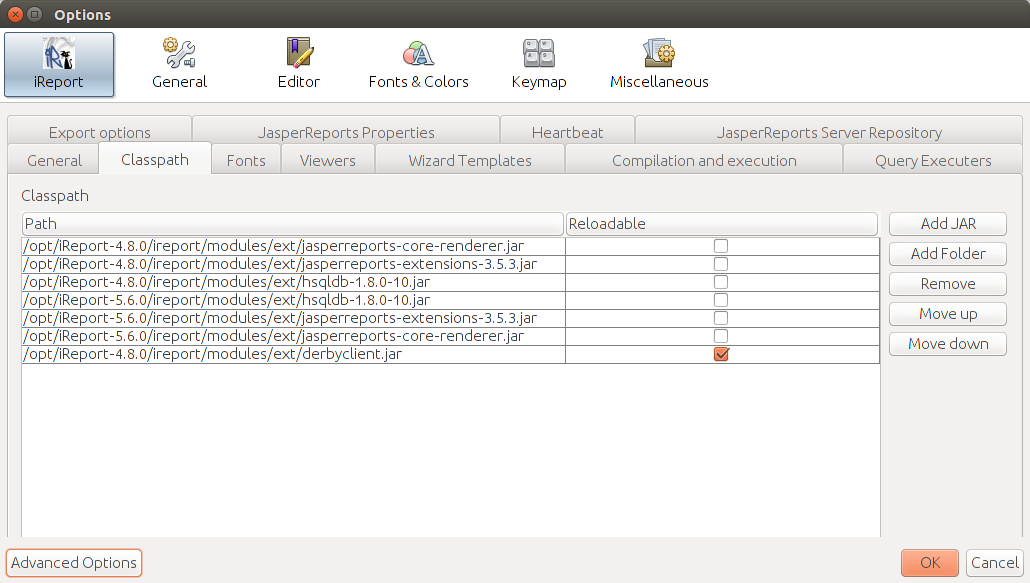
If the report form template is the main visual component of JasperReports, then the data sources are the internal basis of the processing and report building mechanism. As a source of data, can serve as a database or data storage, and for example just a table or text files. But in my case with NORD POS, the Apache Derby database connected via the JDBC driver will act as a data source. Since the Apache Derby client driver library is not added by default to the iReport environment, first you need to specify the path to it in the parameters ( Tools -> Options command) and restart iReport.
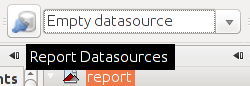
Initially, the source selected by default is empty.
But entering the parameters you can add it, making it a source of information for filling in the report fields.
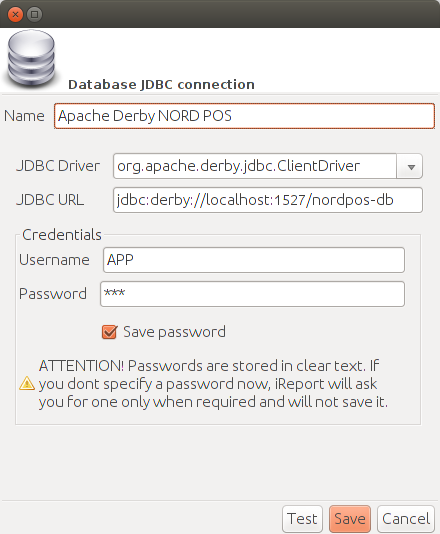
By specifying the parameters of the JDBC driver and running NORD POS in advance, you can check the connection. And in order to make sure that the database fields are available JasperReports, we will make a simple request.
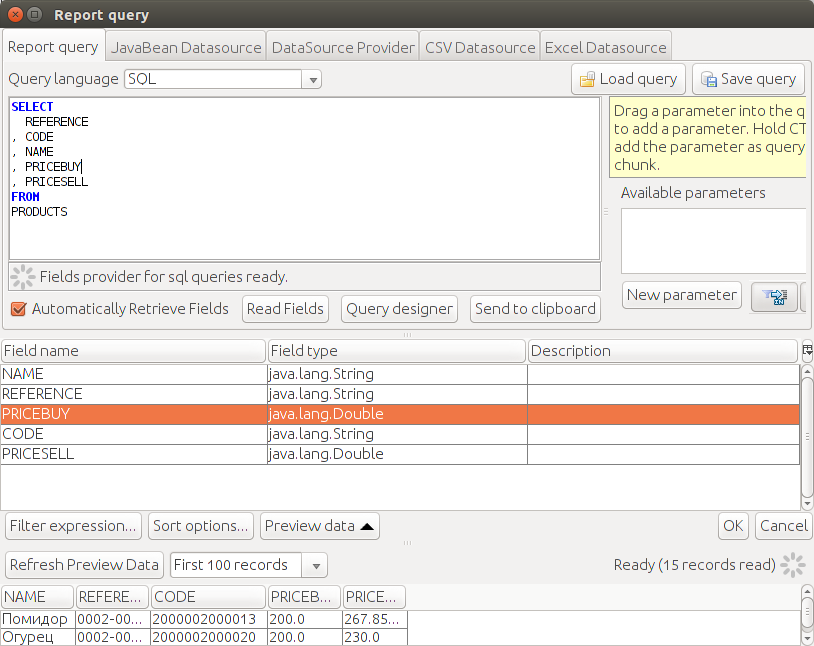
This request, but in XML format
<queryString> <![CDATA[SELECT REFERENCE , CODE , NAME , PRICEBUY , PRICESELL FROM PRODUCTS]]> </queryString> Our source is ready to use.
We write request
It was a very simple SQL query, as a result of its execution we will receive only the list of products stored in the NORD POS database. But usually in reports it is necessary to use more complex constructions. In addition to the names of the goods themselves, it was good to get the names of the categories of goods for the subsequent grouping of goods in our report. And, since the sale price of goods from us does not contain tax, then it is still necessary to get the tax rate for each item of the goods in the directory. As a result, for the further construction of the report, we will use a SQL query of this type:
SELECT PRODUCTS.NAME AS PRODUCT_NAME , PRODUCTS.REFERENCE AS PRODUCT_REFERENCE , PRODUCTS.PRICESELL AS PRODUCT_PRICESELL , PRODUCTS.CATEGORY AS CATEGORY_ID , CATEGORIES.NAME AS CATEGORY_NAME , TAXES.RATE AS TAX_RATE FROM PRODUCTS LEFT OUTER JOIN CATEGORIES ON PRODUCTS.CATEGORY = CATEGORIES.ID LEFT OUTER JOIN TAXCATEGORIES ON PRODUCTS.TAXCAT = TAXCATEGORIES.ID LEFT OUTER JOIN TAXES ON TAXCATEGORIES.ID = TAXES.CATEGORY ORDER BY CATEGORIES.NAME, PRODUCTS.NAME At the same time, I just want to warn you, when building SQL queries, try to avoid constructs in them for grouping data directly at the source level, but do not forget to sort the data beforehand. It is better to entrust all operations related to the consolidation of information directly to JasperReports, so your report will be more versatile for various DBMS, and you will be able to change the sequence of processing algorithms by presenting data in various forms in a more flexible way.
As a result, fields from the data source will become available in the report structure panel.
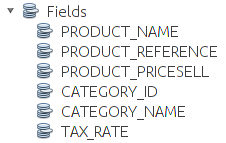
And a set of tags will appear in the XML template.
<field name="PRODUCT_NAME" class="java.lang.String"/> <field name="PRODUCT_REFERENCE" class="java.lang.String"/> <field name="PRODUCT_PRICESELL" class="java.lang.Double"/> <field name="CATEGORY_ID" class="java.lang.String"/> <field name="CATEGORY_NAME" class="java.lang.String"/> <field name="TAX_RATE" class="java.lang.Double"/> Place the data
When the data is available, it's time to tell how to put it in the report. To begin with, simply place the received fields in the Detail section, automatically the field labels will be moved to the Column Header section of the header.
The columnHeader and detail sections will be generated in the XML template.
<columnHeader> <band height="25" splitType="Stretch"> <staticText> <reportElement uuid="3f6fd221-3e67-43c8-99fb-42ba466921b2" x="0" y="0" width="105" height="20"/> <textElement/> <text><![CDATA[CATEGORY_NAME]]></text> </staticText> <staticText> <reportElement uuid="94d5a5b4-7214-4859-a6d5-a6c42f4613f7" x="105" y="0" width="105" height="20"/> <textElement/> <text><![CDATA[PRODUCT_REFERENCE]]></text> </staticText> <staticText> <reportElement uuid="d50c28cb-ea78-4b71-9be5-b0902bd20a3f" x="210" y="0" width="105" height="20"/> <textElement/> <text><![CDATA[PRODUCT_NAME]]></text> </staticText> <staticText> <reportElement uuid="6ddf9669-96cc-4b68-9dc3-e5a9ae8378f7" x="315" y="0" width="105" height="20"/> <textElement/> <text><![CDATA[TAX_RATE]]></text> </staticText> <staticText> <reportElement uuid="4d226419-7cf1-4bfe-97fa-3dc1ff0ef184" x="420" y="0" width="105" height="20"/> <textElement/> <text><![CDATA[PRODUCT_PRICESELL]]></text> </staticText> </band> </columnHeader> <detail> <band height="36" splitType="Stretch"> <textField> <reportElement uuid="2ba3f12f-05fc-459e-aafa-12fdc94f3b33" x="0" y="0" width="105" height="20"/> <textElement/> <textFieldExpression><![CDATA[$F{CATEGORY_NAME}]]></textFieldExpression> </textField> <textField> <reportElement uuid="0305692c-11b5-4e56-a593-67d1e5125acc" x="105" y="0" width="105" height="20"/> <textElement/> <textFieldExpression><![CDATA[$F{PRODUCT_REFERENCE}]]></textFieldExpression> </textField> <textField> <reportElement uuid="b6788acf-3936-473c-ba83-b6fc204b6df0" x="210" y="0" width="105" height="20"/> <textElement/> <textFieldExpression><![CDATA[$F{PRODUCT_NAME}]]></textFieldExpression> </textField> <textField> <reportElement uuid="c7cf41b1-72db-4683-a83f-b7b1953a4f55" x="315" y="0" width="105" height="20"/> <textElement/> <textFieldExpression><![CDATA[$F{TAX_RATE}]]></textFieldExpression> </textField> <textField> <reportElement uuid="fe6e95c1-b6c2-4cf2-94c3-3a22bc176fe9" x="420" y="0" width="105" height="20"/> <textElement/> <textFieldExpression><![CDATA[$F{PRODUCT_PRICESELL}]]></textFieldExpression> </textField> </band> </detail> Now, if we click on the preview, we will see our list of products from the database already in the form of a report.
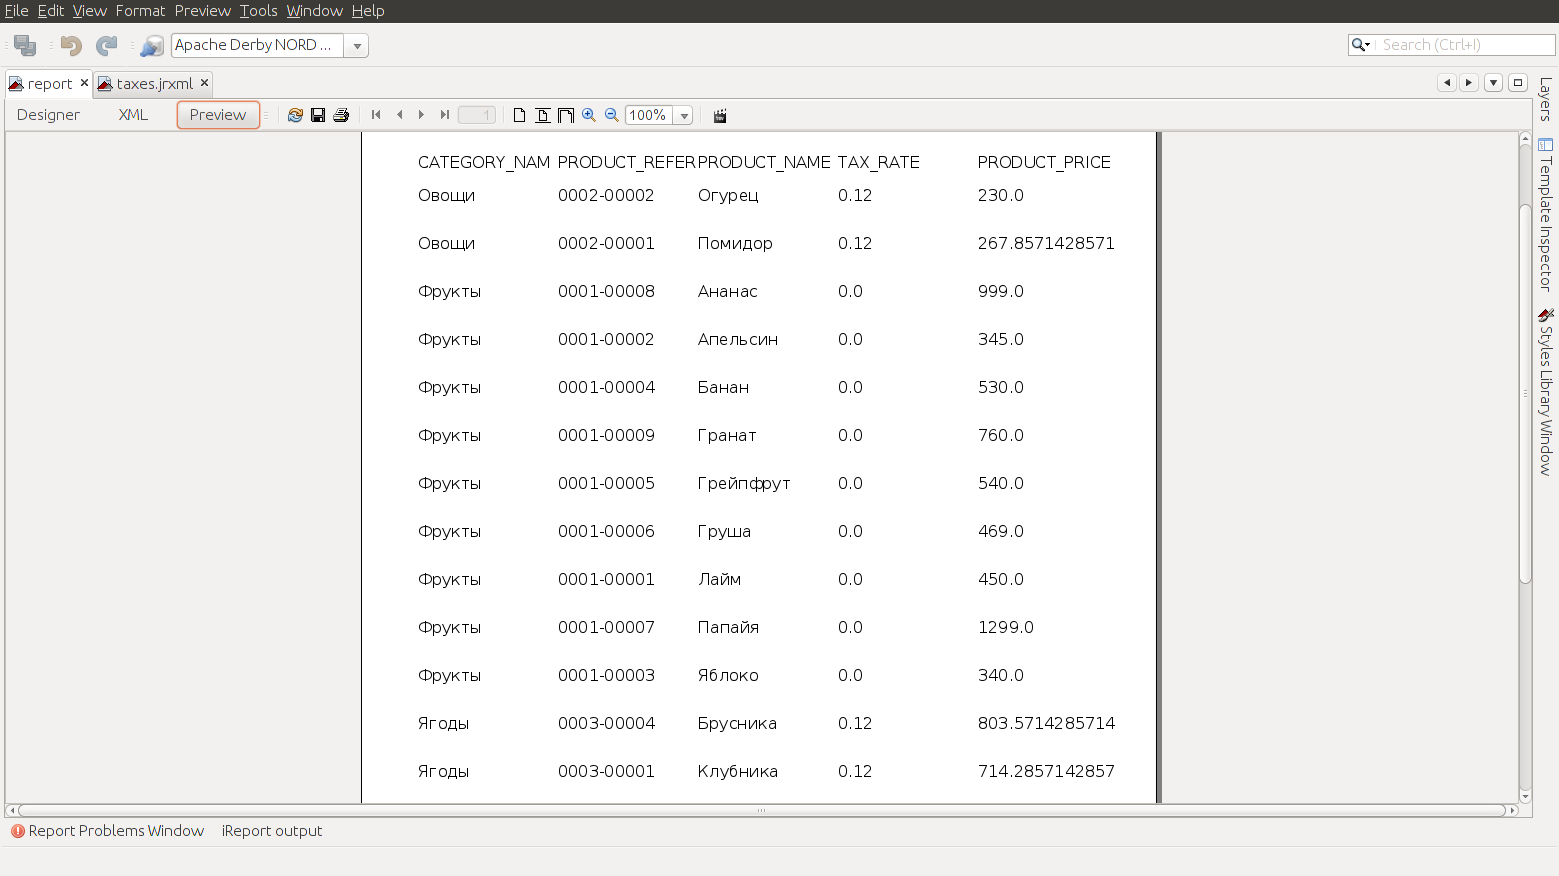
The data has been received and the report has been generated; now you can proceed to processing and processing the report for a more visual presentation of information.
We make a template
Let's start with the simplest, make the header and footer of our report. To do this, add a caption and a blue banner for the background to the Title section, and a variable substitution for the number of pages in Page Footer .
Report Title Section
<title> <band height="36" splitType="Stretch"> <rectangle> <reportElement uuid="9fb6b6a2-ea0f-4f4d-b1a6-a31857059071" style="banner" x="0" y="0" width="525" height="36"/> <graphicElement> <pen lineWidth="0.0"/> </graphicElement> </rectangle> <staticText> <reportElement uuid="5b0c017a-ff0b-436d-a40c-80193711879f" style="title" x="2" y="2" width="365" height="32"/> <textElement> <font fontName="SansSerif" pdfFontName="DejaVu Sans" isPdfEmbedded="false"/> </textElement> <text><![CDATA[ ]]></text> </staticText> </band> </title> PageFooter footer section
<pageFooter> <band height="26" splitType="Stretch"> <line> <reportElement uuid="fa91a55e-d7ff-40ea-9c32-850fe9e071d1" x="0" y="0" width="525" height="1"/> <graphicElement> <pen lineWidth="1.5" lineStyle="Double" lineColor="#000000"/> </graphicElement> </line> <textField> <reportElement uuid="c6de22d0-f93b-4514-bd5f-991f3096f696" style="base" x="449" y="6" width="39" height="20"/> <textElement textAlignment="Right"> <font isBold="true"/> </textElement> <textFieldExpression><![CDATA[$V{PAGE_NUMBER}.toString().concat("/")]]></textFieldExpression> </textField> <textField evaluationTime="Report"> <reportElement uuid="5fe48711-cf48-4b70-8b17-0826c3aaf6ca" style="base" x="488" y="6" width="21" height="20"/> <textElement> <font isBold="true"/> </textElement> <textFieldExpression><![CDATA[$V{PAGE_NUMBER}]]></textFieldExpression> </textField> </band> </pageFooter> In order to make the reports uniform, I recommend using the style set, making one of them the default one. Styles are a group of fields at the beginning of our template, they set general parameters for the design of report elements, and can be set not only for text elements, but also for the shapes and lines included in the template.
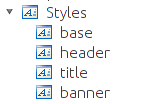
Style set
<style name="base" isDefault="true" hAlign="Left" vAlign="Middle" fontSize="12" isBold="false" isItalic="false" isUnderline="false" isStrikeThrough="false"/> <style name="header" style="base" hAlign="Center" isBold="true"/> <style name="title" style="base" forecolor="#FFFFFF" fontSize="20" isBold="true"> <paragraph leftIndent="24"/> </style> <style name="banner" backcolor="#003278" radius="5"> <box> <pen lineWidth="0.0"/> <topPen lineWidth="0.0"/> <leftPen lineWidth="0.0"/> <bottomPen lineWidth="0.0"/> <rightPen lineWidth="0.0"/> </box> </style> Do the calculations
When creating templates in the variable section, several counters are automatically generated, their value changes depending on the position in the template. For example, we have already used PAGE_NUMBER to count the pages, while using the same variable, but setting the parameter evaluationTime = "Report" for the second field, we obtained the total number of pages in the report.
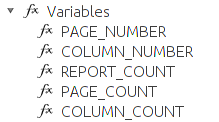
To specify the sequence number of the item position in the report, we use the variable COLUMN_COUNT , selecting it from the list and inserting it into the expression to calculate the field value.
Ordinal row number
<textField> <reportElement uuid="852df6f7-daf1-4deb-8a05-94c0dba32355" style="base" x="10" y="2" width="25" height="32"/> <textElement textAlignment="Center" verticalAlignment="Top"/> <textFieldExpression><![CDATA[$V{COLUMN_COUNT}]]></textFieldExpression> </textField> The value of the article PRODUCT_REFERENCE , since it contains only numbers and a minus sign as a separator between the group code and the product code, put the generating bar code in a separate object.
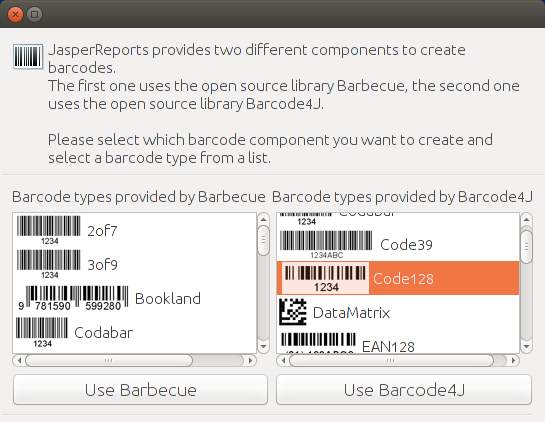
Barcode field
/>
<jr: Code128 xmlns: jr = " jasperreports.sourceforge.net/jasperreports/components " xsi: schemaLocation = " jasperreports.sourceforge.net/jasperreports/components jasperreports.sourceforge.net/xsd/components.xsd " moduleWidth = "1.5" textPosition = "bottom" quietZone = "10.0">
<jr: codeExpression> <! [CDATA [$ F {PRODUCT_REFERENCE}]]> </ jr: codeExpression>
</ jr: Code128>
The PRODUCT_NAME , PRODUCT_PRICESELL and TAX_RATE fields will be left as they were obtained from the database, only by specifying patterns for PRODUCT_PRICESELL currencies, and for TAX_RATE percent.
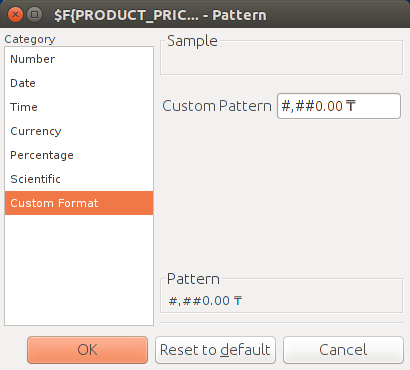
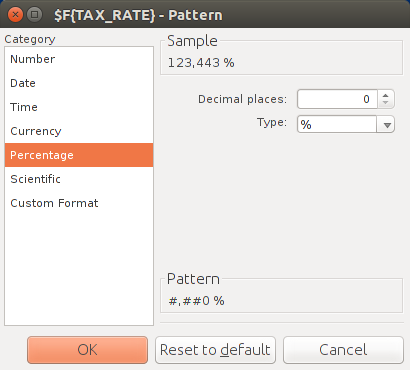
PRODUCT_NAME, PRODUCT_PRICESELL and TAX_RATE fields
<textField> <reportElement uuid="aacdbf49-b841-46b4-b7bf-12fe12c7fb96" x="193" y="2" width="98" height="32"/> <textElement verticalAlignment="Top"/> <textFieldExpression><![CDATA[$F{PRODUCT_NAME}]]></textFieldExpression> </textField> <textField pattern="#,##0.00 ₸" isBlankWhenNull="false"> <reportElement uuid="4e564eb3-3c86-4d3b-831b-2038679ebb3f" x="296" y="2" width="84" height="32"/> <textElement textAlignment="Right" verticalAlignment="Top"/> <textFieldExpression><![CDATA[$F{PRODUCT_PRICESELL}]]></textFieldExpression> </textField> <textField pattern="#,##0 %" isBlankWhenNull="false"> <reportElement uuid="4e564eb3-3c86-4d3b-831b-2038679ebb3f" x="384" y="2" width="35" height="32"/> <textElement textAlignment="Right" verticalAlignment="Top"/> <textFieldExpression><![CDATA[$F{TAX_RATE}]]></textFieldExpression> </textField> The last we have is the calculation field to get the amount of the price with tax.
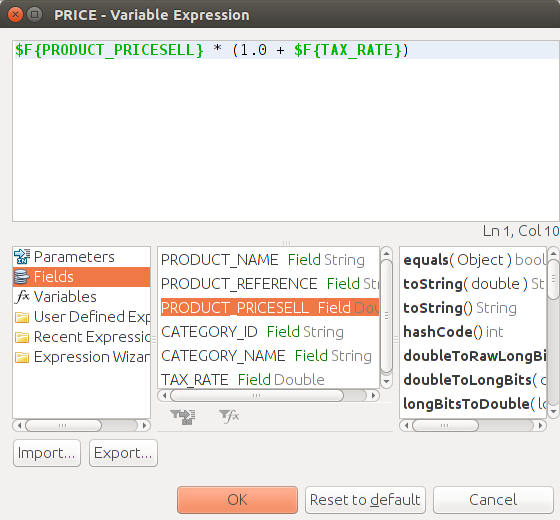
Pricing with tax
<textField pattern="#,##0.00 ₸" isBlankWhenNull="false"> <reportElement uuid="1158eb51-5046-4b15-88f2-2456bac9eea1" x="425" y="2" width="84" height="32"/> <textElement textAlignment="Right" verticalAlignment="Top"/> <textFieldExpression><![CDATA[$F{PRODUCT_PRICESELL} * (1.0 + $F{TAX_RATE})]]></textFieldExpression> </textField> Group the fields
And finally, we will make two groups. First, let's group our product range by category code, considering how many items each item has with Categories_COUNT .
Item grouping by product category
<group name="Categories" isReprintHeaderOnEachPage="true"> <groupExpression><![CDATA[$F{CATEGORY_ID}]]></groupExpression> <groupHeader> <band height="33" splitType="Prevent"> <textField> <reportElement uuid="8bcbd93c-b2e7-4abd-a377-a8658c3ef27a" style="base" x="40" y="6" width="148" height="20"/> <textElement> <font size="14" isBold="true"/> </textElement> <textFieldExpression><![CDATA[$F{CATEGORY_NAME}]]></textFieldExpression> </textField> <textField evaluationTime="Group" evaluationGroup="Categories" pattern="#,##0"> <reportElement uuid="871626e0-83a8-4591-bccc-fc1c507b5a60" x="384" y="6" width="125" height="20"/> <textElement> <font size="14" isBold="true"/> </textElement> <textFieldExpression><![CDATA[$V{Categories_COUNT}]]></textFieldExpression> </textField> </band> </groupHeader> </group> The second, this is the final section of the Summary report, in it REPORT_COUNT will calculate how many total nomenclature positions are included in our report.
Total
<summary> <band height="30"> <line> <reportElement uuid="fa91a55e-d7ff-40ea-9c32-850fe9e071d1" x="10" y="1" width="503" height="1"/> <graphicElement> <pen lineWidth="1.0" lineStyle="Solid" lineColor="#000000"/> </graphicElement> </line> <textField> <reportElement uuid="e2e2a0be-0edc-4e04-b909-4452cab89989" x="384" y="6" width="125" height="20"/> <textElement> <font size="14" isBold="true"/> </textElement> <textFieldExpression><![CDATA[$V{REPORT_COUNT}]]></textFieldExpression> </textField> <staticText> <reportElement uuid="9780a598-1afc-41a5-9363-ef4bf3dc6e02" x="40" y="6" width="148" height="20"/> <textElement> <font size="14" isBold="true"/> </textElement> <text><![CDATA[ ]]></text> </staticText> </band> </summary> Template is ready
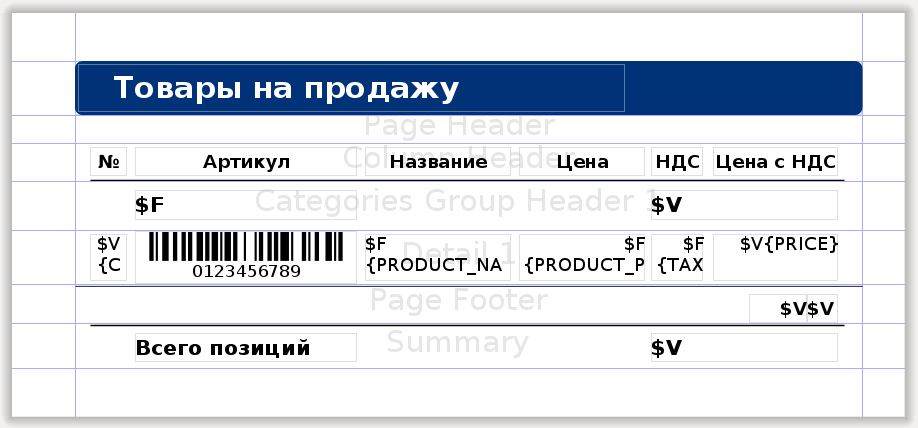
Everything, you can click the view, our template is ready for the formation of the report.
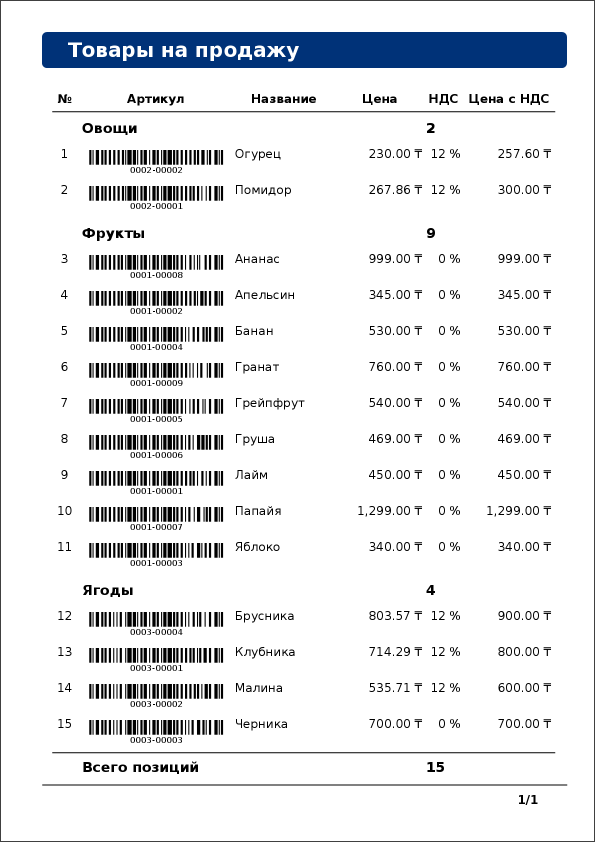
Now you can begin to integrate it into NORD POS, but the second part of the article will be devoted to this . And in this part I tried to summarize the most basic and simple ways to create templates in iReport, so what is described here is useful not only for NORD POS users, but for everyone who needs to create their own report for JasperReports for the first time.
Source: https://habr.com/ru/post/247515/
All Articles