PROSPECTOR inside
If possible, it is better not to develop expert systems (c)
Many expert systems have been developed in the world, in this post I would like to consider the structure and logic of the work of one of the ancient ES called “PROSPECTOR”.
1. General concepts
An expert system is a computer system that can partially replace a specialist expert in resolving a problem situation.
PROSPECTOR is a geological exploration expert system designed for geological exploration of mineral deposits.
2. Brief system description
The PROSPECTOR system works with fuzzy data and fuzzy knowledge. The system is based on fuzzy logic and is well applied to various areas. However, despite the capabilities of the model used, the logic of the ES operation differs from human logic and therefore the user may not understand the meaning of the system issues. In this regard, a system constructed on the basis of the logic of the PROSPECTOR system should be able to explain the course of its “thoughts”.
')
3. Algorithm of work
The operation of the system is a dialogue between the system and the user. During the dialogue, the system receives from the user information about observations on the basis of which draws certain conclusions. The sequence of steps looks like this:
- The system chooses an observation that more changes the chances of the target hypothesis (in the PROSPECTOR system it is the presence of certain mineral resources)
- The system asks the user about the presence of the selected observation
- The user “responds” to the presence of surveillance system, and the answer is a number in the range from –5 to +5, where -5 is “definitely not”, +5 is “definitely yes”, and 0 means “I don't know”.
- After receiving the user's response, a wave of changes takes place in the semantic network: the chances of hypotheses that are affected by observation are recalculated.
- If the chances of a target hypothesis suit the user, then the system ends the dialogue, otherwise step 1.
4. Structure of KB
The knowledge base is a semantic network based on the knowledge of subject matter experts.
4.1. Semantic network
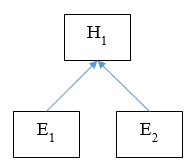
The elements of the semantic network are hypotheses, observations and links between them. For example, a semantic network might look like this:

Relative to each other, hypotheses are also observations. For example, H2 is the observation for the hypothesis H1.
In the semantic network, the following relationships are permissible:
- The hypothesis may depend on several observations.
- Observation may affect several hypotheses.
Each hypothesis has chances (O) and weight (C).
Weight is the value received from the user to the system questions (for observations), in other words, we can say that the weight is the degree of possibility of this observation.
Chance is the degree of fidelity of a given hypothesis (essentially the same probability). The dependency formula looks like this:

For hypotheses, odds are calculated by the formula:

Prior to the use of ES, all hypotheses have, initially set by an expert, a priori chances. The weights of the connections (C) of the hypotheses and observations are 0.
4.2. Semantic network connections
4.2.1. General concepts
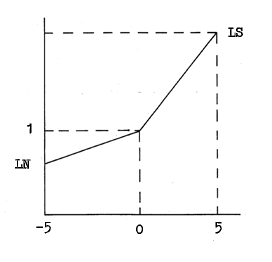
Each connection nodes (hypotheses and observations) in the semantic network has coefficients LS and LN.
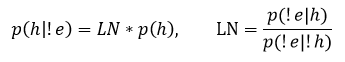
LS is the coefficient of sufficiency:
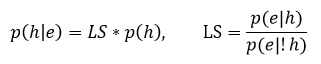
LN is the need ratio:
The coefficients LS and LN are set by the expert himself based on his experience and statistical data.
For different values, the coefficients may have different meanings:
- LS = LN - observation E does not affect the hypothesis of N.
- LS = 1 - the presence of observation E does not affect the hypothesis of N.
- LN = 1 - the lack of observation E does not affect the hypothesis N.
- LS> 1 - observation E strongly influences the hypothesis H (the larger the value, the more influenced).
- LN <1 - hypothesis H strongly needs observation E (the smaller the value, the more it needs).
Based on 4 and 5 points, we can conclude that only a couple of factors in the ES make sense:
LS > 1, LN <1 - needs and affects
There are 3 types of links in the system:
- brain teaser
- Contextual (conceptual)
- Productive
4.2.2. Logical connections
 Logical connections are operations of mathematical logic "AND", "OR", "NOT". Links impose restrictions on hypotheses that can be interpreted as:
- For the existence of the hypothesis H1, both observations E1 and E2 must be defined (the link "And"). All observations for this connection are set simultaneously.
- For the existence of the hypothesis H1, at least one observation E1 or E2 (the link "OR") must be defined.
The coefficients LS and LN are set for the entire link, not for each observation.
Weight is also set for communication and is calculated by the formula:
- For "And": C = min (C1, C2, ..., CN)
- For "OR": C = max (C1, C2, ..., CN)
- For "NOT": C = –C
4.2.3. Contextual relationships
 These links indicate which questions should be asked first.
For example, in the figure on the left, before the system asks a question regarding the H3 hypothesis, it is necessary that the weight (C) of the H2 hypothesis be in the range from 0 to 5 inclusive, that is, a positive answer is given regarding the H2 hypothesis.
Communication data does not have sufficiency factors (LS) and necessity (LN).
4.2.4. Product Relationships
 Links like "If ... then ...". For links of this type, weights are calculated by solving the system of equations:
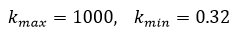
For H1, the maximum and minimum coefficients are:

Assume:
- for observation 1: = 2, LS = 50, LN = 0.4
- for observation 2: = -3, LS = 20, LN = 0.8
Thus we get the coefficients:
Having obtained the coefficients, we can calculate the function of dependence of the coefficient k (formula 2) on the weight of the observations. The graph of the function k is presented below:
The function k is not direct, therefore logarithmization is used for smoothing (the inverse operation of raising to a power):
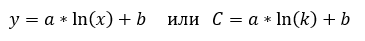
Solving the system of equations we get the function F:

After finding the function F, it is not difficult to calculate the value C for the hypothesis H1:

Below are the graphs of the obtained function F (blue) and the function k (formula 2) (red):

The natural logarithm is given as an example; in the PROSPECTOR system, calculations can be performed differently. For more accurate results, different polynomials can be used as an approximation.
4.3. Passages in the semantic network
Pass - change the weights of the semantic network. Divided into two types: direct and reverse.
4.3.1. Straight pass
The direct pass is performed when the user adds new information about the observations and it is necessary to recalculate the chances of the hypotheses according to the new data. The direct pass algorithm includes the steps:
- We set for observation the value of scales C received from the user
- We go up the hierarchy to the parent hypothesis (if there is no parent, then the output)
- We calculate the weight value (C) and the odds (O) for the hypothesis using formulas 1 and 3, respectively, proceeding to step 2.
4.3.2. Back pass
Used to find the issue of the system (observation). The algorithm consists of steps:
- Find all the observations that affect the target hypothesis
- For each observation, set the weight values of +5 and -5.
- Perform a direct pass for the next observation.
- Calculate the deviation of the value of the chance of a target hypothesis after a straight pass
- We return the values of weights and chances to their original state.
- After completing the passes for all observations, we single out an observation that more influences (changes) the target hypothesis - this is the next question of the system.
5. Example
Suppose there is a semantic network:

Trust is the hypothesis H1
Step 1 : perform the reverse pass
Due to the contextual relationship between H2 and H3, it is necessary to first obtain the value C for H2, therefore the backward pass will be performed only for observations E1, E2 and E4
By virtue of the logical connection of E1 and E2, the value C will be assigned to the connection itself
In total 4 straight passes will be made:
- E1E2 (C = + 5) -> H1
- E1E2 (C = -5) -> H1
- E4 (C = + 5) -> H1
- E4 (C = -5) -> H1
We calculate the value of C and O for the hypothesis H2 for option 1 (E1E2: C = + 5):
1) Calculate the weight (C) and odds (O) for H2:
The coupling coefficient for the H2 hypothesis is:
k = k (E1 & E2) * k (E4)
Consequently:
kmax = LS (E1 & E2) * LS (E4) = 400 * 10 = 4000
kmin = LN (E1 & E2) * LN (E4) = 0.34 * 0.1 = 0.034
Solve the system of equations from paragraph 4.2.4. Formula 3:
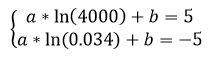
we get

Substitute the value of k = 400 (for C (E1E2) = +5), we obtain C (H2) = 3.02, O (H2) = 2800
2) Calculate the weight (C) and odds (O) for H1:
The coupling coefficient for the H1 hypothesis is:
k = k (H2) * k (H3)
Consequently:
kmax = LS (H2) * LS (H3) = 50 * 500 = 25000
kmin = LN (H2) * LN (H3) = 0.3 * 0.9 = 0.27
Solve the system of equations from paragraph 4.2.4. Formula 3:
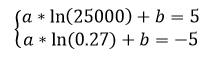
we get

Calculate the value of k (for C (H2) = 3.02):
k = 50 ^ (3.02 / 5) = 10.62
We obtain C (H1) = -1.75, O (H1) = 31.86
e = abs (Oa - Op) = 31.86 - 3 = 28.86
e is the rejection of the hypothesis chances (the difference of chances before and after the return pass)
Similarly, we find the deviations for the other options and we get:
- E1E2 with C = +5, e = 28.86
- E1E2 with C = -5, e = 2.04
- E4 with C = +5, e = 0.12
- E4 with C = -5, e = 1.89
According to the data received, the following issues of the system will be E1 and E2 (due to the logical link "AND" the user must enter data for two observations at once).
Step 2 : Receive data from the user
Assume that the user entered data for E1: C = 3, for E2: C = -4
Step 3 : perform a straight pass
1) We calculate the coefficients (k), weights (C) and odds (O) for H2:
For the connection E1E2 - H2 (C = min is selected (3, -4) by virtue of the logical "AND"):
k = 0.34 ^ (4/5) = 0.42
C (H2) = -1.77
O (H2) = 2.94
For communication H2 - H1:
k = 0.3 ^ (1.77 / 5) = 0.65
C (H1) = -3.24
O (H1) = 1.95
After performing a direct pass, we get the semantic network:

If the chances of an alternative suit, then we end. Otherwise, the a posteriori odds (Op) become a priori (Oa) and proceed to step 1.
6. Literature
- www.computing.surrey.ac.uk/ai/PROFILE/prospector.html
- aitopics.org/sites/default/files/classic/Machine_Intelligence_10/MI10-Ch15-Gaschnig.pdf
UPD: Fixed:
- logical connections, weight calculation (C)
- example (corrected incorrect calculations)
Source: https://habr.com/ru/post/247221/
All Articles