Other side of Go: we draw analyzing data
Go is a universal programming language that is great for background tasks, but sometimes you may need to generate images based on incoming data. Go works great with creating visual objects. This post describes one of the methods for creating images (in particular, vector graphics) based on data using the SVGo package.
The SVGo library deals with one single task: it generates SVG and gives it to io.Writer . I \ O package in Go allows you to output the results using the necessary interface (standard output, files, network connections, web server).
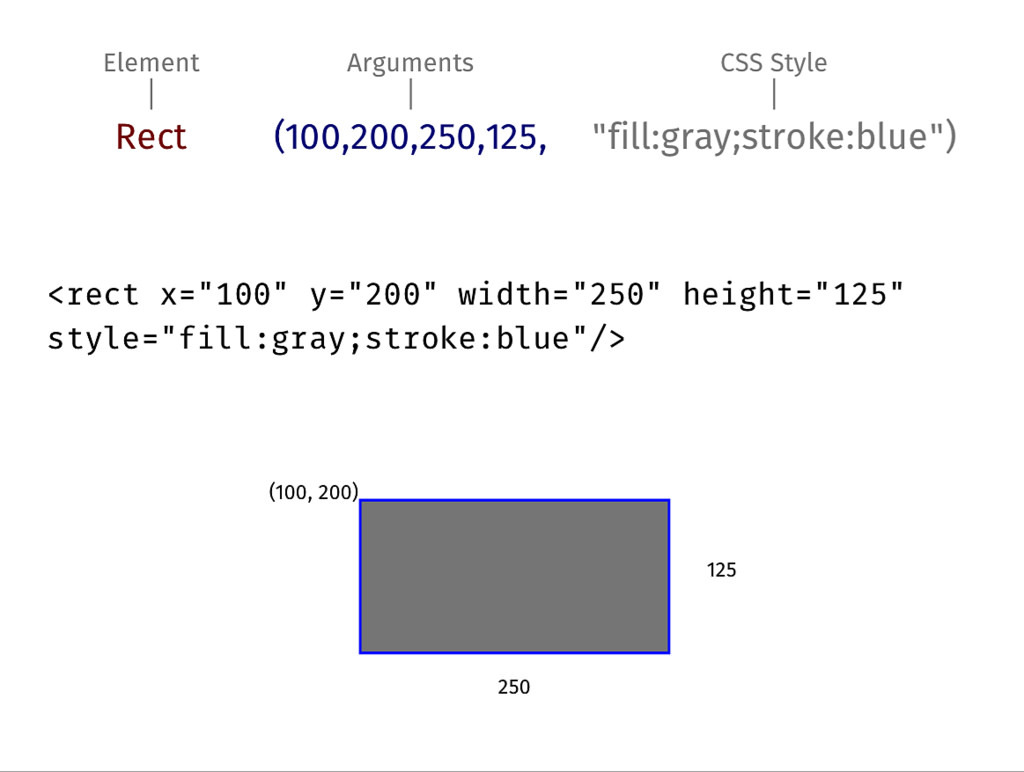
For SVGo, high-level objects such as circles, rectangles, lines, polygons and curves are paramount. Styles and attributes are secondary and apply as needed.
')
Our example will include the following steps:
Here is a simple example that takes data from XML, draws primitive SVG objects based on them, and returns them to standard output.
You need to understand that for your own data you can describe the structure as you like, at the same time if you get data from the API of third-party services, then you will need to describe the data structure for each one separately.
Sample incoming data:
First, we define the structure of the incoming data. You can see the correspondence between elements and attributes in Go. For example, the struct “thing” contains the Top and Left parameters that define indents, the sep parameter which sets the distance between elements and the Items parameter which is a list and will contain nested elements. In turn, each of the nested elements also has a set of parameters such as Width , Height , Name , Color , Text .
Then we must specify the output destination for the SVG (in our example, this will be the standard output) and the size of the canvas:
After that, we define a function for reading incoming data:
The next important step is to determine the function that is responsible for loading and analyzing incoming data. Here we will use the XML package included in the standard Go library.
When all the data is loaded, we go through it and draw the objects. For this we use the features of the SVGo package. In our case, we set the coordinates (x, y) for each element and draw a circle that corresponds to the sizes and colors specified in the element attributes and also add text and use vertical spacing.
Next we describe the main function of our example in which we will get the name of the file with data
An example of starting our example and the results of its work:
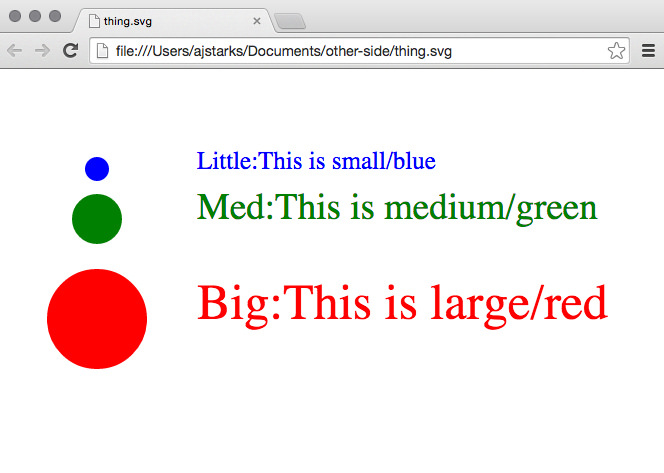
The finished SVG will look like this:
Using this example you can create many different visualization tools. For example, in my work, I use tools that can build simple barcharts and bullet graphs as well as more complex pie-charts and component diagrams .
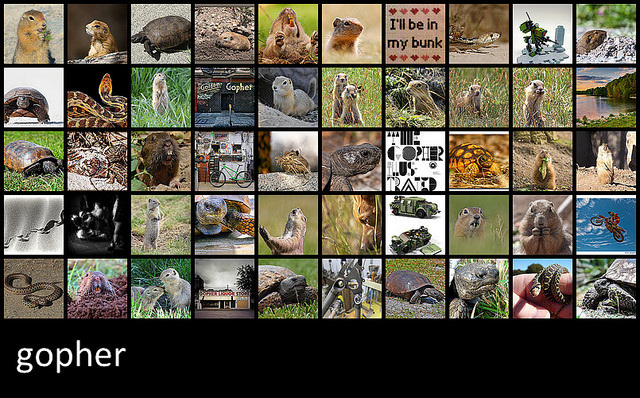
You can also create images based on data from the API of any services. For example, the program “f50” takes the word and on the basis of it generates a grid of images obtained from the Flickr API. f50 uses the same approach, except that the data is not taken from a local file, but an HTTPS Flickr API request is generated.
Usage example:
The Flickr API returns this response:
To create an SVG, we need the parameters id, secret, farm, server and title.
If you open the resulting SVG in the browser, then when you hover over the image you will see its title, and when you click it, you will go to the original image.
The SVGo library deals with one single task: it generates SVG and gives it to io.Writer . I \ O package in Go allows you to output the results using the necessary interface (standard output, files, network connections, web server).
For SVGo, high-level objects such as circles, rectangles, lines, polygons and curves are paramount. Styles and attributes are secondary and apply as needed.
')
Reading, analyzing, drawing objects.
Our example will include the following steps:
- Determining the structure of incoming data
- Reading data
- Parsing and logging data structures
- Image drawing
Here is a simple example that takes data from XML, draws primitive SVG objects based on them, and returns them to standard output.
You need to understand that for your own data you can describe the structure as you like, at the same time if you get data from the API of third-party services, then you will need to describe the data structure for each one separately.
Sample incoming data:
<thing top="100" left="100" sep="100"> <item width="50" height="50" name="Little" color="blue">This is small</item> <item width="75" height="100" name="Med" color="green">This is medium</item> <item width="100" height="200" name="Big" color="red">This is large</item> </thing> First, we define the structure of the incoming data. You can see the correspondence between elements and attributes in Go. For example, the struct “thing” contains the Top and Left parameters that define indents, the sep parameter which sets the distance between elements and the Items parameter which is a list and will contain nested elements. In turn, each of the nested elements also has a set of parameters such as Width , Height , Name , Color , Text .
type Thing struct { Top int `xml:"top,attr"` Left int `xml:"left,attr"` Sep int `xml:"sep,attr"` Item []item `xml:"item"` } type item struct { Width int `xml:"width,attr"` Height int `xml:"height,attr"` Name string `xml:"name,attr"` Color string `xml:"color,attr"` Text string `xml:",chardata"` } Then we must specify the output destination for the SVG (in our example, this will be the standard output) and the size of the canvas:
var ( canvas = svg.New(os.Stdout) width = flag.Int("w", 1024, "width") height = flag.Int("h", 768, "height") ) After that, we define a function for reading incoming data:
func dothing(location string) { f, err := os.Open(location) if err != nil { fmt.Fprintf(os.Stderr, "%v\n", err) return } defer f.Close() readthing(f) } The next important step is to determine the function that is responsible for loading and analyzing incoming data. Here we will use the XML package included in the standard Go library.
func readthing(r io.Reader) { var t Thing if err := xml.NewDecoder(r).Decode(&t); err != nil { fmt.Fprintf(os.Stderr, "Unable to parse components (%v)\n", err) return } drawthing(t) } When all the data is loaded, we go through it and draw the objects. For this we use the features of the SVGo package. In our case, we set the coordinates (x, y) for each element and draw a circle that corresponds to the sizes and colors specified in the element attributes and also add text and use vertical spacing.
func drawthing(t Thing) { x := t.Left y := t.Top for _, v := range t.Item { style := fmt.Sprintf("font-size:%dpx;fill:%s", v.Width/2, v.Color) canvas.Circle(x, y, v.Height/4, "fill:"+v.Color) canvas.Text(x+t.Sep, y, v.Name+":"+v.Text+"/"+v.Color, style) y += v.Height } } Next we describe the main function of our example in which we will get the name of the file with data
func main() { flag.Parse() for _, f := range flag.Args() { canvas.Start(*width, *height) dothing(f) canvas.End() } } An example of starting our example and the results of its work:
$ go run rpd.go thing.xml <?xml version="1.0"?> <!-- Generated by SVGo --> <svg width="1024" height="768" xmlns="http://www.w3.org/2000/svg" xmlns:xlink="http://www.w3.org/1999/xlink"> <circle cx="100" cy="100" r="12" style="fill:blue"/> <text x="200" y="100" style="font-size:25px;fill:blue">Little:This is small/blue</text> <circle cx="100" cy="150" r="25" style="fill:green"/> <text x="200" y="150" style="font-size:37px;fill:green">Med:This is medium/green</text> <circle cx="100" cy="250" r="50" style="fill:red"/> <text x="200" y="250" style="font-size:50px;fill:red">Big:This is large/red</text> </svg> The finished SVG will look like this:
Using this example you can create many different visualization tools. For example, in my work, I use tools that can build simple barcharts and bullet graphs as well as more complex pie-charts and component diagrams .
You can also create images based on data from the API of any services. For example, the program “f50” takes the word and on the basis of it generates a grid of images obtained from the Flickr API. f50 uses the same approach, except that the data is not taken from a local file, but an HTTPS Flickr API request is generated.
Usage example:
f50 sunset The Flickr API returns this response:
<?xml version="1.0" encoding="utf-8" ?> <rsp stat="ok"> <photo id="15871035007" ... secret="84d59df678" server="7546" farm="8" title="flickr-gopher" ... /> <photo id="15433662714" ... secret="3b9358c61d" server="7559" farm="8" title="Laurence Maroney 2006..." ... /> ... </rsp> To create an SVG, we need the parameters id, secret, farm, server and title.
// makeURI converts the elements of a photo into a Flickr photo URI func makeURI(p Photo, imsize string) string { im := p.Id + "_" + p.Secret if len(imsize) > 0 { im += "_" + imsize } return fmt.Sprintf(urifmt, p.Farm, p.Server, im) } // imageGrid reads the response from Flickr, and creates a grid of images func imageGrid(f FlickrResp, x, y, cols, gutter int, imgsize string) { if f.Stat != "ok" { fmt.Fprintf(os.Stderr, "Status: %v\n", f.Stat) return } xpos := x for i, p := range f.Photos.Photo { if i%cols == 0 && i > 0 { xpos = x y += (imageHeight + gutter) } canvas.Link(makeURI(p, ""), p.Title) canvas.Image(xpos, y, imageWidth, imageHeight, makeURI(p, "s")) canvas.LinkEnd() xpos += (imageWidth + gutter) } } If you open the resulting SVG in the browser, then when you hover over the image you will see its title, and when you click it, you will go to the original image.
Source: https://habr.com/ru/post/247169/
All Articles