Read data with Arduino and Processing. Processing with R
(Translation from Ukrainian. Original )
Today I want to make a small review of how you can use Arduino and Processing to collect statistical data, and also process them with R.
To demonstrate the collection of statistics, I use the ultrasonic sensor HC-SR04 to record when my colleagues are in front of my desk. Some useful information on how to cross Arduino, Processing and R I took from here .
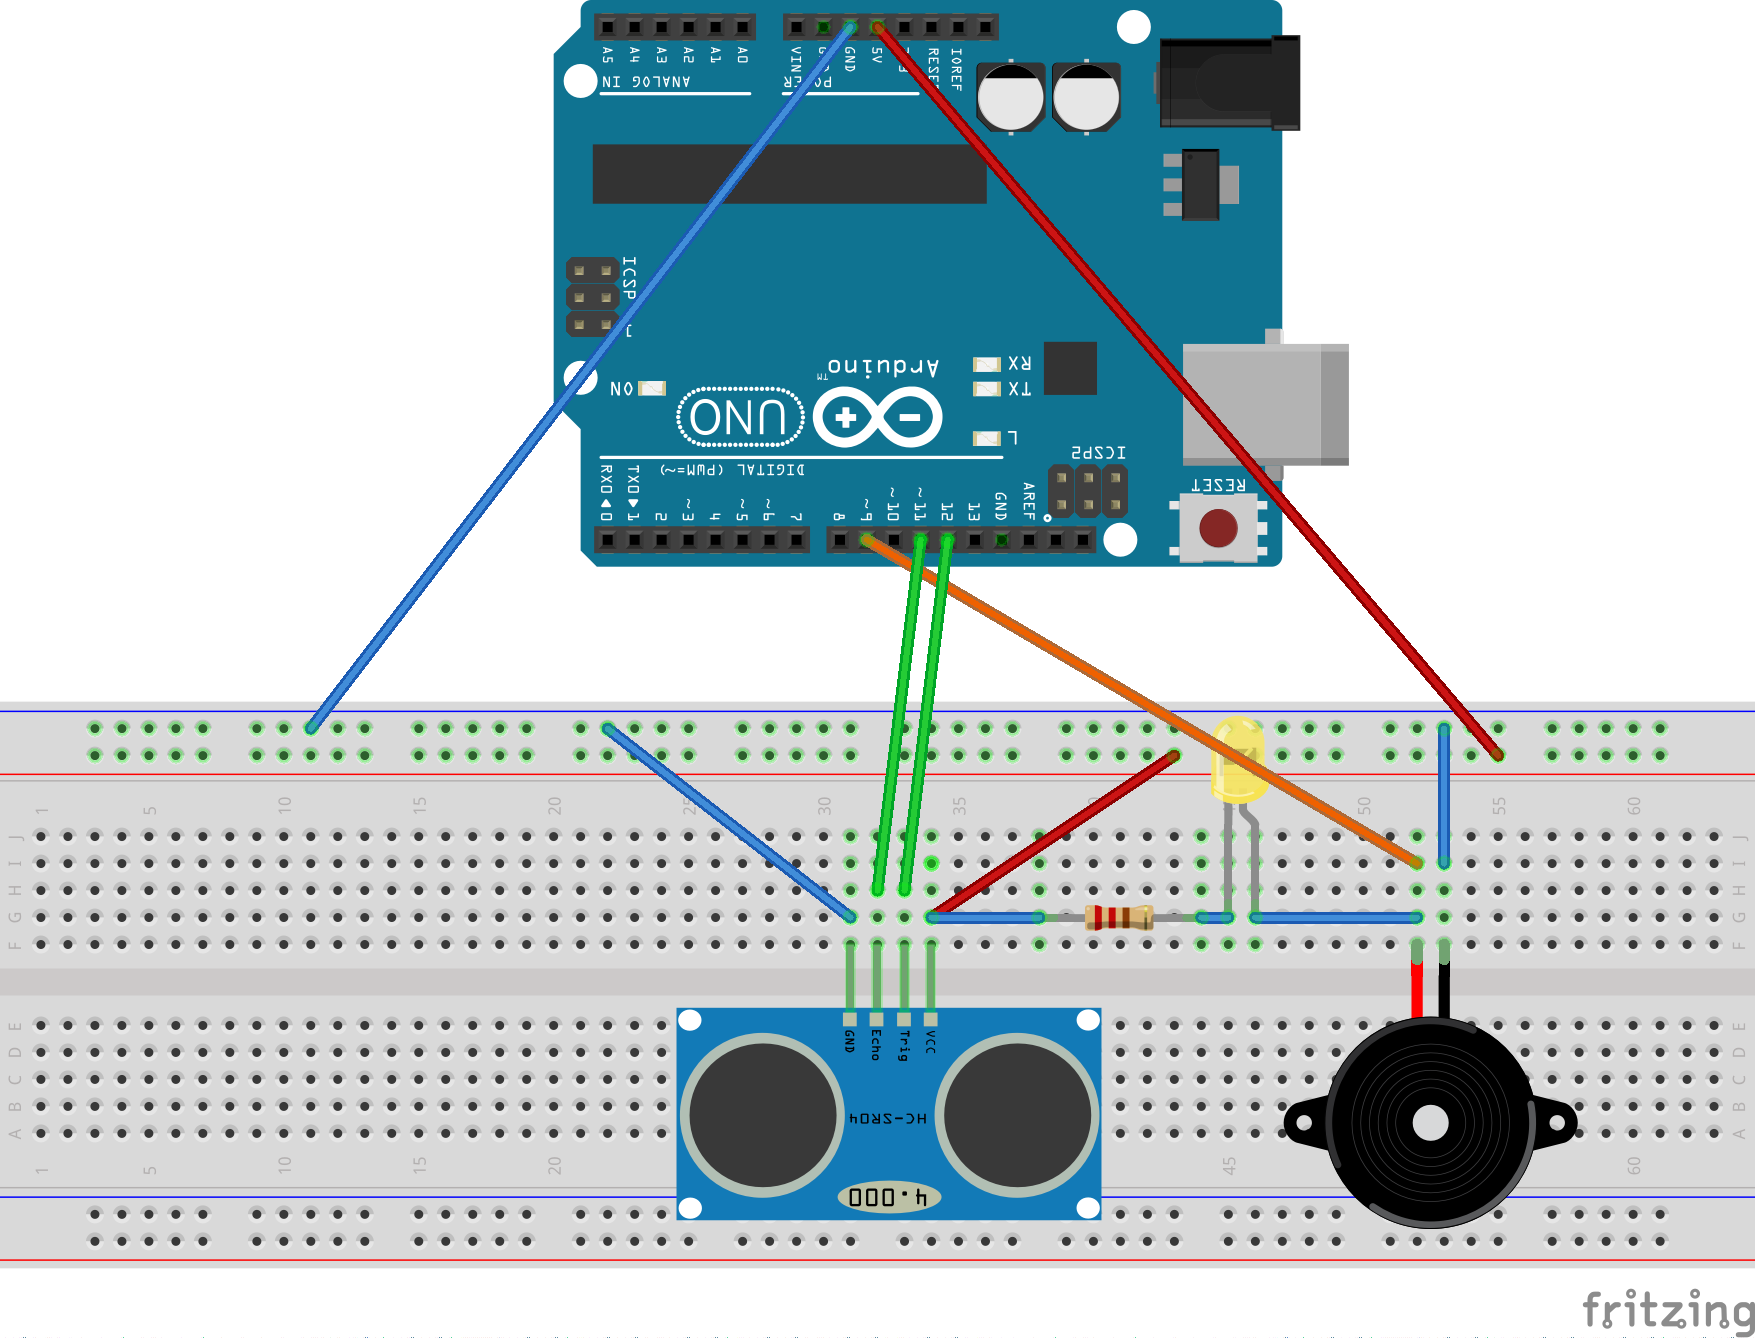
Here is the circuit for Arduino Uno
')
If someone passes in front of the table, the speaker (and the light bulb) is triggered.
Sketch for Arduino is here .
There are a few things to consider.
In this project, Processing 2, I will use exclusively for reading data from the serial port (USB) and adding them to a CSV file. You can also use Processing to visualize your data, but here I will draw graphs using R.
The Processing environment is very similar to the Arduino environment, but the language is Java-like. Universal sketch for reading data from Arduino here .
You need to run the sketch first, it will list all the available serial ports in the console, find the port on which the Arduino runs, take its serial number (the numbering starts from zero) and write it in the mySerialPort constant. Also note where the data is written.
The sketchPath function will create a path relative to the folder in which the sketch is located. If the file does not exist, it will be created, if lines are already added to it. Automatically the first element in each line of a CSV file will be the timestamp (the number of milliseconds after 1970-01-01).
For data processing and displaying graphs, I use the statistical package R.
After installing the R system, you can enter the interactive mode using the one-letter command R. (To quit inactive mode, type q () .
I wrote a small script that
To run all this, do the following:
Perhaps you noticed that the speaker emits a signal with a tone that depends on the distance from the sensor. Thus, with Arduino you can create a primitive musical instrument:
Here is a sketch reworked for this.
Happy New Year everyone!
Today I want to make a small review of how you can use Arduino and Processing to collect statistical data, and also process them with R.
To demonstrate the collection of statistics, I use the ultrasonic sensor HC-SR04 to record when my colleagues are in front of my desk. Some useful information on how to cross Arduino, Processing and R I took from here .
Arduino
Here is the circuit for Arduino Uno
')
If someone passes in front of the table, the speaker (and the light bulb) is triggered.
Sketch for Arduino is here .
There are a few things to consider.
- NewPing library is used , it needs to be installed in your Arduino environment and restart IDE
- To minimize false positives, I check for a signal several times. See the pingConfirms function. In general, the reliability of operation is still not perfect, it works several times in a single pass, it skips passes. But for our purpose it is not very important.
- Pay attention to the MAX_DISTANCE constant; it sets the maximum distance to which the sensor operates.
- The most important point: the data on the computer are transmitted through the serial port. To distinguish the debug output before the data, I display " $ data: ", I perceive this text as a marker of data that will be added to the CSV file, so if there is more than one data, you can separate them with a comma
- In our case, as a data, the distance in centimeters is transmitted, but really this value will not interest us, we will group by number
Processing
In this project, Processing 2, I will use exclusively for reading data from the serial port (USB) and adding them to a CSV file. You can also use Processing to visualize your data, but here I will draw graphs using R.
The Processing environment is very similar to the Arduino environment, but the language is Java-like. Universal sketch for reading data from Arduino here .
You need to run the sketch first, it will list all the available serial ports in the console, find the port on which the Arduino runs, take its serial number (the numbering starts from zero) and write it in the mySerialPort constant. Also note where the data is written.
String filePath = sketchPath("../../data/data.csv"); The sketchPath function will create a path relative to the folder in which the sketch is located. If the file does not exist, it will be created, if lines are already added to it. Automatically the first element in each line of a CSV file will be the timestamp (the number of milliseconds after 1970-01-01).
R
For data processing and displaying graphs, I use the statistical package R.
After installing the R system, you can enter the interactive mode using the one-letter command R. (To quit inactive mode, type q () .
I wrote a small script that
- Reads data from a CSV file into memory.
- Cuts the data of the desired time interval. To do this, adjust the startDate and endDate variables.
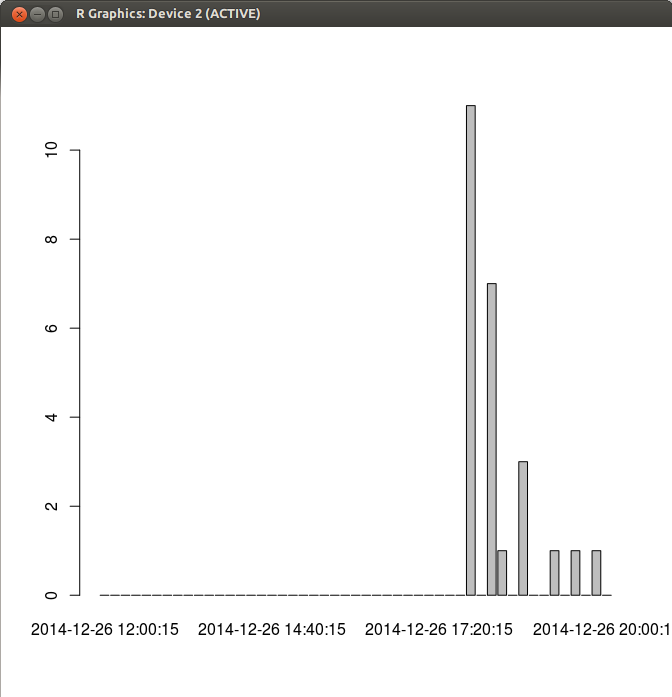
- Calculates the number of passes in each of the 10-minute intervals. You can change the interval using the period variable, it is set in seconds
- Draws a bar chart.
To run all this, do the following:
- From the console, run the command R
- Specify the path to the directory where your data.csv file is located:
setwd("/home/solvek/projects/electronics/counter/data") - Run the R script:
source("../plotchart.R")
Here is the script path relative to the above directory data.
New Year Bonus
Perhaps you noticed that the speaker emits a signal with a tone that depends on the distance from the sensor. Thus, with Arduino you can create a primitive musical instrument:
Here is a sketch reworked for this.
Happy New Year everyone!
Source: https://habr.com/ru/post/247163/
All Articles