Implementing Sunburst Chart on JavaScript and HTML5 Canvas

Hello! Today I would like to tell about how you can make your own graphics on js + canvas literally in a couple of hundred lines of code. And at the same time remember the school course of geometry.
What for
There are enough cool libraries that can build graphics in the browser. And d3js has become de facto standard. However, I needed exactly the sunburst diagram, so I didn’t want to drag tens or hundreds of kilobytes of library code behind me. There was also a need for quick work of such a diagram in mobile browsers, therefore the implementation on svg was not suitable due to the lower performance of the latter compared to the canvas. Scaling of the diagram was not provided. Also, writing such a thing is a great way to follow the path of abc .
What we visualize
Data for visualization have approximately the following format:
Sample data
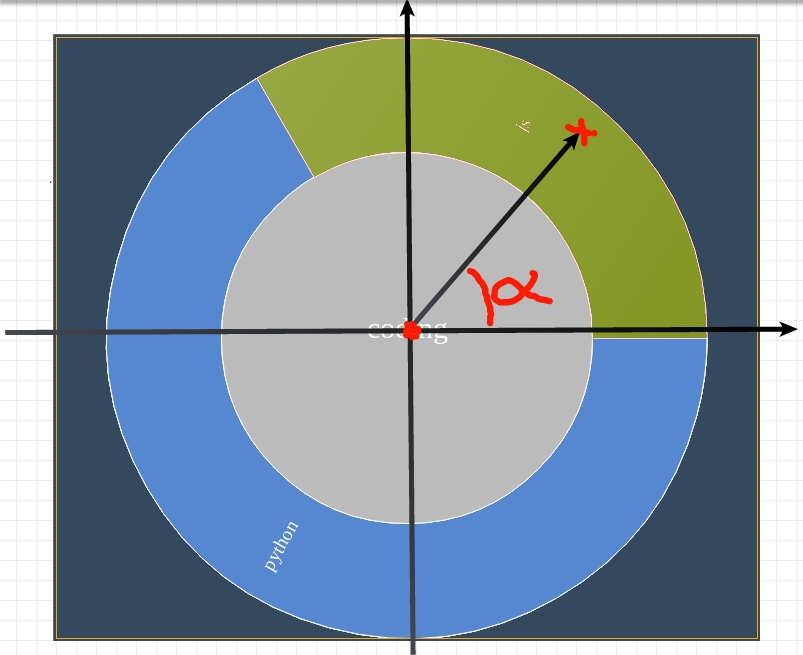
{ name: 'day', value: 24 * 60 * 60, children: [ { name: 'work', value: 9 * 60 * 60, children: [ { name: 'coding', value: 6 * 60 * 60, children: [ {name: 'python', value: 4 * 60 * 60}, {name: 'js', value: 2 * 60 * 60} ] }, {name: 'communicate', value: 1.5 * 60 * 60} ] }, {name: 'sleep', value: 7 * 60 * 60}, ... }; Those. we have a hierarchical structure, each node of which has a name and a certain value. You need to display them in something like this:
')
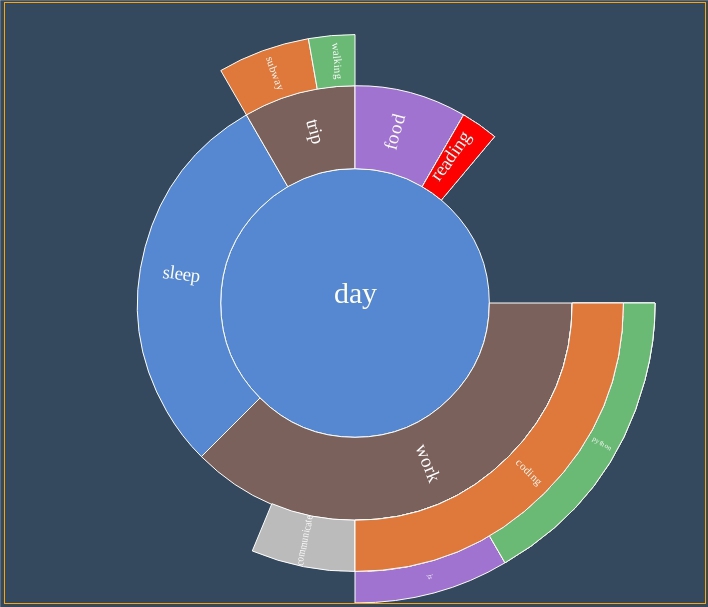
In this case, it is necessary to provide for the possibility of scaling the diagram by clicking on different areas, i.e. actually go through the data tree. As well as data editing, i.e. add and remove nodes
Opportunities
- The data should be relatively evenly spaced on the canvas, with proportions - the farther the node is from the center, the less space it should occupy.
- Clicking on a node that is not currently the root node should increase the granularity of the chart.
- A click on the central node should lead to a decrease in the granularity of the chart.
- The diagram needs to react when you hover the cursor and there are two modes for selecting nodes: a separate node and a path from the center of the diagram to the selected node.
As a result, I would like to get some hybrid of this and that .
Implementation
Data location
In order to evenly distribute the data on the canvas, it is necessary to first find out their maximum nesting. This is fairly easy to do with the following recursive function:
function maxDeep(data) { var deeps = []; for (var i = 0, l = (data.children || []).length; i < l; i++) { deeps.push(maxDeep(data.children[i])); } return 1 + Math.max.apply(Math, deeps.length ? deeps : [0]); }; The depth of nesting of the data determines the number of layers (rings) in the chart. All rings in the amount should occupy min (canvas.width, canvas.height) . The reduction of the width of the rings from the center (maximum size) to the edges of the canvas (minimum size) occurs according to the rule of the golden section. Each subsequent ring is 1.62 times thinner than the previous one. Thus, we have a recurrent expression:
x + x / 1.62 + x / (1.62^2) + ... + x / (1,62^(n-1)) = min(canvas.width, canvas.height) where n is the number of layers, and x is the thickness of the root node. Thus, x can be easily found using the following function:
function rootNodeWidth(n, canvasWidth, canvasHeight) { var canvasSize = Math.min(canvasWidth, canvasHeight), div = 1; for (var i = 1; i < n; i++) { div += 1 / Math.pow(1.62, i); } return canvasSize / 2 / div; // 2 , . }; Further, when drawing the diagram, we simply divide the thickness of the current layer by 1.62 to get the thickness of the next one.
Chart nodes visualization
Before proceeding directly with the drawing of nodes, it is necessary to perform some calculations. In particular, it is necessary to calculate the height of each of the nodes, determine the length of the node, the start angle and assign a color.
About the definition of height has already been written above. The angles are calculated as follows: the central node is a circle, i.e. the angle between its lateral components is 360 degrees (2 Pi radians) and they merge into one line (we do not visualize it). The thickness of the central node is the radius of this circle.
All subsequent nodes are arcs wrapped around a central node.
Nodes of the first (not central) level.
The length of the arc (ie, the angle between its side components) is calculated based on the ratio of the data value (value), which correspond to this arc and the value of the data of the parent node for this arc. Thus, if the central node has the value value = 100, and the node of the first level nested in it has value = 50, then the angle of the latter will be 180 degrees (50/100 = Pi / 2 Pi). This rule is recursively applied to each of the nodes with respect to its parent. If a node has 2 or more heirs, then the maximum angle of its first heir will be the minimum angle of the second, and so on. All calculations are clockwise.
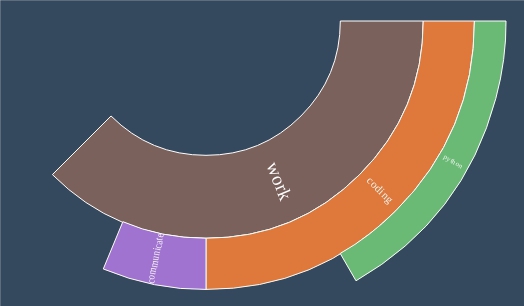
The ratio of the lengths of the arc nodes and value.
The color of the nodes is assigned sequentially from the set available. The above calculations can be performed by the following function:
function calcMetaData(dataRootNode, rootNodeWidth) { var startWidth = rootNodeWidth, meta = { root: { data: dataRootNode, color: pickColor(), angles: {begin: 0, end: 2 * Math.PI, abs: 2 * Math.PI}, // - width: startWidth, offset: 0, children: [], scale: 1 } }, sibling; function calcChildMetaData(childDatum, parentMeta, sibling, scale) { var meta = { data: childDatum, color: pickColor(), parent: parentMeta, width: parentMeta.width / scale, offset: parentMeta.offset + parentMeta.width, children: [], scale: parentMeta.scale / scale }, childSibling; meta.angles = {abs: parentMeta.angles.abs * childDatum.value / parentMeta.data.value}; meta.angles.begin = sibling ? sibling.angles.end : parentMeta.angles.begin; meta.angles.end = meta.angles.begin + meta.angles.abs; for (var i = 0, l = (childDatum.children || []).length; i < l; i++) { childSibling = calcChildMetaData(childDatum.children[i], meta, childSibling, scale); meta.children.push(childSibling); } return meta; } for (var i = 0, l = (dataRootNode.children || []).length; i < l; i++) { if (dataRootNode.children[i].value > dataRootNode.value) { console.error('Child value greater than parent value.', dataRootNode.children[i], dataRootNode); continue; } sibling = calcChildMetaData(dataRootNode.children[i], meta.root, sibling, 1.62); meta.root.children.push(sibling); } return meta; }; Drawing the center node is easiest. To do this, you need to make a closed arc using the arc () function, and then fill it with color.
var nodeMeta = {width: 20px, color: 'green', angles: {begin: 0, end: 2 * Math.PI}}; // var origin = {x: 250, y: 250}; // var ctx = canvas.getContext('2d'); function drawRootNodeBody(nodeMeta, origin, ctx) { ctx.beginPath(); ctx.arc(origin.x, origin.y, nodeMeta.width, nodeMeta.angles.begin, nodeMeta.angles.end); // ctx.fillStyle = nodeMeta.color; // - ctx.fill(); ctx.strokeStyle = 'white'; // - ctx.stroke(); } The remaining nodes draw a little more interesting. In fact, you need to draw a closed path of the desired shape, and then fill it with color.
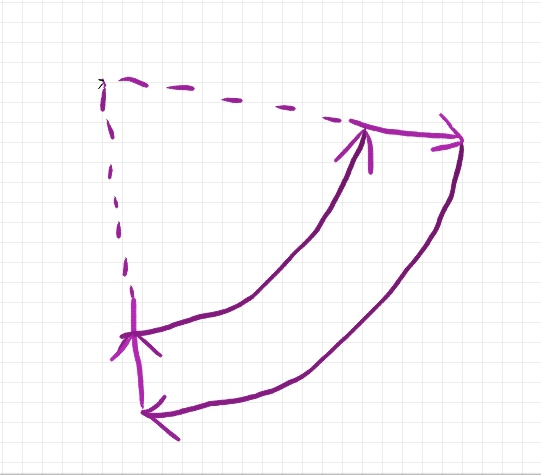
The path to the canvas that forms the node.
The sequence of drawing plots is indicated by arrows. Which side to start drawing does not matter. We will start with the outer arc. The function of drawing off-center nodes:
function drawChildNodeBody(nodeMeta, origin, ctx) { ctx.beginPath(); ctx.arc(origin.x, origin.y, nodeMeta.offset, nodeMeta.angles.begin, nodeMeta.angles.end); // // ctx.save(); ctx.translate(origin.x, origin.y); // ctx.rotate(nodeMeta.angles.end); // , // ctx.lineTo(nodeMeta.offset + nodeMeta.width, 0); ctx.restore(); // // ctx.arc(origin.x, origin.y, nodeMeta.offset + nodeMeta.width, nodeMeta.angles.end, nodeMeta.angles.begin, true); // - . ctx.closePath(); ctx.fillStyle = nodeMeta.hover ? 'red' : nodeMeta.color; ctx.fill(); ctx.strokeStyle = 'white'; ctx.stroke(); } Instead of turning the context to draw one of the side arcs, you could use Math.sin () (or Math.cos ()) of the angle between the vertical (or horizontal) and the angle of rotation of the side component of the node. True, thanks to the rotation of the canvas, the code is greatly simplified. I wonder how this moment affects the rendering performance.
Definition of a node of the diagram for the given coordinates
In order to further implement the scaling of the diagram by clicking (or clicking) and hover nodes, you need to learn how to determine the node of the diagram by coordinates on the canvas. This is easy to do using the transition from Cartesian to polar coordinate system.
First, we define the distance from the center of the chart (calculated before the start of rendering) to the point of the click (coordinates are known from the onclick event object) and the angle between the X axis and the segment connecting the center of the chart and this point.
For this we need the following function:
function cartesianCoordsToPolarCoords(point, origin) { var difX = point.x - origin.x, difY = point.y - origin.y, distance = Math.sqrt(difX * difX + difY * difY), angle = Math.acos(difX / distance); if (difY < 0) { angle = 2 * Math.PI - angle; } return {dist: distance, angle: angle}; }; Now, if we recall that we have previously done calculations of some metadata about each node, and they include the level width, the start angle and the length of each of the node arcs, you can find the node under the pointer in its polar coordinates in a very simple way:
function getNodeByPolarCoords(point, origin, metaData) { function _findNode(point, nodeMeta) { // if (nodeMeta.offset >= point.dist) { // , distance, // , . return null; } if (nodeMeta.offset < point.dist && point.dist <= nodeMeta.offset + nodeMeta.width) { // , . if (nodeMeta.angles.begin < point.angle && point.angle <= nodeMeta.angles.end) { return nodeMeta; } } else { // We need to go deeper. . var node; for (var i = 0, l = (nodeMeta.children || []).length; i < l; i++) { if (node = _findNode(point, nodeMeta.children[i])) { return node; } } } return null; } return _findNode(point, metaData.root); }; Change Chart Detail
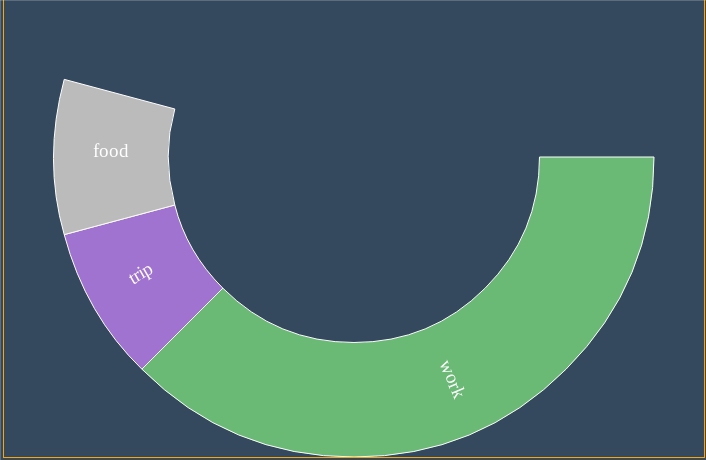
For a more detailed examination of the nodes located along the edges of the diagram, it is necessary to implement scaling by clicking on the node. In fact, this script is equivalent to re-drawing the diagram, but the one that was clicked should be selected as the root data node. Similarly, when clicking on the central node, it is enough to find its ancestor in the data structure, and, if it exists, draw the diagram by selecting the latter as the root node. Reuse code 100%.
Conclusion
Implementing graphics on js + canvas actually turned out not to be such a difficult task. It is enough to draw a little with a
A working example can be viewed on imtqy.com .
The code is available in the repository on github.
Source: https://habr.com/ru/post/246909/
All Articles