Top 15 JavaScript Libraries for Building Diagrams and Pivot Tables
It is almost impossible to imagine an information panel without charts and graphs. They quickly and efficiently display complex statistics. Moreover, a good chart also improves the overall design of your site.
In this article, I will show you some of the best JavaScript libraries for building diagrams / charts (and pivot tables). These libraries will help you in creating beautiful and customizable graphs for your future projects.
Although most libraries are free and freely available, some of them have paid versions with additional functionality.
')
Today, when we think about charts, the first thing that comes to mind is D3.js. As an open source project, D3.js, without a doubt, presents many useful features that most existing libraries lack. Features such as “Enter and Exit”, powerful transitions, and syntax similar to jQuery or Prototype, make it one of the best JavaScript libraries for creating graphs and charts. In D3.js, they are generated via HTML, SVG, and CSS.
Unlike many other JavaScript libraries, D3.js does not come with pre-created graphics right out of the box. However, you can take a look at the list of graphs created on D3.js to get a general idea.
D3.js does not work properly with older browsers, such as IE8. But you can always use such plugins as aight plug-in for cross-browser compatibility.
D3.js was previously widely used on websites like NYTimes , Uber and Weather.com
Google Charts is a JavaScript library that I regularly use to create graphs that are simple and easy. Provides many pre-created charts, such as combined histograms, bar charts, time schedules, pie charts, geo charts, and more.
Google charts also have many configuration settings that help to change the appearance of the chart. Graphics are generated using HTML5 / SVG mining to provide cross-browser compatibility and cross-platform portability on the iPhone, iPad and Android. Also contains VML to support older IE versions.
Here is a wonderful list with examples built on Google charts.
ChartJS endows graphics with a beautiful flat design. It uses HTML5 canvas for rendering. Support for older browsers, such as IE7 / 8, is added using a polyfill.
ChartJS graphics are responsive by default. They work great on mobile devices and tablets. Thanks to the 6 main types of graphs out of the box (core, columnar, circular, petal, line, and polar), ChartJS is definitely one of the most impressive open source libraries for building graphs and diagrams lately.
Chartlist.js provides beautiful responsive graphics. Like ChartJS, Chartlist.js is the result of community work, which has become disillusioned with expensive JavaScript diagram libraries. It uses SVG to render graphs / charts. It can be managed and configured via CSS3 media queries and Sass. Also, please note that the wonderful animation provided by Chartlist.js will only work in modern browsers.
If you are an AngularJS developer, then n3-charts will definitely seem extremely useful and interesting to you. n3-charts is built on top of D3.js and AngularJS. It provides many standard graphs in the form of customized AngularJS directives.
Check out the list of graphs created with n3-charts.
EmberCharts is another great open source repository built on D3.js and Ember.js Provides easily customizable time series charts, histograms, pie charts and scatter diagrams. Uses SVG to render graphs.

If you are dealing with a real-time data stream, then Smoothie Charts may be useful to you. For rendering graphics, the HTML5 canvas element is used here. This is a pure JavaScript library that provides such optional features for real-time graphics as delay and flash color.

Chartkick is a JavaScript library for building graphs / charts in Ruby applications. Provides all major chart types, such as pie, bar, histogram, combined histogram, geo, time, and multiple series chart. Charts are generated via SVG.
Have you tried to work with Meteor v 1.0 yet? Ok, MeteorCharts will help you in creating beautiful diagrams for Meteor applications. For rendering graphics, you can choose from any of these technologies: HTML5 canvas, WebGL, SVG, and even DOM.
This is a great graph generator that allows you to select its type, theme, and then perform the generation. Free for use in non-commercial projects. Calculate the cost of a commercial license here .
Highcharts JS is another very popular charting library. It is completed with a large number of various types of animation that can attract a lot of attention to your site. Like other libraries, HighchartsJS contains many previously created charts: spline, shape, combined, bar, histograms, pie, scatter, etc.
One of the biggest advantages of using HighchartsJS is compatibility with older browsers, such as Internet Explorer 6. Standard browsers use SVG for graph rendering. In outdated IE, graphics are built via VML.
Although HighchartsJS is free for personal use, you need to purchase a license for commercial use.
Fusioncharts is one of the oldest JavaScript libraries that was first released in 2002. Graphics are generated via HTML5 / SVG and VML for better portability and compatibility.
Unlike many libraries, Fusioncharts provides the ability to parse both JSON data and XML. You can also export these graphics in 3 different formats: PNG, JPG and PDF.
Fusioncharts is well compatible with older browsers, such as IE6. And for this reason, it has become one of the most preferred libraries in a variety of trade organizations.
You can use the watermark version of Fusioncharts for free in both personal and commercial projects. However, you need to purchase a license to get rid of the watermark.
Flot is a jQuery javascript library that allows you to create graphs / charts. One of the oldest and most popular chart libraries.
Flot supports bar, point, bar, column, and any combination of these kinds of diagrams. Also compatible with older browsers such as IE 6 and Firefox 2.
Flot is completely free, commercial support is available on special request to the developer. Here is a list of examples with graphs created on Flot.
amCharts is undoubtedly one of the most beautiful chart libraries. It is fully divided into 3 independent types: JavaScript Charts, Maps Charts (amMaps) and Stock charts.
amMaps is my favorite of the three above. Provides features such as heatmaps, drawing lines, adding text to a map, loading icons or photos to the top of your map, zooming, etc.
amCharts uses SVG for graphics rendering that works only in modern browsers. Charts may not display correctly in IE below version 9.
Check out this fantastic collection of great demos created on amCharts.
The free version of amCharts will link back to this website at the top of each chart. Commercial licenses are slightly more expensive than most paid libraries on the market.
EJS Chart declares its practical solution for businesses. Graphs look neater and more readable than most of the other older libraries. There is also compatibility with IE6 + and other older browsers. Check out this list of examples .
EJS Chart is available in free and paid versions. The free version has a limitation that prevents you from using more than 1 graphic per page and more than two (numeric) sequences on the graphic. Read pricing details here .
uvCharts is an open source JavaScript library that claims that there are more than 100 configuration options. She has graphics of 12 different standards right out of the box.
uvCharts is built on the D3.js library. This project promises to eliminate all the complex nuances of D3.js coding and ensure easy implementation of standard-type graphs. uvCharts is generated by SVG, HTML and CSS.
Now the choice of the best diagram library for your future projects remains only for you. Developers who need full control over graphics will definitely choose D3.js. Virtually all of the above libraries have gotten good support on the Stackoverflow forums.
If you are looking for tools to generate ready-made graphs, then go to article 5 of the Tools For Creating Amazing Online Charts . You can also read Creating Simple Linear and Column Charts with D3.js , in order to start exploring D3.js. We also have editions on GoogleCharts with AngularJS .
Hope you enjoyed this article. Have a nice day.
In this article, I will show you some of the best JavaScript libraries for building diagrams / charts (and pivot tables). These libraries will help you in creating beautiful and customizable graphs for your future projects.
Although most libraries are free and freely available, some of them have paid versions with additional functionality.
')
D3.js - data oriented documents
Today, when we think about charts, the first thing that comes to mind is D3.js. As an open source project, D3.js, without a doubt, presents many useful features that most existing libraries lack. Features such as “Enter and Exit”, powerful transitions, and syntax similar to jQuery or Prototype, make it one of the best JavaScript libraries for creating graphs and charts. In D3.js, they are generated via HTML, SVG, and CSS.
Unlike many other JavaScript libraries, D3.js does not come with pre-created graphics right out of the box. However, you can take a look at the list of graphs created on D3.js to get a general idea.
D3.js does not work properly with older browsers, such as IE8. But you can always use such plugins as aight plug-in for cross-browser compatibility.
D3.js was previously widely used on websites like NYTimes , Uber and Weather.com
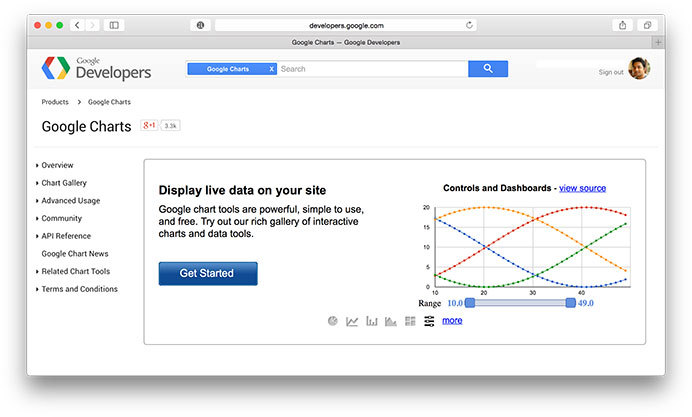
Google charts
Google Charts is a JavaScript library that I regularly use to create graphs that are simple and easy. Provides many pre-created charts, such as combined histograms, bar charts, time schedules, pie charts, geo charts, and more.
Google charts also have many configuration settings that help to change the appearance of the chart. Graphics are generated using HTML5 / SVG mining to provide cross-browser compatibility and cross-platform portability on the iPhone, iPad and Android. Also contains VML to support older IE versions.
Here is a wonderful list with examples built on Google charts.
Chartjs
ChartJS endows graphics with a beautiful flat design. It uses HTML5 canvas for rendering. Support for older browsers, such as IE7 / 8, is added using a polyfill.
ChartJS graphics are responsive by default. They work great on mobile devices and tablets. Thanks to the 6 main types of graphs out of the box (core, columnar, circular, petal, line, and polar), ChartJS is definitely one of the most impressive open source libraries for building graphs and diagrams lately.
Chartlist.js
Chartlist.js provides beautiful responsive graphics. Like ChartJS, Chartlist.js is the result of community work, which has become disillusioned with expensive JavaScript diagram libraries. It uses SVG to render graphs / charts. It can be managed and configured via CSS3 media queries and Sass. Also, please note that the wonderful animation provided by Chartlist.js will only work in modern browsers.
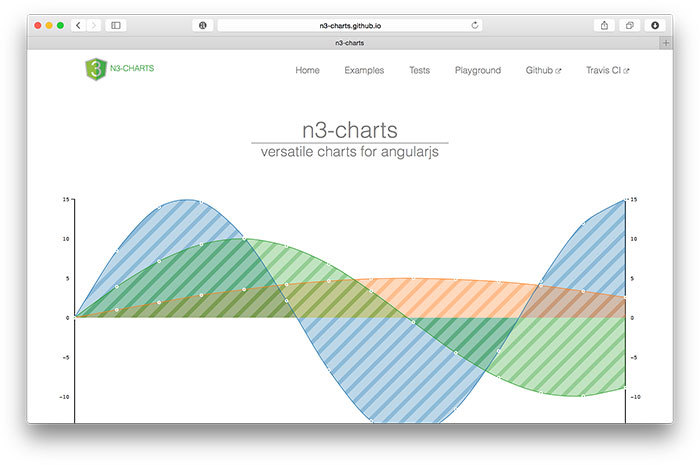
n3-charts
If you are an AngularJS developer, then n3-charts will definitely seem extremely useful and interesting to you. n3-charts is built on top of D3.js and AngularJS. It provides many standard graphs in the form of customized AngularJS directives.
Check out the list of graphs created with n3-charts.
Ember charts
EmberCharts is another great open source repository built on D3.js and Ember.js Provides easily customizable time series charts, histograms, pie charts and scatter diagrams. Uses SVG to render graphs.
Smoothie charts
If you are dealing with a real-time data stream, then Smoothie Charts may be useful to you. For rendering graphics, the HTML5 canvas element is used here. This is a pure JavaScript library that provides such optional features for real-time graphics as delay and flash color.
Chartkick
Chartkick is a JavaScript library for building graphs / charts in Ruby applications. Provides all major chart types, such as pie, bar, histogram, combined histogram, geo, time, and multiple series chart. Charts are generated via SVG.
MeteorCharts
Have you tried to work with Meteor v 1.0 yet? Ok, MeteorCharts will help you in creating beautiful diagrams for Meteor applications. For rendering graphics, you can choose from any of these technologies: HTML5 canvas, WebGL, SVG, and even DOM.
This is a great graph generator that allows you to select its type, theme, and then perform the generation. Free for use in non-commercial projects. Calculate the cost of a commercial license here .
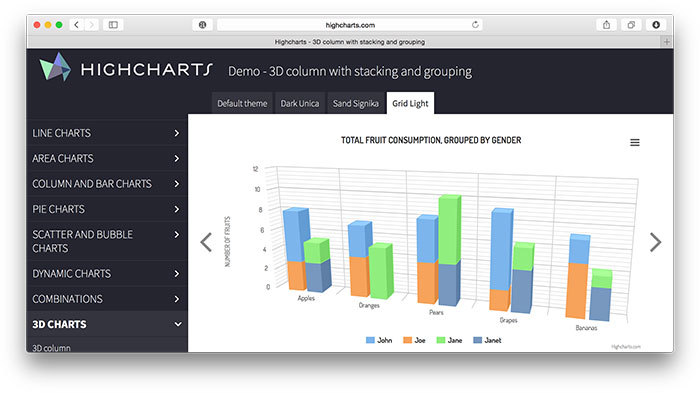
Highcharts JS
Highcharts JS is another very popular charting library. It is completed with a large number of various types of animation that can attract a lot of attention to your site. Like other libraries, HighchartsJS contains many previously created charts: spline, shape, combined, bar, histograms, pie, scatter, etc.
One of the biggest advantages of using HighchartsJS is compatibility with older browsers, such as Internet Explorer 6. Standard browsers use SVG for graph rendering. In outdated IE, graphics are built via VML.
Although HighchartsJS is free for personal use, you need to purchase a license for commercial use.
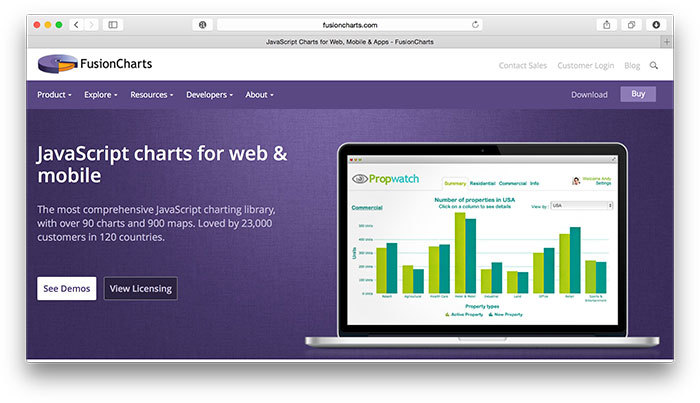
Fusioncharts
Fusioncharts is one of the oldest JavaScript libraries that was first released in 2002. Graphics are generated via HTML5 / SVG and VML for better portability and compatibility.
Unlike many libraries, Fusioncharts provides the ability to parse both JSON data and XML. You can also export these graphics in 3 different formats: PNG, JPG and PDF.
Fusioncharts is well compatible with older browsers, such as IE6. And for this reason, it has become one of the most preferred libraries in a variety of trade organizations.
You can use the watermark version of Fusioncharts for free in both personal and commercial projects. However, you need to purchase a license to get rid of the watermark.
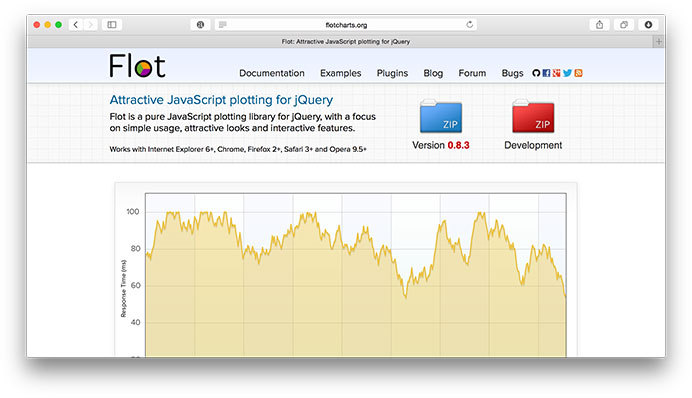
Flot
Flot is a jQuery javascript library that allows you to create graphs / charts. One of the oldest and most popular chart libraries.
Flot supports bar, point, bar, column, and any combination of these kinds of diagrams. Also compatible with older browsers such as IE 6 and Firefox 2.
Flot is completely free, commercial support is available on special request to the developer. Here is a list of examples with graphs created on Flot.
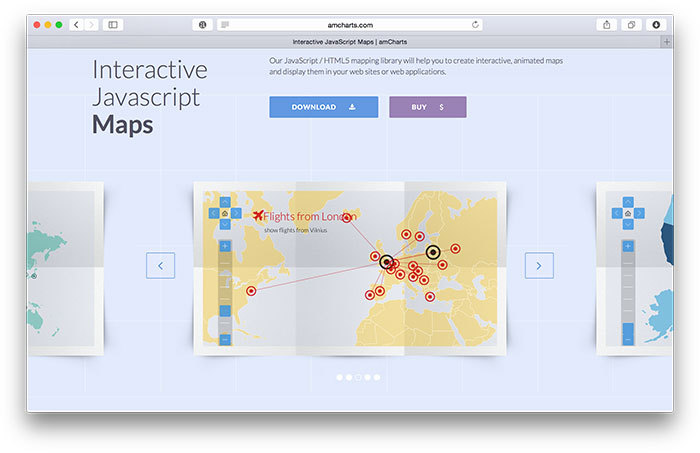
amCharts
amCharts is undoubtedly one of the most beautiful chart libraries. It is fully divided into 3 independent types: JavaScript Charts, Maps Charts (amMaps) and Stock charts.
amMaps is my favorite of the three above. Provides features such as heatmaps, drawing lines, adding text to a map, loading icons or photos to the top of your map, zooming, etc.
amCharts uses SVG for graphics rendering that works only in modern browsers. Charts may not display correctly in IE below version 9.
Check out this fantastic collection of great demos created on amCharts.
The free version of amCharts will link back to this website at the top of each chart. Commercial licenses are slightly more expensive than most paid libraries on the market.
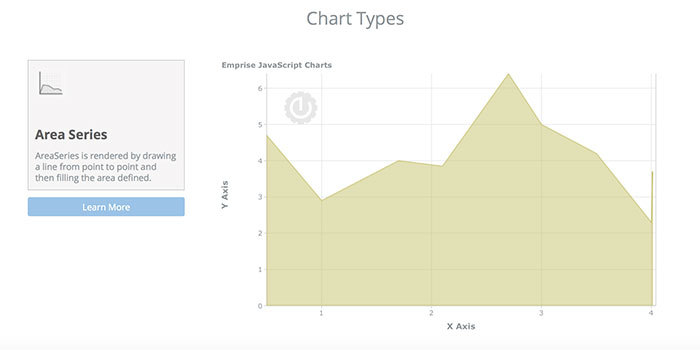
EJSChart
EJS Chart declares its practical solution for businesses. Graphs look neater and more readable than most of the other older libraries. There is also compatibility with IE6 + and other older browsers. Check out this list of examples .
EJS Chart is available in free and paid versions. The free version has a limitation that prevents you from using more than 1 graphic per page and more than two (numeric) sequences on the graphic. Read pricing details here .
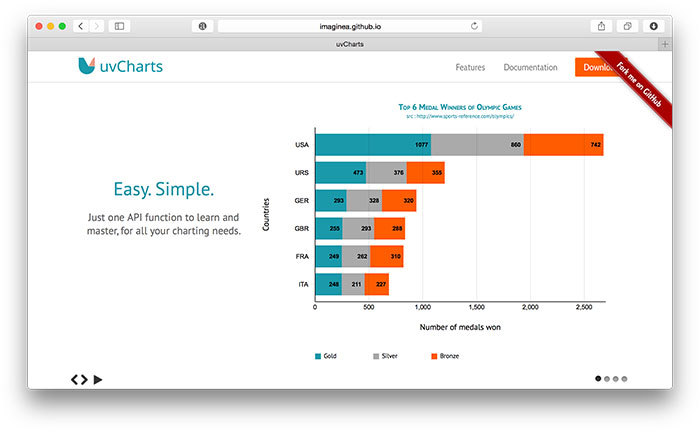
uvCharts
uvCharts is an open source JavaScript library that claims that there are more than 100 configuration options. She has graphics of 12 different standards right out of the box.
uvCharts is built on the D3.js library. This project promises to eliminate all the complex nuances of D3.js coding and ensure easy implementation of standard-type graphs. uvCharts is generated by SVG, HTML and CSS.
Conclusion
Now the choice of the best diagram library for your future projects remains only for you. Developers who need full control over graphics will definitely choose D3.js. Virtually all of the above libraries have gotten good support on the Stackoverflow forums.
If you are looking for tools to generate ready-made graphs, then go to article 5 of the Tools For Creating Amazing Online Charts . You can also read Creating Simple Linear and Column Charts with D3.js , in order to start exploring D3.js. We also have editions on GoogleCharts with AngularJS .
Hope you enjoyed this article. Have a nice day.
Source: https://habr.com/ru/post/246907/
All Articles