How to make an analysis of a landing page in 10 minutes and return 1000 buyers. Part 1
Let's start without preludes.
1) Measure the total Landing conversion.
2) Measure the conversion of each target page button.
3) Learn the effectiveness of the promotion channels in terms of conversion to purchase.
4) Make an e-mail list to those who have not completed the purchase.
')
To begin, analyze the page: novogodnee-chudo.ru . It has 6 target buttons.

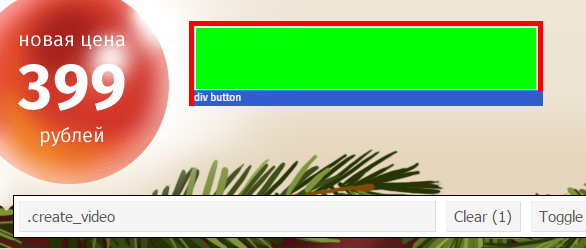
We need to connect to each button to collect data by clicking on them.
We have already installed the carrot quest service code on the site and now run the selectorGadget extension. We define the selector of each button.
Next, create an auto-event for clicking on each button.

In the field “Made action” we indicate the type of action “Click”. In the CSS selector field, select the desired button selector. Create 6 such auto events.
After 2 minutes, we know who exactly pressed each button.
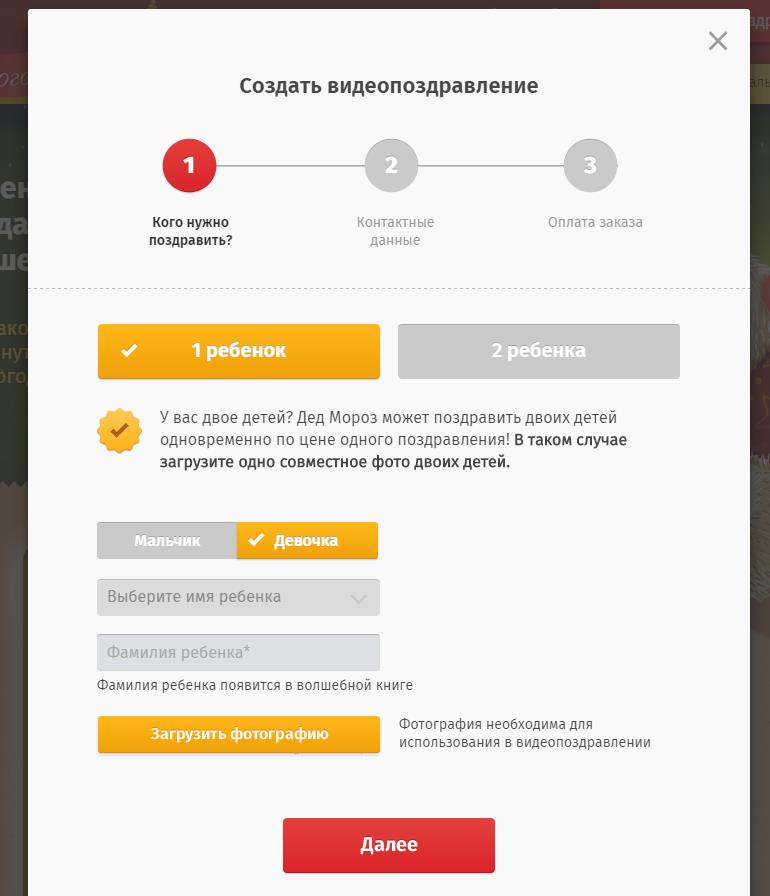
After clicking on any of the target buttons on the landing page, a form appears with three steps of buying a New Year greeting.
Along the way, connect to the "Next" button. Similarly, create an auto event to track clicking this button.
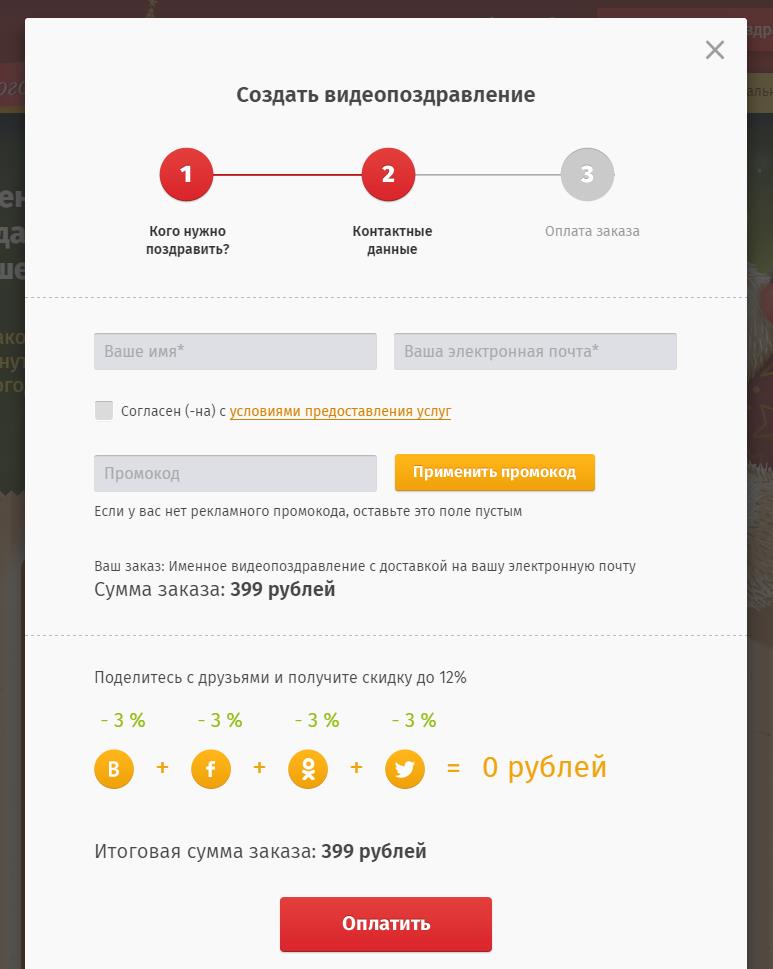
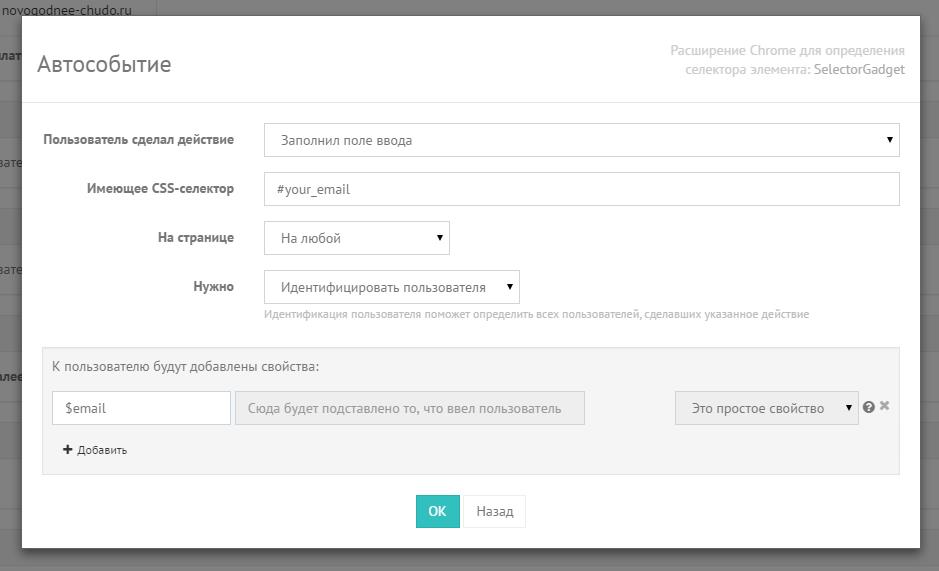
In the second step, you need to fill in the customer name and email address.
We collect them using the Autogrowth “Filled in the input field”. Run selectorgatget and get the “your email” field selector. Now what the user enters in this field is automatically recorded in the carrotquest service.
And we need this e-mail to be registered in the properties of this user for further e-mail distribution and communication with this user. Therefore, we specify "Identify the user" and in the additional properties we enter $ email (this is our variable).
Go ahead.
In the second step, there is a “Pay” button. We could get the data on the click on this button in the same way as in step 1. Then we would know if the user clicked on it or not. But we need a little more - we need to know whether he transferred to the payment. Some users click on the "Pay" button without filling in the required fields. And this blurs the statistics. Therefore, we just need to go to the payment page. Therefore, we will use the API and trace not the click on the button, but the sending of data to the robokassa. Something like this:
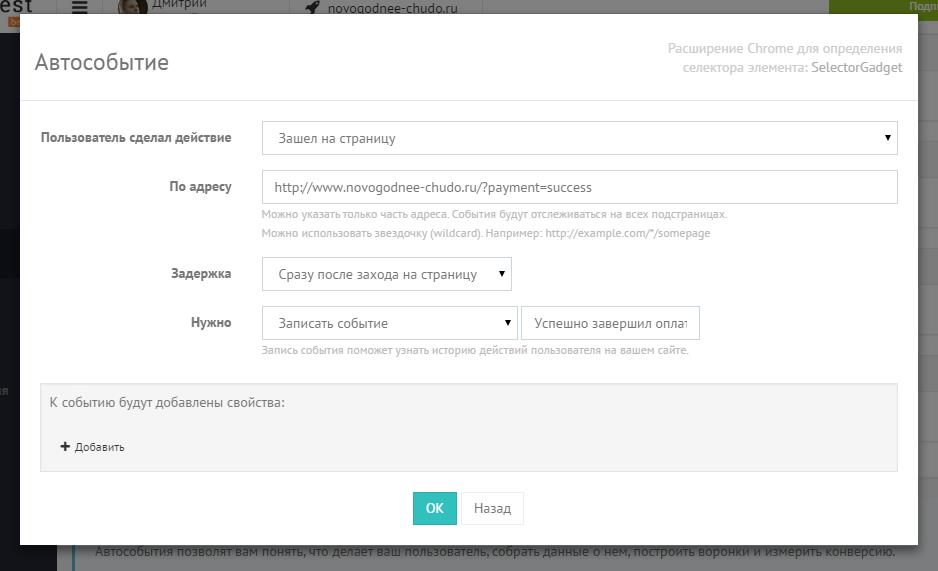
The next funnel step is the success page. We track it very easily:
We make the auto event of the type "went to the page" and indicate the address of the page.
Actually this is all that we needed to do to configure. We proceed to the next part: analysis and marketing.
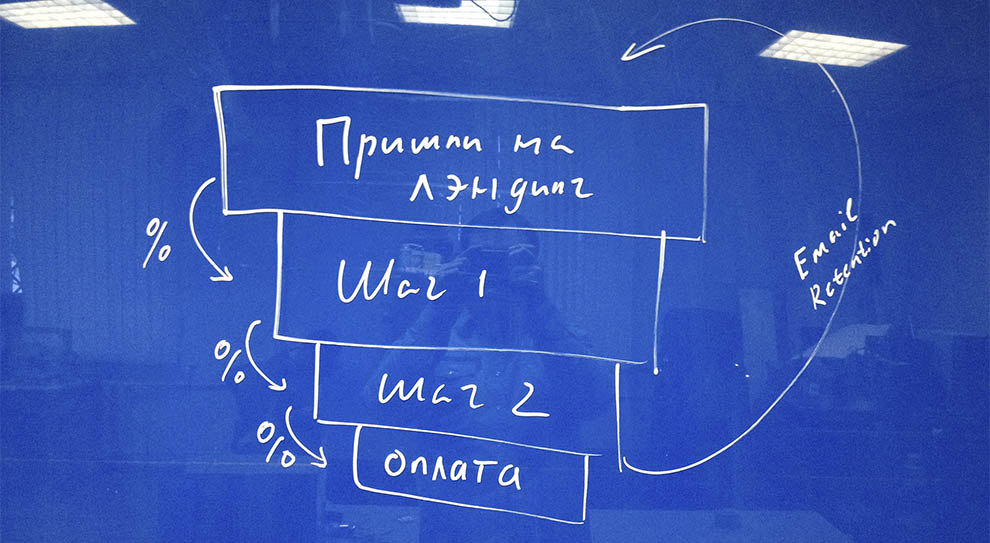
The task was to analyze the overall conversion of the landing page and see at which step the users “disappear” the most, and from which channels the highest conversion. For obvious reasons, we cannot show specific figures, but here’s an approximate picture for the day:

In general, the transitions between 1, 2 steps and the transition to the payment page have a normal conversion. But at the payment step, quite a lot of users fall off. So e-mail marketing is relevant and it is worth trying to return these users. At the very least, it is worth asking why they did not pay. Maybe the problem is in the method of payment?
Unfortunately, we also cannot show the promotion channels: ((You can tell the following: we saw from which channels the most traffic and conversion of each channel goes. Also, we looked at the effectiveness of advertising campaigns in directo.
As a result, they found out that there are a couple of advertising companies in which it is meaningless to invest money, and there are channels that give a big conversion. Budget allocation will instantly reduce costs and increase sales.
Here are the funnels on three of the six buttons:
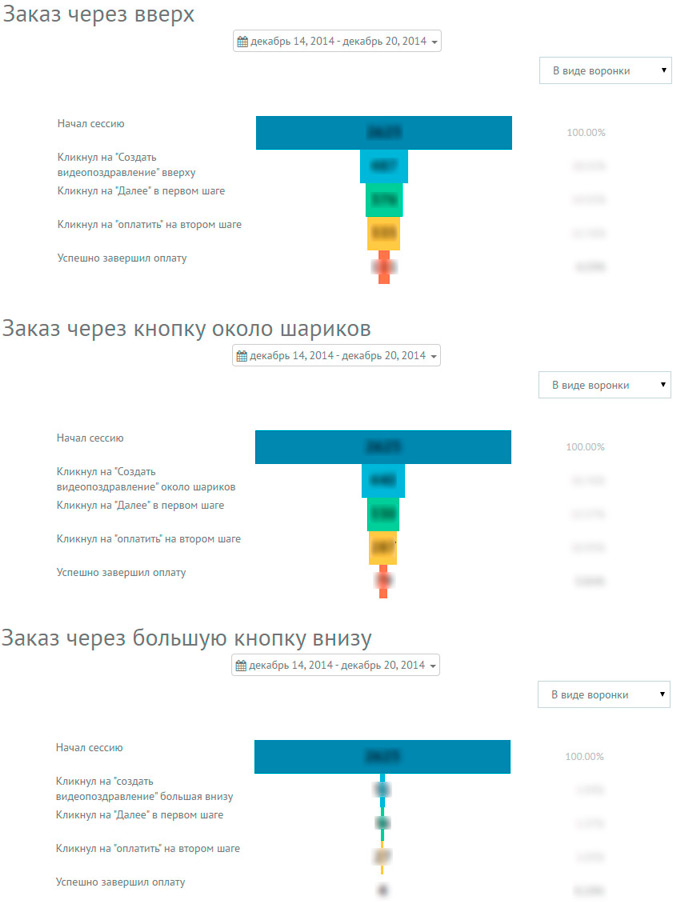
Even without exact numbers, it can be seen that the number of buyers from the top button is higher. And on the target button in the footer there are almost none. But this is not quite correct comparison. After all, it is clear that more visitors will click on the upper button. First, it is on the first screen. Secondly - it goes for the user.
It is more interesting what the conversion is among those who clicked the button and moved to the second step. What happens next there. What percentage of them turn into buyers. We look.

No, the miracle did not happen. Of those who pressed the top button, the percentage paid for more. Although it is strange, because if you screwed to the end of the page, you looked at everything and more “activated”.
In general, we obtained interesting data for further analysis. You can do AB test of the upper button to increase the conversion of the transition to the second step.
You can change the content of the page under the channel, to increase the effectiveness of each channel.
But it is in the future. Let's move on to marketing.
Task: return the users who clicked the "Pay" button but did not pay. They were ready to buy, but something stopped them at the last moment.
To begin, select a segment with these users.

These are the users who in the second step clicked "Pay", but did not get to the page "Successful payment". We have already set up tracking of all these events above.
Highlighting a segment with these users, we see that they are very um ... not a few. We can not show the exact figure. We will only say that there are significantly more than 1000 of them.
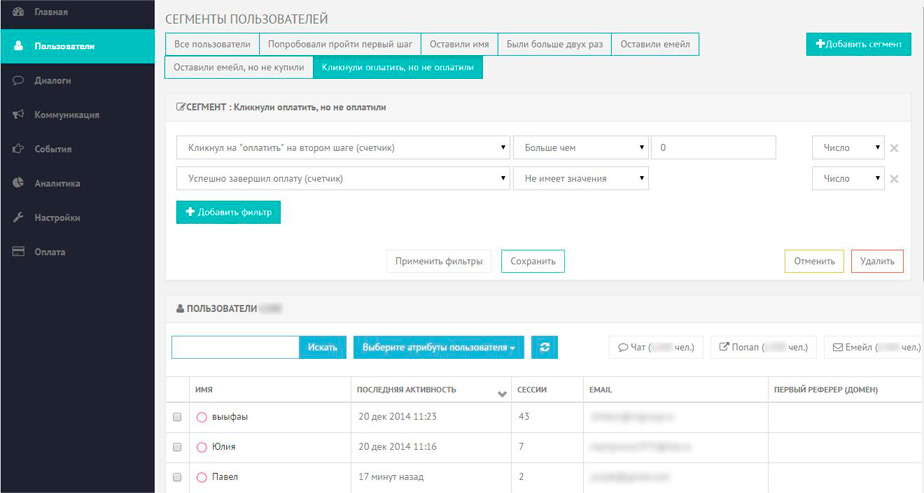
Moreover, pay attention to the column "Sessions". Some of them visited the site more than once. The table below continues and there are users who came to the site 3, 7, 10, 15, 99 times, but they did not get to the “Payment Success” page. They definitely need to ask: what is the problem with payment?
To do this, we select either the entire segment or only the most active users and click "send e-mail".
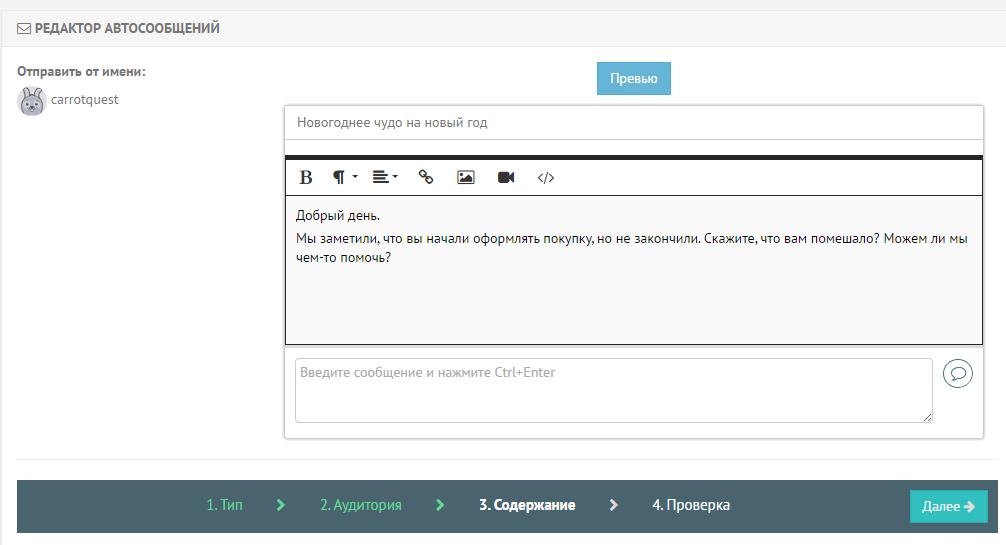
Enter the text of the letter, depending on whether you want to return these users or ask what the problem is with the payment.
This email has not yet been sent. But if at least 10% of those who did not buy return, and complete the purchase, this will give + 2% to the total conversion.
All of this (setting up and analyzing data) took 10 minutes. This is 24 times less than writing the article itself (approximately 4 hours).
Total:
10 minutes of your time = plus 2% to your conversion.
Thank you for being with us. Steep you products and better communication with users.
Ps
Here is a link to the event analytics service and conversion increase tools . For visitors from Habr, we do a Skype demo. Write in the chat.
Task
1) Measure the total Landing conversion.
- How many visitors came;
- How many visitors filled out information about the child;
- How many visitors filled out information about themselves;
- How many visitors moved to the page with payment;
- How many visitors completed the payment.
2) Measure the conversion of each target page button.
3) Learn the effectiveness of the promotion channels in terms of conversion to purchase.
4) Make an e-mail list to those who have not completed the purchase.
')
Decision
To begin, analyze the page: novogodnee-chudo.ru . It has 6 target buttons.
We need to connect to each button to collect data by clicking on them.
We have already installed the carrot quest service code on the site and now run the selectorGadget extension. We define the selector of each button.
Next, create an auto-event for clicking on each button.
In the field “Made action” we indicate the type of action “Click”. In the CSS selector field, select the desired button selector. Create 6 such auto events.
After 2 minutes, we know who exactly pressed each button.
After clicking on any of the target buttons on the landing page, a form appears with three steps of buying a New Year greeting.
Step 1 - Fill in the data of the child
Along the way, connect to the "Next" button. Similarly, create an auto event to track clicking this button.
Step 2 - fill in the data about yourself
In the second step, you need to fill in the customer name and email address.
We collect them using the Autogrowth “Filled in the input field”. Run selectorgatget and get the “your email” field selector. Now what the user enters in this field is automatically recorded in the carrotquest service.
And we need this e-mail to be registered in the properties of this user for further e-mail distribution and communication with this user. Therefore, we specify "Identify the user" and in the additional properties we enter $ email (this is our variable).
Go ahead.
In the second step, there is a “Pay” button. We could get the data on the click on this button in the same way as in step 1. Then we would know if the user clicked on it or not. But we need a little more - we need to know whether he transferred to the payment. Some users click on the "Pay" button without filling in the required fields. And this blurs the statistics. Therefore, we just need to go to the payment page. Therefore, we will use the API and trace not the click on the button, but the sending of data to the robokassa. Something like this:
carrotquest.track ('Event name', {param1: 'value1', param2: 'value2'});
The next funnel step is the success page. We track it very easily:
We make the auto event of the type "went to the page" and indicate the address of the page.
Actually this is all that we needed to do to configure. We proceed to the next part: analysis and marketing.
Building funnels and channel analysis
The task was to analyze the overall conversion of the landing page and see at which step the users “disappear” the most, and from which channels the highest conversion. For obvious reasons, we cannot show specific figures, but here’s an approximate picture for the day:
In general, the transitions between 1, 2 steps and the transition to the payment page have a normal conversion. But at the payment step, quite a lot of users fall off. So e-mail marketing is relevant and it is worth trying to return these users. At the very least, it is worth asking why they did not pay. Maybe the problem is in the method of payment?
Unfortunately, we also cannot show the promotion channels: ((You can tell the following: we saw from which channels the most traffic and conversion of each channel goes. Also, we looked at the effectiveness of advertising campaigns in directo.
As a result, they found out that there are a couple of advertising companies in which it is meaningless to invest money, and there are channels that give a big conversion. Budget allocation will instantly reduce costs and increase sales.
Analysis of target buttons on the main page
Here are the funnels on three of the six buttons:
Even without exact numbers, it can be seen that the number of buyers from the top button is higher. And on the target button in the footer there are almost none. But this is not quite correct comparison. After all, it is clear that more visitors will click on the upper button. First, it is on the first screen. Secondly - it goes for the user.
It is more interesting what the conversion is among those who clicked the button and moved to the second step. What happens next there. What percentage of them turn into buyers. We look.
No, the miracle did not happen. Of those who pressed the top button, the percentage paid for more. Although it is strange, because if you screwed to the end of the page, you looked at everything and more “activated”.
In general, we obtained interesting data for further analysis. You can do AB test of the upper button to increase the conversion of the transition to the second step.
You can change the content of the page under the channel, to increase the effectiveness of each channel.
But it is in the future. Let's move on to marketing.
Select user segments and do e-mail marketing.
Task: return the users who clicked the "Pay" button but did not pay. They were ready to buy, but something stopped them at the last moment.
To begin, select a segment with these users.
These are the users who in the second step clicked "Pay", but did not get to the page "Successful payment". We have already set up tracking of all these events above.
Highlighting a segment with these users, we see that they are very um ... not a few. We can not show the exact figure. We will only say that there are significantly more than 1000 of them.
Moreover, pay attention to the column "Sessions". Some of them visited the site more than once. The table below continues and there are users who came to the site 3, 7, 10, 15, 99 times, but they did not get to the “Payment Success” page. They definitely need to ask: what is the problem with payment?
To do this, we select either the entire segment or only the most active users and click "send e-mail".
Enter the text of the letter, depending on whether you want to return these users or ask what the problem is with the payment.
This email has not yet been sent. But if at least 10% of those who did not buy return, and complete the purchase, this will give + 2% to the total conversion.
All of this (setting up and analyzing data) took 10 minutes. This is 24 times less than writing the article itself (approximately 4 hours).
Total:
10 minutes of your time = plus 2% to your conversion.
Thank you for being with us. Steep you products and better communication with users.
Ps
Here is a link to the event analytics service and conversion increase tools . For visitors from Habr, we do a Skype demo. Write in the chat.
Source: https://habr.com/ru/post/246565/
All Articles