Super powers chrome devtools

I work in a team online. We are making a web version of the 2GIS directory. This is a long-lived actively developing project, in which JavaScript is used as the main language both on the client and on the server.
An important place in the work is occupied by application analysis and debugging tools. Popular JavaScript frameworks usually have their own tools, sharpened by a specific ideology. Our situation is complicated by the fact that our own production framework, Slot, is also under active development under the hood of the Online.
')
In this article I will tell how we use standard browser developer tools for efficient debugging and research. These recipes are aimed primarily at studying the application from outside to inside, so they are suitable for any project.
Problem
The dynamics of development does not allow team members to fully immerse themselves in the details of each other’s tasks. The context of a particular component quickly escapes; returning to the code section a month later, you may not recognize it. In addition, the team is constantly updated with recruits.
In such a situation, it is necessary to quickly restore an understanding of the logic of what is happening in the code. Given the variability of the project, this task is more research in nature. Understanding the general principles of work, you still every time become a pioneer of specific aspects of implementation.
Debugging
Price per development speed - the presence of bugs. This class of tasks requires quick response, and therefore entry into the context of what is happening.
Invalid output
Often, the bug manifests itself in some incorrect external event: an unexpected change in the DOM tree, an asynchronous request with erroneous data, etc. In this case, it is convenient to consider the application code as a black box, whose input is the usage scenario, and the output is the result of the bug.
In addition to the standard breakpoint on the line of code, in DevTools (hereinafter we are talking about the Google Chrome browser tools) it is possible to stop execution on a specific event.
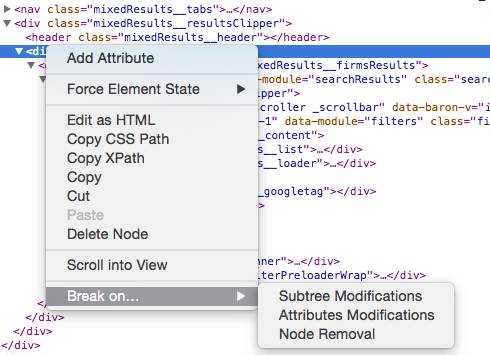
DOM Breakpoint is installed on the tree node in the inspector. You can stop when you delete this element, change its subtree or attributes (recall that style and class are attributes too).
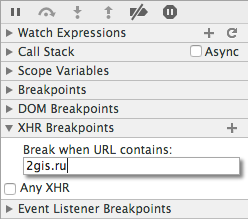
XHR Breakpoint is installed on the entire document and allows you to find a line of code from which a request falling under a given pattern is sent.
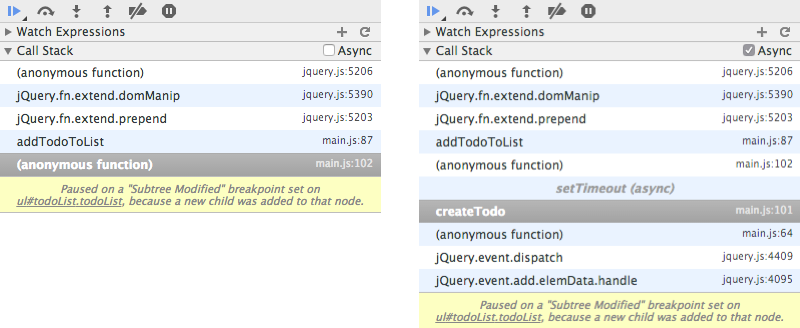
These breakpoints work fine in conjunction with the asynchronous mode of the call stack ( Async all stack ). It does not terminate on asynchronous operations and makes it possible, for example, to switch from the setTimeout handler to the code that installed it. Thus, you can look much further into the story and find the roots of even complex bugs.
Sample script:
1. An unexpected change occurs in the DOM tree.
2. The behavior is reproduced.
3. Set the desired type of DOM breakpoint.
4. Turn on Async mode in the debugger.
5. Reproduce the bug and travel through the call history until we find the roots of the problem.
Incorrect internal representation
Not all bugs are visible to the naked eye. During execution, only the internal state can change, which will later affect the behavior of the system as a whole. It is possible to catch incorrect changes of this state using imagination.
Suppose a state is a global object. Then you can use the following code to spy on it:
var watchMe = {}; Object.observe(watchMe, function() { debugger; }); watchMe.foo = 'bar'; // Using the advanced features of the console (which are described in detail below), you can add logging of changes without stopping the execution for each sneeze.
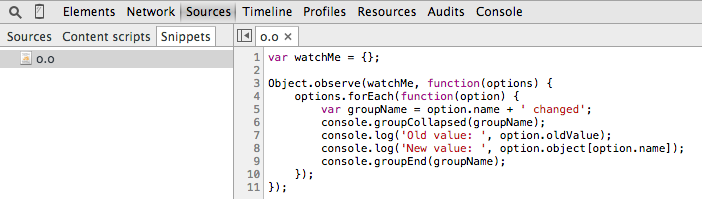
var watchMe = {}; Object.observe(watchMe, function(options) { options.forEach(function(option) { var groupName = option.name + ' changed'; console.groupCollapsed(groupName); console.log('Old value: ', option.oldValue); console.log('New value: ', option.object[option.name]); console.groupEnd(groupName); }); }); This example will display the Chrome console compact log groups when the object properties change. The code is now much more, and every time it is not convenient to write it from memory. Therefore, you can save it as a snippet and run as needed.
Of course, this code will have to be adapted to the project and the task every time. Rarely all the state is stored in one global object. Sometimes you have to edit the source to get into the execution context. But the benefits of this approach are worth the effort.
Usage scenario:
1. If the observed object is global, then just run a snippet on it.
2. If the object is available only in the local scope, add the necessary code to the application at the time of debugging.
Study
The work of the programmer is not limited to fixing bugs. To add new functionality, it is important to understand how the application as a whole works in complex scenarios.
Console as a source of knowledge
The console in DevTools is not only a way to quickly execute a small script. It has a powerful API that implements convenient functions and functions that are not available in the language and are bundled with other DevTools tools.
For example, to display a DOM element in the console, it is not necessary to use complex selectors. Instead, a stack of items selected in the inspector is implemented within the console. It is accessed via the $ N command, where N is the indent from the end of the stack. Thus, a call to $ 0 in the console will return the last DOM node selected in the inspector, $ 1 - the penultimate one, and so on.
It is convenient to use this feature in conjunction with functions on DOM nodes:
- monitorEvents (object) - monitors the element's events;
- getEventListeners (object) —displays the list of event handlers of the element from the console, from which you can go to the function code.
A simple script emerges:
1. Select the items in the inspector.
2. Call the desired command in the console, passing $ 0 by argument.
3. Rejoice as children.
Many developers remove console.log () from the code immediately after debugging. But some key functionality requires constant logging. As a result, each developer first writes a debugging code, and then deletes it.
There is a way to prevent output to the console on production and at the same time it is convenient to log what is happening at the design stage. We use UglifyJS to compress JavaScript, and it has the option to override the values of global variables.
// UglifyJS global_defs: { DEBUG: false } // - if (DEBUG) { console.log('- '); } In the example above, DEBUG will not just be false after assembly. UglifyJS will understand that the condition will never be fulfilled, and will simply remove it from the code.
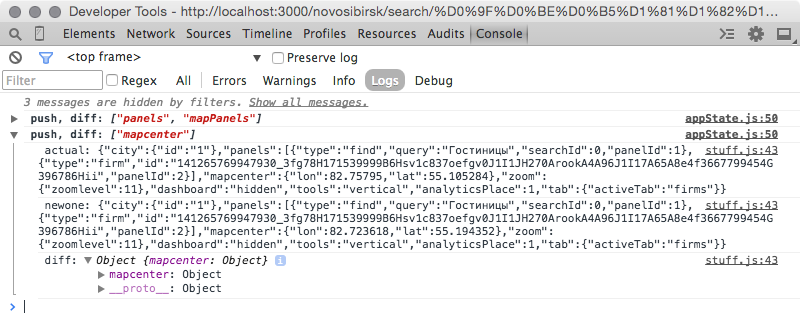
Now you can use more sophisticated console output for different data types. In the debug state example, the output will be more compact due to console.groupCollapsed. This is used in our project to track URL changes:
For arrays, console.table works well. A complete list of output options is here .
Bird's-eye
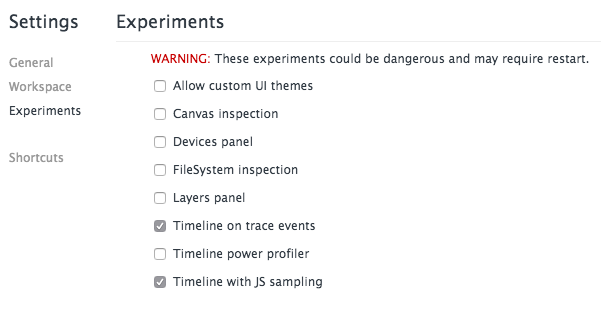
Built-in browser-level event logging tool - Timeline. Until recently, it could be used to analyze application performance. With the advent of experimental features, its capabilities have greatly expanded.
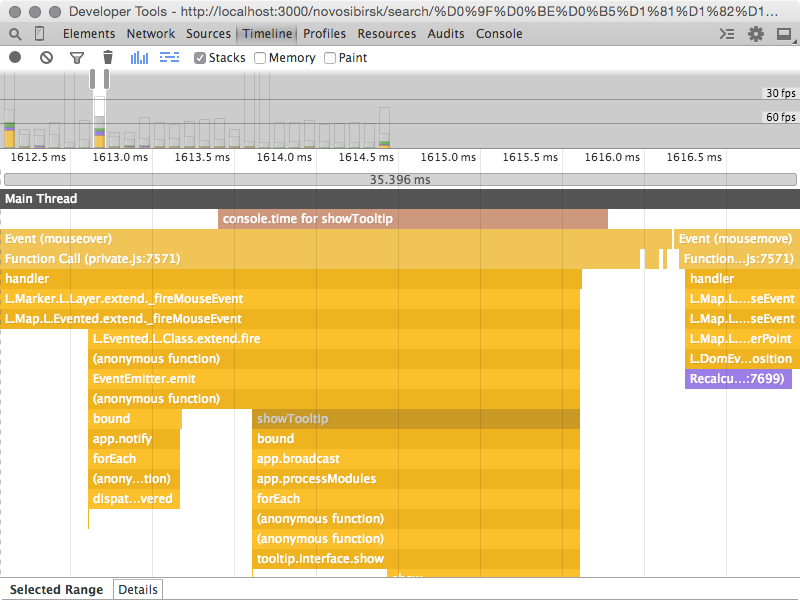
One of the long-awaited features is the display of call stacks right in the event diagram. In essence, this combines the classic Timeline with the CPU Profiler report. This diagram gives an understanding of how an application works in dynamics: call sequences, total execution time of functions, points of interaction between JavaScript and DOM. Even when there is no need for optimization, it can be used to study the internal structure of the project.
If a specific section of the application logic is interesting, and there are too many events in the report, you can use console.time . In addition to measuring runtime, this method adds a label to the Timeline.
Usage example:
1. Write custom script.
2. We study call stacks.
3. If necessary, go to a specific line of code directly from the Timeline.
4. If there is too much information, we wrap the code of interest in console.time and console.timeEnd.
5. We repeat to a complete understanding of the logic of what is happening.
Conclusion
When working on large projects, it makes sense to invest time in the convenience of development. Hours spent exploring and adapting tools save debugging days and give a better understanding of the project.
This article describes only a small part of the Chrome Developer Tools features. In the work on 2GIS Online, we also have more exotic tasks that require constant study of new development tools. I talked more about these tools, as well as about the performance of JavaScript applications, at the FrontTalks conference.
Source: https://habr.com/ru/post/246557/
All Articles