Profile the code with Caché Monitor

Not everyone knows that InterSystems Caché has a built-in code profiling tool called Caché Monitor.
Its main purpose (obviously) is to collect statistics on programs running in Caché. It can provide both general statistics for all programs, as well as detailed Line-by-Line statistics for each individual program.
Use Caché Monitor
Let's look at the scenario using the Caché Monitor and its main features. So, to launch the profiler, you need to go to the area you want to monitor in the terminal and run the% SYS.MONLBL system routine:
')
zn "<namespace>" do ^%SYS.MONLBL As a result of the last command, you will see the following:
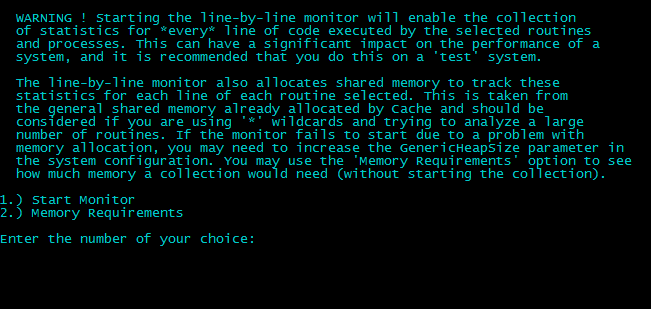
There are only two points: the first one allows, in fact, to start the profiler itself, and the second one - to simulate a launch for calculating the memory needed for monitoring. Note that monitoring a large number of programs at the same time can require quite a lot of memory. If you need this, you may need to increase the value of the gmheap parameter (you can increase it in the System Management Portal => System Administration => Configuration => Advanced Settings => Additional Memory Settings . Changing this parameter will require restarting Caché).
Let's pick the first item. A screen prompts you to enter the program name. Supported mask using "*". To view all the programs already added, you must enter "? L".
In the example, I will monitor all the programs in my area, so I’ll just type in "*".
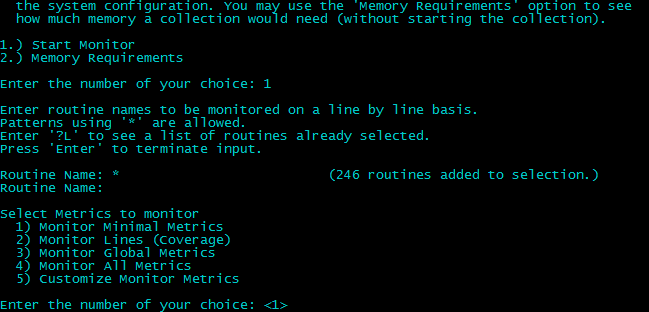
The end of the input is the input of an empty line. As can be seen, 246 programs were selected for monitoring.
Further, we are invited to select metrics for monitoring. More than 50 metrics are available for tracking in Caché Monitor, for example:
- Number of global links
- Time taken to execute string
- Number of rows Caché Object Script
- Number of lines executed
- Number of performances of a line
- Number of lock commands
- The number of successful lock commands, etc.
In most cases, the programmer needs only minimal metrics (number of lines, number of lines executed, number of performances of a specific line, time of execution of a specific line). These statistics will be collected when selecting item 1 (default value). If you wish, you can also collect all the statistics or select specific metrics. In my example, I will focus on minimal metrics:
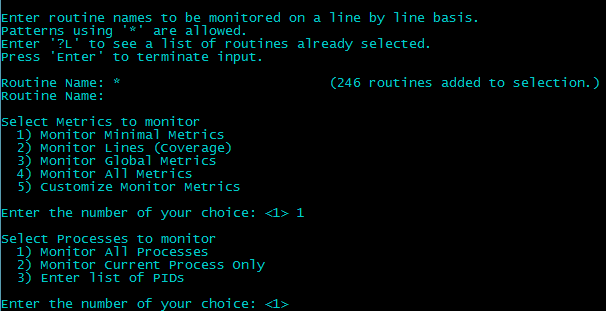
In the next step, you will be prompted to select processes for monitoring. You can collect statistics on some specific processes (you will need to specify a list of their PIDs), on the current process, or on all. I will again focus on the default values.
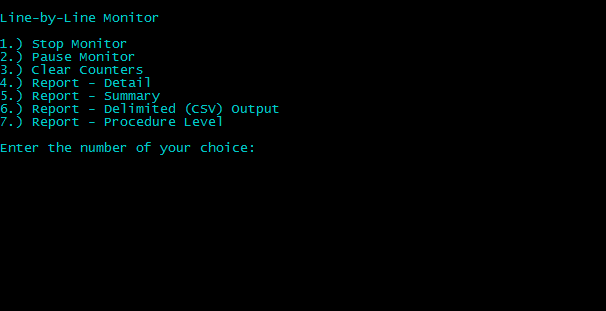
In case of a successful start, you will see the message “Monitor started”. And by pressing Enter you will be in the monitor menu:
Run through the items.
Stop Monitor - complete stop of the monitor. It will also erase all collected statistics.
Pause Monitor - pause the monitor with the ability to continue and save the collected statistics.
Clear Counters - clearing statistics.
The following four points are responsible for the output of the collected statistics. The most commonly used are the first two - outputting detailed Line-by-Line information on a specific program and outputting generalized statistics on all executed programs. If you select these items, you will be prompted to enter a list of programs for which you want to display statistics, and the name of the file to which you want to write it (if you do not specify a file, the statistics will be displayed directly in the terminal). Also, in addition to the INT code, it is possible to include the source code in the output file (if available), but it does not collect detailed statistics on it.
Everything is ready, we run the programs we need for execution, and then we look at the statistics.
Attention! Using the Caché Monitor can bring significant overhead in terms of performance, so using it in production systems is highly discouraged. Please use it only during development and debugging.
Small bonus
For more convenience of viewing the results, I wrote a small web application that you can download from our GitHub repository: github.com/intersystems-ru/monlbl-viewer
At the moment, it can do the following:
- Start, Stop, Pause / Resume Caché Monitor.
- Track minimum metrics by program.
- View generalized statistics on programs.
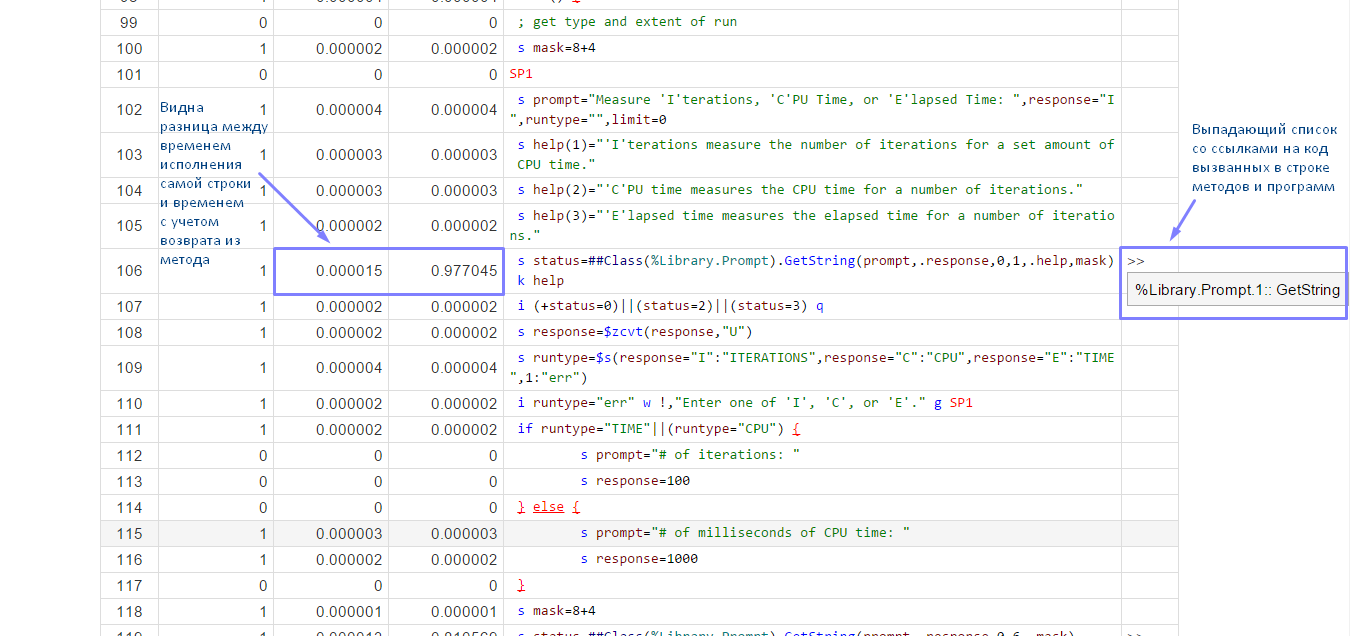
- View detailed Line-by-Line statistics for a specific program.
- Syntax highlighting.
- Transition from calling a class method or program (program label) to the code of this class method or program (if the code is available and monitored by the monitor).
What are the plans:
- Provide the ability to select an area (Namespace) for monitoring.
- The transition from calling the object method and calling the function of the program to the code of this method or function.
- Display of the original CLS class lines in the INT intermediate code lines (if this possibility exists without losing statistics).
A couple of screenshots
I note that the application is distributed under the MIT license (i.e. it is distributed “as is”), because uses the undocumented features of Caché and its performance is not guaranteed on different versions due to the possibility of changing these most undocumented features from version to version.
To use, you must import the files downloaded from the repository to the area for which you want to collect statistics.
Source: https://habr.com/ru/post/245979/
All Articles