Time Series, metrics and statistics: familiarity with InfluxDB

Introduction
Any system administrator constantly has to deal with data presented in the form of time series (time series): statistics of downloading files, statistics of requests to servers, data on the use of system and hardware resources by virtual machines ...
To store and process all this, we need an adequate and productive tool.
')
Specialized solutions are often used to store time series - the so-called time series (temporal) databases. We have already written about their pros and cons. Trying to correct the shortcomings of the existing solutions, we even developed our own product - the time series YAWNDB database, which is used in our monitoring system. But all time series databases are low-level, and the possibilities of their use are very limited. First, they do not allow combining time series with data of other types - for example, with dictionaries. Secondly, they are absolutely not designed to work with large amounts of data. Most temporal databases do not even have a query language. Therefore, the standard task — to request and obtain the necessary information at any time — becomes very complex and non-trivial. Of course, it can be solved without a query language, but this is only possible for users with special knowledge and remarkable programming skills.
For storing time series today, so-called NoSQL databases are increasingly being used - both popular HBase and Cassandra, as well as more specialized solutions - for example, OpenTSDB , KairosDB and Acunu . Perhaps in some situations this option is quite justified, but it is hardly suitable for solving the overwhelming majority of practical problems. All the databases listed above operate on the basis of the Hadoop infrastructure, and their normal functioning requires a huge number of dependencies. Yes, and with the performance of them, not everything is as smooth as it may seem at first glance (for more details, see, for example, here ).
How to solve the problem of storing time series, metrics and statistics? We seriously thought about this issue when we selected the option of storing information about requests to our NS servers.
Quite unexpectedly in the discussion of our post on Habrahabr one of the readers recommended the NoSQL database InfluxDB . We tried it - and were quite pleased. We would like to share our experience with InfluxDB in this article.
general information
The InfluxDB database (see the repository on GitHub ), written in the Go language, is a new product: its first release took place in October 2013. It is positioned as a database for storing time series, metrics, and event information.
Among the advantages of InfluxDB first need to highlight the following:
- no dependencies (due to the fact that it is written in Go);
- the ability to work in cluster mode;
- availability of libraries for a large number of programming languages (Python, JavaScript, PHP, Haskell, and others);
- SQL-like query language, with which you can perform various operations with time series (merge, merge, split into parts);
- convenient graphical interface for working with the database.
InfluxDB uses the LevelDB database as a low-level repository for key-value pairs. For this purpose, you can also use RocksDB (according to the developers of InfluxDB, this is the repository that shows the best performance - see the test report here ), and LMDB .
Write data to InfluxDB in various ways. First, data in the JSON format can be transferred via the HTTP API. Secondly, InfluxDB supports the Carbon protocol used in the Graphite data processing and visualization tool. Thirdly, data can be sent via the UDP protocol.
InfluxDB can be used as a backend for Graphite, and as a result, its performance can be significantly improved. The ability to work with dashboards for Grafana metrics is also supported (more on this later in this article ).
The undoubted advantage of InfluxDB are the wide possibilities of integration with other software products - for example, the tool for processing logs from Fluentd , demons for collecting statistics of CollectD and StatsD , and frameworks for monitoring Sensu and Shinken .
There are client libraries for JavaScript , Ruby , Ruby on Rails , Python , Node.js , PHP , Java , Clojure , Common Lisp , Go , Scala , R , Erlang , Perl , Haskell , .NET (C #) .
The creators of InfluxDB are actively working to develop and improve the product. The following innovations are planned for the next versions:
- adding a binary data exchange protocol;
- Add Publisher-Subscriber Interface (pubsub): this will allow you to subscribe to any request and receive data as they are received in the form of push notifications;
- the ability to index columns;
- the ability to add custom (user-defined) functions using Lua scripts;
- adding security features;
- the possibility of merging data.
Installation
Install Influx DB and see how it can be used in practice. Installation procedures and configuration, we will consider the example of OC Ubuntu; for other Linux distributions, they may differ (see official documentation for details).
Run the following command:
 # for 64-bit systems
 $ wget http://s3.amazonaws.com/influxdb/influxdb_latest_amd64.deb
 $ sudo dpkg -i influxdb_latest_amd64.deb
 # for 32-bit systems
 $ wget http://s3.amazonaws.com/influxdb/influxdb_latest_i386.deb
 $ sudo dpkg -i influxdb_latest_i386.deb
When the installation is complete, launch InfluxDB:
$ sudo /etc/init.d/influxdb start
By default, InfluxDB uses ports 8083, 8086, 8090 and 8099. Other ports can also be used - for this you will need to make the appropriate changes to the configuration file. Consider the features of configuring InfluxDB in more detail.
Setup and Configuration
All InfluxDB settings are stored in the configuration file /opt/influxdb/current/config.toml. They are divided into the following groups:
[logging] - logging parameters (indicate the level of logging and the name of the log file);
[admin] - settings of the web interface (the port on which the internal web server is running and the path to the web interface files);
[api] - HTTP API settings;
[input_plugins] - data input settings from external sources (in InfluxDB, you can transfer data to be sent to Graphite; also in this section you can configure data input via UDP protocol).
[raft] - RAFT negotiation protocol settings;
[storage] - general storage settings;
[cluster] - settings for working in cluster mode (they will be described in more detail below;
[wal] - Write Ahead Logging (WAL) settings.
Create a database
After the installation is complete, open the localhost: 8083 page in the browser. We will see a web interface for working with databases. It looks like this:
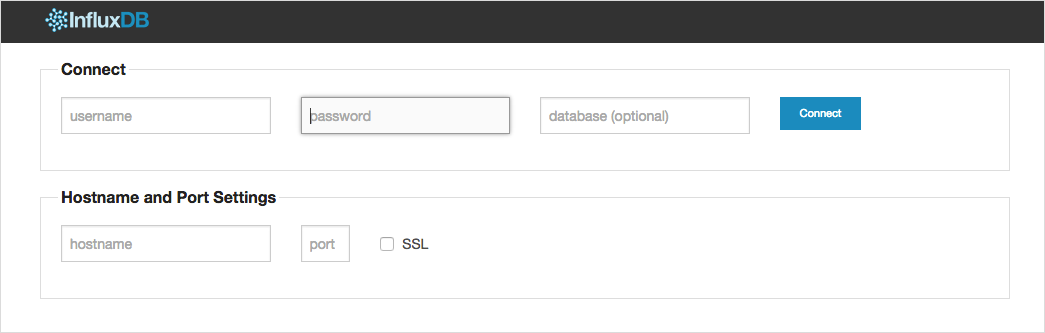
We now enter the login (root) and password (root) (initial values can be set in the configuration file before the first launch), and then click on the Connect button. The following window will open:
InfluxDB graphic interface is simple and intuitive. We draw attention to some important points that should be considered when creating the first database.
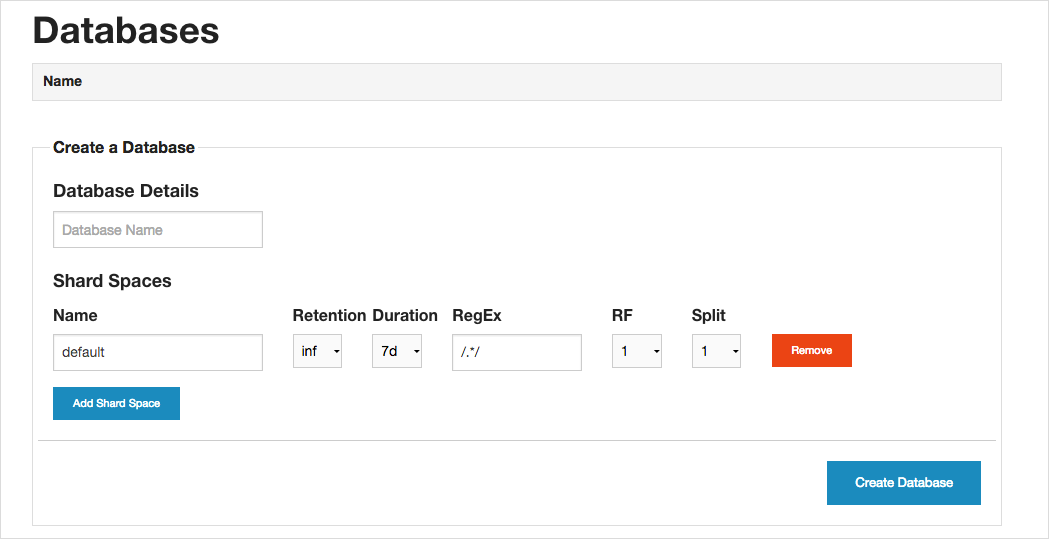
To simplify and speed up the reading of data upon request, it is better to divide the base into components of a small volume - the so-called shards (English shards) The set of shards formed on the basis of the same principle is called a shard space (English shard space).
Creating a base, you need to specify which shard spaces will be included in its composition. Data can be divided into shards, firstly, by time intervals. If, for example, we store in the database information about the actions of users, then it is more convenient to break it up into time periods - for example, data every 7 days will be stored in a separate shard. The length of the time interval is indicated in the Duration section. The column Retention indicates the storage period of the shard.
You can also create shards using regular expressions. If we store in the database metrics for users of the form log.user. <User id>, then a separate shard will be created for each user — to do this, you need to set the regular expression /^log.user.*/.
When creating a database, you can also specify parameters for working in a cluster. The RF column (this abbreviation means Replication Factor - replication factor) indicates on how many nodes a copy of each shard should be stored in the shard space. The column Split indicates how many shards you need to divide the data in for a specific time interval.
To ensure that each server in the cluster is ready to record hot data at any time, it is recommended to calculate the replication factor value using the following formula:
RF = NoS / Split
(RF - replication factor, NoS - number of servers)
The algorithm underlying the division of data into shards includes the following steps:
1. The program scans all shard spaces in the database.
2. Then she goes through all the shard spaces in a cycle and searches for the space to which the new data corresponds.
3. After that, all shards are viewed for a given time interval;
4. If there are no shards, then N shards will be created (N is the number specified in the split graph).
5. Data is written to the shard using the hash (series_name)% N. algorithm.
It is recommended to set the small size of the shard in time (duration).
If you set the storage time of the shard (retention) to inf (ie, infinite), this shard will never be deleted.
Having set all the necessary settings, click on the Create Database button.
Work in a cluster
In cluster mode, several InfluxDB servers form a single system. Each cluster node can accept read and write requests. For the organization of work in a cluster, the RAFT negotiation protocol is used. A clear and illustrative explanation of the principle of its work is presented in this presentation .
According to official documentation, in the current release, work in the cluster is supported only in test mode. Full implementation is planned for one of the following versions (0.9 or 0.10).
The documentation says nothing about how the cluster settings are written in the configuration file, so we’ll dwell on this point in detail. So, to set up a cluster, you need:
1. Start the first InfluxDB node with all the necessary settings, but without the seed-servers parameter in the configuration file (section cluster).
2. On the second and all subsequent nodes, the value of the seed servers parameter indicates the IP address of the first server, which should be started independently:
seed servers = ["IP address of the first server: 8090"]
If the server has already been started without setting the seed-servers parameter, then before adding to the cluster, all InfluxDB data must be removed from it (the path to the default data is / opt / influxdb / shared / data /).
When adding a new node, you can specify the IP address of any server that is already part of the cluster.
We specify the same port as in the [raft] section (by default - 8090).
User rights management
The possibilities of managing user rights through a graphical interface are very limited: you can only perform the simplest operations of adding and deleting users and allow full (administrative rights) access.
More fine-tuning data access can be set only through the API. Access to metrics is implemented as regular expressions.
To change access, you need to send a POST request in JSON format to the URL of the form: influxdb.host : 8086 / db / <database name> / users / <user name>.
In schematic form, the query structure is as follows:
 {
 "readFrom": "<regular expression>",
 "writeTo": <regular expression>
 }
Here is an example of a command to change access settings:
$ curl 'http://influxdb.host:8086/db/seriousmetrics/users/grafana?u=root&p=root' -XPOST -d '{"writeTo": "^ $", "readFrom": ". *" } '
You can view the current rules using the command
$ curl 'http://influxdb.host:8086/db/seriousmetrics/users/grafana?u=root&p=root&pretty=true'
 {
  "name": "grafana",
  "isAdmin": false,
  "writeTo": "^ $",
  "readFrom": ". *"
 }
From the output we can see that the user grafana can read all the metrics (“*.”), But cannot write anything (“^ $”).
Integration with Grafana
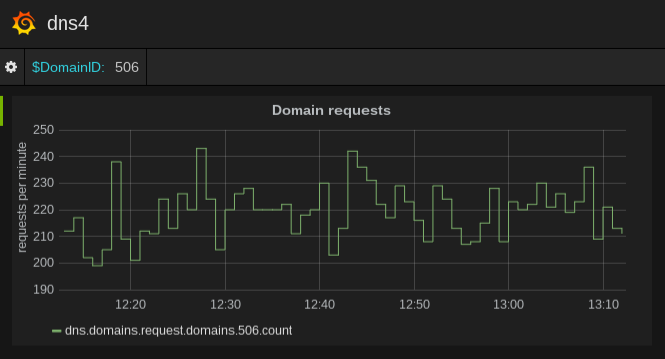
Grafana is a convenient dashboard for sampling and visualization of metrics. There are almost no publications about him in Russian, with the exception of a very small note on Habré .
Especially for those who want to see how InfluxDB works in conjunction with Grafana, we prepared a script (playbook) for Ansible and posted it on GitHub .
To perform a test run, clone the repository at the link above, in the hosts file, specify the IP addresses of the machines that will be included in the cluster, and then run the run.sh script. Please note that the Influxdb configuration description is given in the native Ansible YAML format, from which a TOML file is then generated.
Conclusion
Based on our own (albeit not very large) experience, we concluded that InfluxDB is an interesting and promising solution that can be recommended for practical use. We hope that after reading this article, you will have a desire to get to know InfluxDB better.
If one of you already uses InfluxDB, we invite you to share your experience in the comments.
Readers who for one reason or another are not able to leave comments here are invited to our blog .
Source: https://habr.com/ru/post/245515/
All Articles