ASH Viewer
Prehistory (2008)
At work, I often had to deal with the performance of Oracle database servers. After the release of Oracle 10g, the task of monitoring and diagnosing performance problems became much easier - using Active Session History (ASH ), it became possible to find out what was happening with the database in the past, what was happening on the server at the moment, and even predict what will happen to the load in the future.
But, first, the migration process to the new version is quite long, and some customers continued to use the old versions. And secondly, the means of visualizing the history of active sessions from Oracle, which were available:
From third-party freeware, similar functionality was implemented in the ASHMON utility by Kyle Hailey. But the functionality was only for viewing, and it worked under one platform - Windows.
')
In general, after considering all the options available at that time, it was a volitional decision to assemble his “bicycle” from the materials at hand.
Application Requirements:
Ingredients:
General information about ASH Viewer:
ASH Viewer provides a graphical interface for viewing data on active sessions. The program periodically polls the Oracle database server to get a list of active sessions, saves information in a local database, after which the data is visualized. For versions prior to version 10g, the database is polled once per second; for Oracle 10g and higher, the request for information from v $ active_session_history and updating the chart occur every 30 seconds.
Setup and connection:
Download the distribution kit , unpack it in a separate directory, add ojdbc6.jar to the lib directory. Run ASHV.jar or run.com (run.sh), correcting the path to the installed Java on the local computer. Connection should be made with the help of a user with the privileges to view the tables and the rights to execute pl / sql packages necessary for the ASH Viewer to work here .
For version 10g and higher, it is possible to enable ASH emulation. This mode is suitable for databases that do not have the paid option Oracle Diagnostic Pack, or for Oracle in the Standard Edition. For 9i, 8i versions choose Standard.
Interface Top Activity:
The interface is identical to the Oracle Enterprise Manager Top Activity page. Select an arbitrary range on the chart and get data on top of active sessions and SQL / PL / SQL operators. It is possible to get detailed information on request - request text, execution plans:
- Directly from v $ sql_plan (for various plan_hash_value). Made for compatibility with previous versions of Oracle database;
- DBMS_XPLAN.DISPLAY_CURSOR. From the cursor cache. Execution plans for a specific sql_id;
- DBMS_XPLAN.DISPLAY_AWR. Execution plans from the workload repository, also by sql_id.
In the settings, you can set the automatic mode, in which the program independently updates the top sql-sessions and processes by a given window (by default - 5 minutes of the last activity of the database server), the number of SQL, PL / SQL statements, which select detailed information from the database (query from v $ sql) and the ability to change the scale of the representation of the Top Activity graph relative to the number of processors (database server parameter cpu_count). On the selected range, you can get the ASH report (similar to the conclusion that we get through the script) by calling the database server API - DBMS_WORKLOAD_REPOSITORY.ASH_REPORT_TEXT
Interface Detail:
Detail on CPU Used and each group of wait events. It works similarly to the Oracle Enterprise Manager Top Activity interface, only there is no automatic mode. You can also customize the number of operators by which detailed information is selected from v $ sql, saving plans for executing queries in a local database and the ability to change the scale of the graph representation relative to the number of processors in the system.

Interface History:
On this page, you can view the history of active sessions using collected data from the history of active Oracle sessions. Navigation is made through the interface "Calendar". Also, in the Calendar interface, you can select a range of days and delete it from the local database in order to free up disk space (for example, in case of a long collection of the history of active sessions). Works offline mode, in which you can run ASH Viewer only for viewing archived data. For more complete information in archive mode, it is recommended to collect information online in automatic mode, otherwise information on sql queries will be available only in the form of a SQL ID / HASH Value.
Other:
Use options:
Useful links:
Project page on SourceForge.net .
Project page on github .
Record actions on the screen in a gif file - ScreenToGif
Utility for load testing databases - Hummerora .
Thanks for attention!
At work, I often had to deal with the performance of Oracle database servers. After the release of Oracle 10g, the task of monitoring and diagnosing performance problems became much easier - using Active Session History (ASH ), it became possible to find out what was happening with the database in the past, what was happening on the server at the moment, and even predict what will happen to the load in the future.
But, first, the migration process to the new version is quite long, and some customers continued to use the old versions. And secondly, the means of visualizing the history of active sessions from Oracle, which were available:
- They required some gestures to install and configure them - this is Oracle Enterprise Manager Console (DB Console) or Oracle Enterprise Manager Grid Control (now Oracle Enterprise Manager Cloud Control). DB Console from my (and not only) practice required to install the use of very strong admin spells. Also, in order to save resources, not everyone wants to install additional services on a database server or deploy a separate monitoring infrastructure on its site;
- Possessed a number of architectural flaws. For example, in the event of a database server hanging up, access to information from the history of active sessions through the Oracle Enterprise Manager Console became impossible, and quickly finding out that “something went wrong” (c) was practically unrealistic;
- There was no functionality in terms of storing monitoring data and its subsequent analysis on its site.
From third-party freeware, similar functionality was implemented in the ASHMON utility by Kyle Hailey. But the functionality was only for viewing, and it worked under one platform - Windows.
')
In general, after considering all the options available at that time, it was a volitional decision to assemble his “bicycle” from the materials at hand.
Application Requirements:
- Independence from monitoring tools installed on the database at the client;
- The ability to save monitoring results in a local database for further processing;
- Extensibility Ability to add functionality if necessary;
- Cross platform Work of the program both in Unix / Linux, and in Windows environment.
Ingredients:
- Oracle Berkeley DB Java Edition v. 3.3.75. Embedded key value storage. To store data history of active sessions;
- JFreeChart v. 1.0.12. Library for creating graphs on Java SE. To solve the problem came stacked chart. The main changes to achieve the desired result - in the same way as in the Oracle Enterprise Manager - see ChartPanel ;
- E-Gantt v.0.5.3. Library for creating Gantt graphs in Java Swing;
- SwingLabs Swing Component Extensions v. 0.9.5. For more convenient output of tabular data, calendar, etc .;
- Joda Time - Java date and time API v.1.6. Excellent library for working with dates in Java;
- Blanco SQL Formatter v. 0.1.1. Formatting sql, pl / sql code;
- jEdit Syntax Package v. 2.2.2. For highlighting sql, pl / sql code.
General information about ASH Viewer:
ASH Viewer provides a graphical interface for viewing data on active sessions. The program periodically polls the Oracle database server to get a list of active sessions, saves information in a local database, after which the data is visualized. For versions prior to version 10g, the database is polled once per second; for Oracle 10g and higher, the request for information from v $ active_session_history and updating the chart occur every 30 seconds.
Setup and connection:
Download the distribution kit , unpack it in a separate directory, add ojdbc6.jar to the lib directory. Run ASHV.jar or run.com (run.sh), correcting the path to the installed Java on the local computer. Connection should be made with the help of a user with the privileges to view the tables and the rights to execute pl / sql packages necessary for the ASH Viewer to work here .
For version 10g and higher, it is possible to enable ASH emulation. This mode is suitable for databases that do not have the paid option Oracle Diagnostic Pack, or for Oracle in the Standard Edition. For 9i, 8i versions choose Standard.
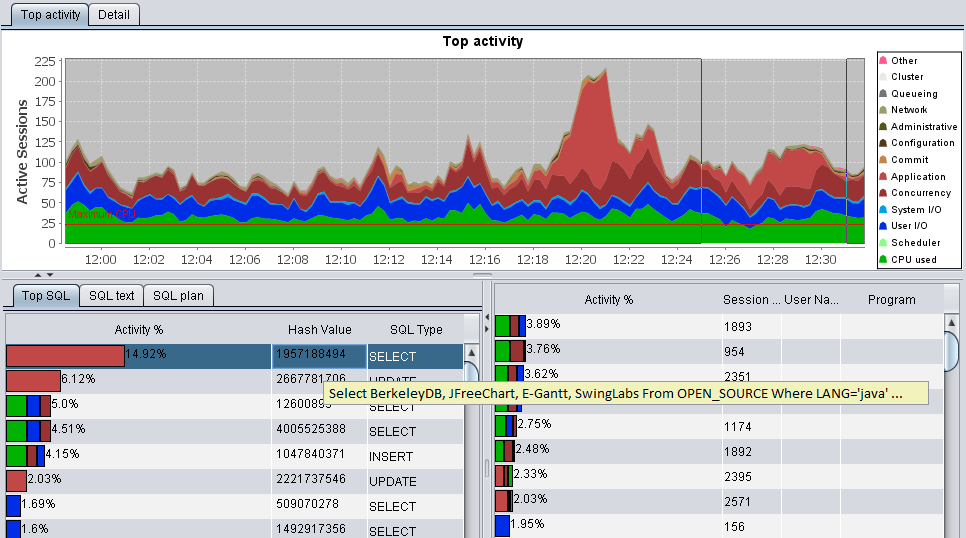
Interface Top Activity:
The interface is identical to the Oracle Enterprise Manager Top Activity page. Select an arbitrary range on the chart and get data on top of active sessions and SQL / PL / SQL operators. It is possible to get detailed information on request - request text, execution plans:
- Directly from v $ sql_plan (for various plan_hash_value). Made for compatibility with previous versions of Oracle database;
- DBMS_XPLAN.DISPLAY_CURSOR. From the cursor cache. Execution plans for a specific sql_id;
- DBMS_XPLAN.DISPLAY_AWR. Execution plans from the workload repository, also by sql_id.
In the settings, you can set the automatic mode, in which the program independently updates the top sql-sessions and processes by a given window (by default - 5 minutes of the last activity of the database server), the number of SQL, PL / SQL statements, which select detailed information from the database (query from v $ sql) and the ability to change the scale of the representation of the Top Activity graph relative to the number of processors (database server parameter cpu_count). On the selected range, you can get the ASH report (similar to the conclusion that we get through the script) by calling the database server API - DBMS_WORKLOAD_REPOSITORY.ASH_REPORT_TEXT
Interface Detail:
Detail on CPU Used and each group of wait events. It works similarly to the Oracle Enterprise Manager Top Activity interface, only there is no automatic mode. You can also customize the number of operators by which detailed information is selected from v $ sql, saving plans for executing queries in a local database and the ability to change the scale of the graph representation relative to the number of processors in the system.
Interface History:
On this page, you can view the history of active sessions using collected data from the history of active Oracle sessions. Navigation is made through the interface "Calendar". Also, in the Calendar interface, you can select a range of days and delete it from the local database in order to free up disk space (for example, in case of a long collection of the history of active sessions). Works offline mode, in which you can run ASH Viewer only for viewing archived data. For more complete information in archive mode, it is recommended to collect information online in automatic mode, otherwise information on sql queries will be available only in the form of a SQL ID / HASH Value.
Other:
- If there is no connection to the database (network failures, problems with the listener, restarting the database), ASH Viewer automatically tries to connect to the Oracle server every 30 seconds to continue collecting information about the history of active sessions;
- It is possible in the settings to specify to drop the data from the top SQL / PL / SQL statements to the OS clipboard.
Use options:
- Current performance monitoring of Oracle DBMS;
- View the history of active sessions for the previous observation period;
- Creating reports on the operation of the Oracle database.
Useful links:
Project page on SourceForge.net .
Project page on github .
Record actions on the screen in a gif file - ScreenToGif
Utility for load testing databases - Hummerora .
Thanks for attention!
Source: https://habr.com/ru/post/245507/
All Articles