How to make online logging from scratch
Described below is a weekend design. A couple of evenings were spent from idea to implementation. The description presents the necessary minimum for the implementation of the information collection system, with access to the latter online.
Already in the process of writing this note, an article appeared: Wintering cacti with online temperature control . In the beginning I was frightened that they were ahead, however, although the task being solved in both cases is close, the implementation is radically different.
The architecture of the resulting system is shown in the diagram:

As you can see, the client part is fully implemented in the microcontroller. The system is easily scaled and configured for any needs.
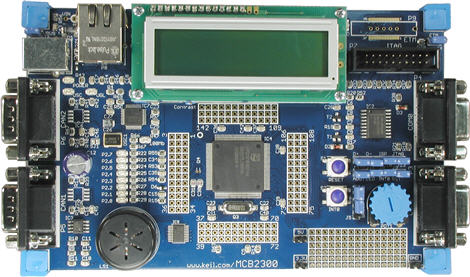
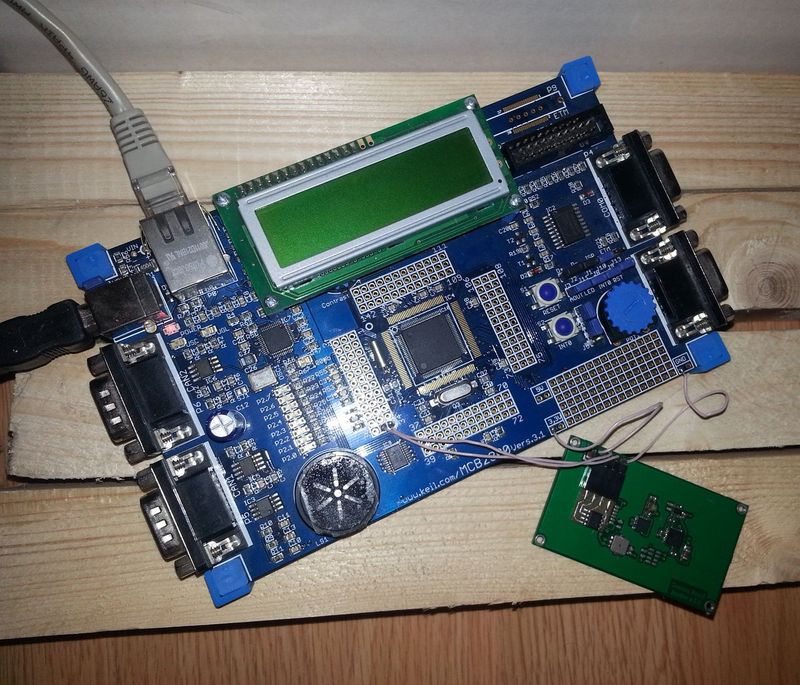
The basis of the client is the Keil MCB2300 board, which has been idle for a long time. The board is built on the LPC2368 microcontroller, it is quite old (at the moment it is more reasonable to use LPC1768 instead of it), but it is stuffed with everything necessary. There is an Ethernet interface on the board, which in this case is a “window to the world”. As a data source, BMP085, which I have known for a long time, is used as a data source; it is connected via the I 2 C interface.
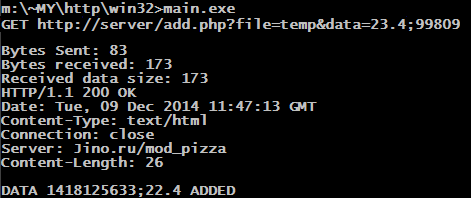
Software for testing the server and verifying the operation of HTTP requests was written within the Win32 application:
In the future, the same logic passed into the microcontroller. Currently, the request is addressed to a specific IP address, but it is better to use a DNS client, since theoretically, the hosting operator can transfer the site within its address space. You can also add an NTP client to send data to the server immediately with a time stamp.
This project is my first trial of working with TCP / IP protocol on a microcontroller. The basis is an example of EasyWeb, which is offered for many boards with Ethernet as a starter. The main cycle of the program turned out to be crooked, however, I don't want to comb it, because the necessary functionality has already been implemented, but I want to try to transfer this application to the uIP stack, because by its internal structure I like it more.
The main cycle of the program:
The server part is deployed on a regular hosting. The main requirement for it: support for PHP. Data is saved as CSV files. The scripts are as simple as possible, the functionality is divided into 2 files:
All data is transmitted to the server as part of GET requests:
But the contents of the CSV file:
Each line contains a time stamp, temperature and pressure in Pascals.
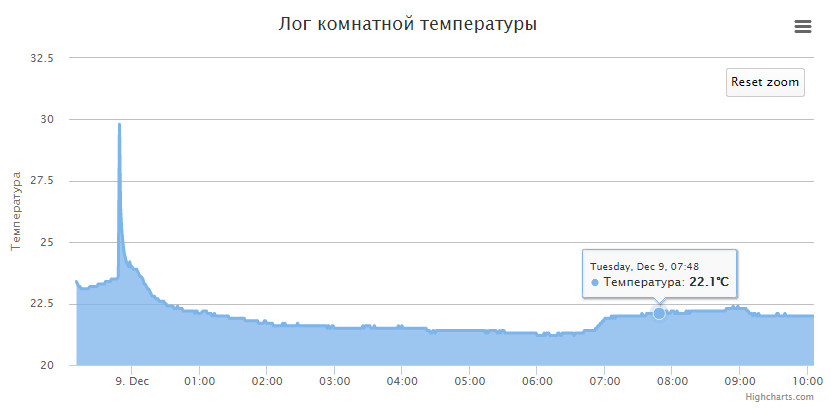
To make it look beautiful, other forms of data display can be organized on the server. As a library of charts / graphs tried to use Highcharts . With him you can make here such a design:
This is not a live schedule, it is a screenshot of its view. In a live view of the schedule you can see the links:Temperature and Pressure .
UPD: Combined both graphs on one page: Temperature / Pressure .
')
Already in the process of writing this note, an article appeared: Wintering cacti with online temperature control . In the beginning I was frightened that they were ahead, however, although the task being solved in both cases is close, the implementation is radically different.
The architecture of the resulting system is shown in the diagram:
As you can see, the client part is fully implemented in the microcontroller. The system is easily scaled and configured for any needs.
Device
The basis of the client is the Keil MCB2300 board, which has been idle for a long time. The board is built on the LPC2368 microcontroller, it is quite old (at the moment it is more reasonable to use LPC1768 instead of it), but it is stuffed with everything necessary. There is an Ethernet interface on the board, which in this case is a “window to the world”. As a data source, BMP085, which I have known for a long time, is used as a data source; it is connected via the I 2 C interface.
Software for testing the server and verifying the operation of HTTP requests was written within the Win32 application:
In the future, the same logic passed into the microcontroller. Currently, the request is addressed to a specific IP address, but it is better to use a DNS client, since theoretically, the hosting operator can transfer the site within its address space. You can also add an NTP client to send data to the server immediately with a time stamp.
This project is my first trial of working with TCP / IP protocol on a microcontroller. The basis is an example of EasyWeb, which is offered for many boards with Ethernet as a starter. The main cycle of the program turned out to be crooked, however, I don't want to comb it, because the necessary functionality has already been implemented, but I want to try to transfer this application to the uIP stack, because by its internal structure I like it more.
The main cycle of the program:
- We read data from the sensor.
- Open the connection.
- Sends an HTTP GET request to the server.
- If 10 seconds have passed, and the protocol of communication with the server has not passed, we break the connection on timeout.
- We are waiting for 1-5 minutes. This wait sets the data retention interval.
Server
The server part is deployed on a regular hosting. The main requirement for it: support for PHP. Data is saved as CSV files. The scripts are as simple as possible, the functionality is divided into 2 files:
- add.php - script to add data to the log file. Gets the file parameter with the file name to be written and the data parameter with the data to be written. The first column of the script adds the timestamp. There is also a clear function that allows you to clear the log file.
- get.php - display data from the log file. Gets the only file parameter with the file name.
All data is transmitted to the server as part of GET requests:
GET http: //server/add.php? File = temp & data = 23.4; 99809 HTTP / 1.0 \ r \ n \ r \ n
But the contents of the CSV file:
  1418069433; 23.4; 99809
 1418069443; 23.4; 99811
 1418069453; 23.4; 99818
 1418069464; 23.4; 99801
Each line contains a time stamp, temperature and pressure in Pascals.
Graphic output
To make it look beautiful, other forms of data display can be organized on the server. As a library of charts / graphs tried to use Highcharts . With him you can make here such a design:
This is not a live schedule, it is a screenshot of its view. In a live view of the schedule you can see the links:
UPD: Combined both graphs on one page: Temperature / Pressure .
')
Files
Links
Source: https://habr.com/ru/post/245411/
All Articles