RedHat / Oracle Linux with NetApp FAS (SAN)
In continuation of the topic of optimizing the host. In the previous article I wrote about Windows and SAN optimization , in this article I would like to look at the RedHat / Oracle Linux optimization topic (with and without virtualization) using NetApp FAS in SAN .
To find and eliminate bottlenecks in such an infrastructure, you need to decide on the components of the infrastructure, among which they should be looked for. We divide the infrastructure into the following components:
')
To search for a bottleneck, a sequential exception technique is usually performed. I suggest first thing to start with the storage system . And move on to the storage system -> Network ( Ethernet / FC) -> Host ( Windows / Linux / VMware ESXi 5.X and ESXi 6.X ) -> Application. Now we’ll stop at Khost.
In the case of connecting LUNs directly to the OS without virtualization, it is advisable to install the NetApp Host Utility. In the case of using virtualization with RDM or VMFS , you need to configure Multipathing on the hypervisor .
Multipathing should by default use the preferred paths - paths to the LUN through the ports of the controller on which it is located. Messages in the console FCP Partner Path Misconfigured will talk about incorrectly configured ALUA or MPIO . This is an important parameter; you should not ignore it, since there was one real case where the enraged host multipassing driver continuously switched between paths, thus creating large queues in the I / O system. For details on SAN Booting, see the related article: Red Hat Enterprise Linux / Oracle Enterprise Linux , Cent OS , SUSE Linux Enterprise
Learn more about zoning recommendations for NetApp in pictures .
If iSCSI is used, it is highly recommended to use Jumbo Frames on Ethernet with a speed higher than or equal to 1Gb. Read more in the article about Ethernet with NetApp FAS . Do not forget that you need to run ping 28 bytes less when using Jumbo Frames in Linux.
Flow Control is desirable to turn off all the traffic from the server to the storage system with 10GB links. More details .
Considering the “versatility” of 10 GBE , when FCoE , NFS , CIFS , iSCSI can walk at the same time along with such technologies as vPC and LACP , as well as the simplicity of servicing Ethernet networks, the protocol and switches favorably distinguish FC “Maneuvering” and saving investments in the event of a change in business needs.
Internal tests of NetApp storage systems (for other storage vendors this situation may differ) FC 8G and 10 GBE iSCSI , CIFS and NFS show almost the same performance and latency typical for OLTP and server and desktop virtualization, i.e. for loads with small blocks and random read writing.
I propose to get acquainted with the pack of descriptive similarities, differences and perspectives of Ethernet & FC .
In the case when the customer's infrastructure implies two switches, then we can talk about the same complexity of configuring both SAN and Ethernet networks. But for many SAN customers, the network is not reduced to two SAN switches, where “everyone sees everyone”, as a rule, the configuration does not end at this point; in this respect, Ethernet maintenance is much easier. Typically, a customer's SAN network is a multitude of switches with redundant links and links to remote sites, which is by no means trivial to maintain. And if something goes wrong, Wireshark traffic will not "listen."
Modern converged switches, such as the Cisco Nexus 5500, are capable of switching both Ethernet and FC traffic, allowing for greater flexibility in the future thanks to a two-in-one solution.
In the case of using the "file" protocols NFS and CIFS, it is very easy to take advantage of the use of the technology of Thin Provitioning, returning the freed up space inside the file balls. But in the case of SAN, the use of ThinProvitioning leads to the need for constant control over free space plus the release of free space (the mechanism is available for modern OS ) is not "inside" the same LUN , but rather inside the Volume containing this LUN . I recommend that you read the NetApp Thin-Provisioned LUNs on RHEL 6.2 Deployment Guide .
You don’t have to give the guest OS all server resources; first, the hypervisor needs to leave at least 4GB of RAM , and secondly, the opposite effect is sometimes observed when adding guest OS resources, this needs to be selected empirically.
Learn more about the ESXi host settings for NetApp FAS .
I want to draw your attention to the fact that in most Linux distributions, both as a virtual machine and BareMetal, the I / O scheduling parameter is set to not suitable for FAS systems, this can lead to high CPU utilization.
Notice the output of the top command, the high utilization of the CPU caused by the dd process, which in general has to generate load only on the storage system.
Now look at the state of the disk subsystem on the host side
Note the high await value = 150.26 ms . These two indirect signs, high utilization of the CPU and high latency, may tell us that it is necessary to more optimally configure the OS and storage for interaction. It is worth checking, for example: the adequacy of the work of multipassing, ALUA, preferred paths and queues on the HBA.
Now about the values for elevator / scheduler :
By default, it is set to cfq or deadline :
It is recommended to set it to noop :
To make the settings permanent, add “ elevator = noop ” to the kernel boot parameters in the /etc/grub.conf file, they will be applied to all block devices. Or add the appropriate script to /etc/rc.local in order to flexibly set up settings for each individual block device.
It should be experienced to find the most optimal values of the virtual memory of the OS - sysctl parameters: vm.dirty_background_ratio , vm.dirty_ratio and vm.swappiness .
So, for one customer, the most optimal values for RedHat enterprice Linux 6 with NetApp storage systems with SSD cache and FC 8G connection were: vm.dirty_ratio = 2 and vm.dirty_background_ratio = 1 , which significantly reduced the load on the host CPU . To check the optimal settings of the Linux host, use the Linux Host Validator and Configurator utility. When testing the SnapDrive utility for Linux (or other Unix-like) OSs, use the SnapDrive Configuration Checker for Unix . Learn more about the selection of optimal parameters vm.dirty * look here . In the case of using the Oracle database or virtualization, inside such a Linux machine it is recommended to set the value vm.swappiness = 0 . This value will only allow swap to be used when the physical memory actually runs out, which is optimal for such tasks .
The default value is usually 128 , it must be manually selected. Increasing the queue length makes sense for random I / O operations that generate many disk seek operations on the disk subsystem. We change it like this:
In some cases, VMFS shows better performance than RDM . So in some tests with FC 4G you can get 300 MByte / sec using VMFS and about 200 MByte / sec with RDM .
FS can make significant adjustments when testing performance.
The size of the FS block should be a multiple of 4KB. For example, if we run a synthetic load similar to the generated OLTP , where the size of the operated block is on average 8KB, then we put 8KB. I also want to note that as a file system itself, its implementation for a specific OS and version can greatly influence the overall performance picture. So for when writing 10 MB blocks in 100 streams with the dd file command from the database on the UFS file system located on the LUN , the FC 4G with FAS 2240 data storage and 21 + 2 SAS 600 10k disks in one unit showed a speed of 150 MB / s, while however, the ZFS configuration showed two times more FS (approaching the theoretical maximum of the network channel), and the Noatime parameter didn’t affect the situation at all.
At the file system level, you can configure the parameter when installing noatime and nodiratime , which will not allow updating the access time to files, which often has a very positive effect on performance. For FSs such as UFS, EXT3, and others. One of the customers installing noatime when mounting an ext3 file system on Red Hat Enterprise Linux 6 greatly reduced the load on the host CPU .
For Linux machines, you need to select the disk geometry when creating a LUN : " linux " (for machines without xen) or " xen " if Linux LVM with Dom0 is installed on this moon.
For any OS, when creating LUNs , in the storage settings, select the correct geometry. In the case of an incorrectly specified size of the FS block, an incorrectly specified LUN geometry, the MBR / GPT parameter that is not correctly selected on the host, we will observe at peak loads messages in the NetApp FAS console about a certain " LUN misalignment" event. Sometimes these messages may appear erroneously, in the case of their rare appearance just ignore them. You can check this by running the lun stats command on the storage system .
Do not ignore this item. The toolkit sets the correct delays, queue size for HBAs, and other settings on the host. Install Host Utilities after installing the drivers. Displays the connected LUNs and their detailed information from the storage side. The set of utilities is free and can be downloaded from the Netta technical support website. After installation, run the utility.
She is to be
/ opt / netapp / santools /
After that, most likely, you will need to restart the host.
Don't forget to search for more information and ask your questions at https://linux.netapp.com/forum .
Depending on the configuration, protocols, loads, and infrastructure, your applications may have different tuning and fine tuning recommendations. To do this, contact the Best Practice Guide for the appropriate applications for your configuration. The most common may be
Do not forget to install the drivers for your HBA adapter (by compiling them for your kernel) before you install the NetApp Host Utility. Follow the recommended HBA adapter settings. Often, you need to change the queue length and timeout for optimal interaction with NetApp. If you are using VMware ESXi or other virtualization, do not forget to enable NPIV if you need to forward virtual HBA adapters inside the virtual machine. Some NPIV- based adapters can be configured for QoS , such as the Qlogic HBA 8100 series .
Make extensive use of the compatibility matrix in your practice to reduce potential problems in the data center infrastructure.
I am sure that over time, I will have something to add to this article on optimizing the Linux host, so look here from time to time.
I ask to send messages on errors in the text to the LAN .
Notes and additions on the contrary please in the comments
To find and eliminate bottlenecks in such an infrastructure, you need to decide on the components of the infrastructure, among which they should be looked for. We divide the infrastructure into the following components:
- Host Settings with SAN ( FC / FCoE )
- Host Ethernet network settings for IP SAN ( iSCSI ).
- Actually host with OS
- Applications on the host
- Check for compatibility of drivers and software versions
')
To search for a bottleneck, a sequential exception technique is usually performed. I suggest first thing to start with the storage system . And move on to the storage system -> Network ( Ethernet / FC) -> Host ( Windows / Linux / VMware ESXi 5.X and ESXi 6.X ) -> Application. Now we’ll stop at Khost.
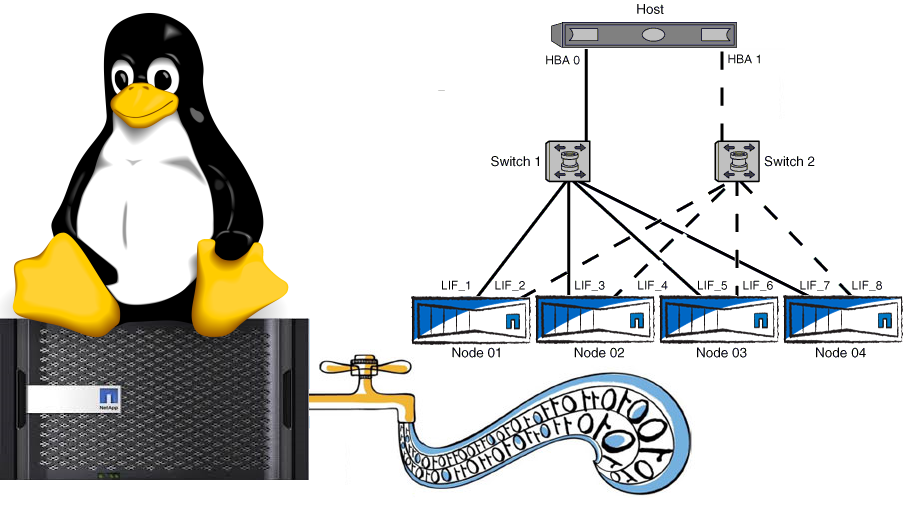
SAN Multipathing
In the case of connecting LUNs directly to the OS without virtualization, it is advisable to install the NetApp Host Utility. In the case of using virtualization with RDM or VMFS , you need to configure Multipathing on the hypervisor .
Multipathing should by default use the preferred paths - paths to the LUN through the ports of the controller on which it is located. Messages in the console FCP Partner Path Misconfigured will talk about incorrectly configured ALUA or MPIO . This is an important parameter; you should not ignore it, since there was one real case where the enraged host multipassing driver continuously switched between paths, thus creating large queues in the I / O system. For details on SAN Booting, see the related article: Red Hat Enterprise Linux / Oracle Enterprise Linux , Cent OS , SUSE Linux Enterprise
Learn more about zoning recommendations for NetApp in pictures .
Ethernet
Jumbo frames
If iSCSI is used, it is highly recommended to use Jumbo Frames on Ethernet with a speed higher than or equal to 1Gb. Read more in the article about Ethernet with NetApp FAS . Do not forget that you need to run ping 28 bytes less when using Jumbo Frames in Linux.
ifconfig eth0 mtu 9000 up echo MTU=9000 >> /etc/sysconfig/network-scripts/ifcfg-eth0 #ping for MTU 9000 ping -M do -s 8972 [destinationIP] Flow control
Flow Control is desirable to turn off all the traffic from the server to the storage system with 10GB links. More details .
ethtool -A eth0 autoneg off ethtool -A eth0 rx off ethtool -A eth0 tx off echo ethtool -A eth0 autoneg off >> /etc/sysconfig/network-scripts/ifcfg-eth0 echo ethtool -A eth0 rx off >> /etc/sysconfig/network-scripts/ifcfg-eth0 echo ethtool -A eth0 tx off >> /etc/sysconfig/network-scripts/ifcfg-eth0 ESXi & MTU9000
In case of using the ESXi environment, do not forget to create the correct network adapter - E1000 for 1GB networks or VMXNET3 if you have a network higher than 1Gb. E1000 and VMXNET3 support MTU 9000, and the standard Virtual Network Adapter type "Flexible" does not support.
Learn more about optimizing VMware with NetApp FAS .
Converged network
Considering the “versatility” of 10 GBE , when FCoE , NFS , CIFS , iSCSI can walk at the same time along with such technologies as vPC and LACP , as well as the simplicity of servicing Ethernet networks, the protocol and switches favorably distinguish FC “Maneuvering” and saving investments in the event of a change in business needs.
FC8 vs 10GBE: iSCSI, CIFS, NFS
Internal tests of NetApp storage systems (for other storage vendors this situation may differ) FC 8G and 10 GBE iSCSI , CIFS and NFS show almost the same performance and latency typical for OLTP and server and desktop virtualization, i.e. for loads with small blocks and random read writing.
I propose to get acquainted with the pack of descriptive similarities, differences and perspectives of Ethernet & FC .
In the case when the customer's infrastructure implies two switches, then we can talk about the same complexity of configuring both SAN and Ethernet networks. But for many SAN customers, the network is not reduced to two SAN switches, where “everyone sees everyone”, as a rule, the configuration does not end at this point; in this respect, Ethernet maintenance is much easier. Typically, a customer's SAN network is a multitude of switches with redundant links and links to remote sites, which is by no means trivial to maintain. And if something goes wrong, Wireshark traffic will not "listen."
Modern converged switches, such as the Cisco Nexus 5500, are capable of switching both Ethernet and FC traffic, allowing for greater flexibility in the future thanks to a two-in-one solution.
Thin provisioning
In the case of using the "file" protocols NFS and CIFS, it is very easy to take advantage of the use of the technology of Thin Provitioning, returning the freed up space inside the file balls. But in the case of SAN, the use of ThinProvitioning leads to the need for constant control over free space plus the release of free space (the mechanism is available for modern OS ) is not "inside" the same LUN , but rather inside the Volume containing this LUN . I recommend that you read the NetApp Thin-Provisioned LUNs on RHEL 6.2 Deployment Guide .
ESXi Host
You don’t have to give the guest OS all server resources; first, the hypervisor needs to leave at least 4GB of RAM , and secondly, the opposite effect is sometimes observed when adding guest OS resources, this needs to be selected empirically.
Learn more about the ESXi host settings for NetApp FAS .
Guest OS and host BareMetal Linux
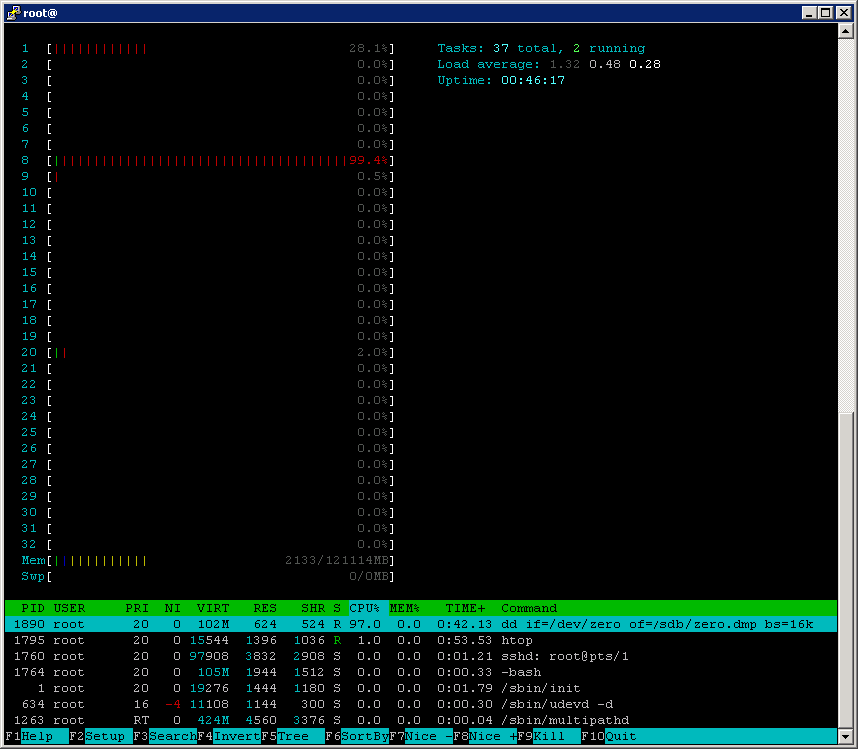
I want to draw your attention to the fact that in most Linux distributions, both as a virtual machine and BareMetal, the I / O scheduling parameter is set to not suitable for FAS systems, this can lead to high CPU utilization.
Notice the output of the top command, the high utilization of the CPU caused by the dd process, which in general has to generate load only on the storage system.
Collecting statistics on the host
Linux and other Unix-like :
Now look at the state of the disk subsystem on the host side
iostat -dx 2 Device: rrqm/s wrqm/sr/sw/s rsec/s wsec/s avgrq-sz avgqu-sz await svctm %util sdb 0.00 0.00 0.00 454.00 0.00 464896.00 1024.00 67.42 150.26 2.20 100.00 Note the high await value = 150.26 ms . These two indirect signs, high utilization of the CPU and high latency, may tell us that it is necessary to more optimally configure the OS and storage for interaction. It is worth checking, for example: the adequacy of the work of multipassing, ALUA, preferred paths and queues on the HBA.
Iostat interpretation
Read more here .
| Iostat | Windows analog |
|---|---|
| rrqm / s (The number of merged read requests queued per second.) read I / O per second | LogicalDisk (*) \ Disk Transfers / sec = rrqm / s + wrqm / s., For Linux machines add a column rrqm / s, and LogicalDisk (*) \ Disk Transfers / sec skip |
| Wrqm / s (The number of merged write requests, queued per second.) Write I / O per second | LogicalDisk (*) \ Disk Transfers / sec = rrqm / s + wrqm / s., For Linux machines add a column wrqm / s, and LogicalDisk (*) \ Disk Transfers / sec skip |
| R / s | Disk, reads / sec |
| W / s (device number per second) | Disk writes / sec |
| Rsec / s (The number of sectors read per second.) Need to know the size of the sector, usually 512 bytes. | Rsec / s * 512 =, "\ LogicalDisk (*) \ Disk, Read Bytes / sec", |
| Wsec / s (The number of sectors written per second.) Need to know the size of the sector, usually 512 bytes. | wsec / s * 512 =, "\ LogicalDisk (*) \ Disk Write Bytes / sec", |
| Avgrq-sz (The request size in sectors.) Need to know the size of the sector, usually 512 bytes. | avgrq-sz - the average size of the operated block is needed. Add a column, in Windows it is calculated from other parameters. |
| Avgqu-sz (The number of requests to the device's queue.) | "\ LogicalDisk (*) \ Avg., Disk Queue Length". Separately, according to Read and Write, there is no, but this is enough. Read-write ratio will be calculated by “rrqm / s” with “wrqm / s” or “r / s” with “w / s”. That is, for Linux, skip:, LogicalDisk (*) \ Avg., Disk Read Queue Length, LogicalDisk (_Total) \ Avg., Disk Write Queue Length. |
| Await (The number of milliseconds required to respond to requests) | The average, Latency, in Windows does not produce this value, is calculated from the others, parameters, add a column, the parameter is needed. |
| Svctm (The number of milliseconds spent servicing, requests, from beginning to end) | The time to complete the request. Add a separate column for Linux machines, useful |
| % Util (The percentage of CPU time during which requests were issued) | "\ Processor (_total) \%, Processor Time", let the load on the CPU be (add a column), from which the disk subsystem overload is indirectly understandable. |
Linux elevator
Now about the values for elevator / scheduler :
By default, it is set to cfq or deadline :
cat /sys/block/sda/queue/scheduler noop anticipatory deadline [cfq] It is recommended to set it to noop :
echo noop > /sys/block/sda/queue/scheduler cd /sys/block/sda/queue grep .* * scheduler:[noop] deadline cfq To make the settings permanent, add “ elevator = noop ” to the kernel boot parameters in the /etc/grub.conf file, they will be applied to all block devices. Or add the appropriate script to /etc/rc.local in order to flexibly set up settings for each individual block device.
Sample script installation scheduler in noop for sdb
Do not forget to change sdb to the name of your block device.
cat /etc/rc.local | grep -iv "^exit" > /tmp/temp echo -e "echo noop > /sys/block/sdb/queue/scheduler\nexit 0" >> /tmp/temp cat /tmp/temp > /etc/rc.local; rm /tmp/temp Sysctl Settings with Virtual Memory Operation
It should be experienced to find the most optimal values of the virtual memory of the OS - sysctl parameters: vm.dirty_background_ratio , vm.dirty_ratio and vm.swappiness .
Check sysctl values
sysctl -a | grep dirty vm.dirty_background_bytes = 0 vm.dirty_background_ratio = 10 vm.dirty_bytes = 0 vm.dirty_expire_centisecs = 3000 vm.dirty_ratio = 20 vm.dirty_writeback_centisecs = 500 sysctl -a | grep swappiness vm.swappiness = 60 So, for one customer, the most optimal values for RedHat enterprice Linux 6 with NetApp storage systems with SSD cache and FC 8G connection were: vm.dirty_ratio = 2 and vm.dirty_background_ratio = 1 , which significantly reduced the load on the host CPU . To check the optimal settings of the Linux host, use the Linux Host Validator and Configurator utility. When testing the SnapDrive utility for Linux (or other Unix-like) OSs, use the SnapDrive Configuration Checker for Unix . Learn more about the selection of optimal parameters vm.dirty * look here . In the case of using the Oracle database or virtualization, inside such a Linux machine it is recommended to set the value vm.swappiness = 0 . This value will only allow swap to be used when the physical memory actually runs out, which is optimal for such tasks .
Set sysctl values
sysctl -w vm.dirty_background_ratio=1 sysctl -w vm.dirty_ratio=2 echo vm.dirty_background_ratio=1 >> /etc/sysctl.conf echo vm.dirty_ratio=2 >> /etc/sysctl.conf #for Guest VMs or Oracle DB sysctl -w vm.swappiness=0 echo vm.swappiness=0 >> /etc/sysctl.conf #Reload data from /etc/sysctl.conf sudo sysctl –p I / O queue size or length of I / O queue on HBA
The default value is usually 128 , it must be manually selected. Increasing the queue length makes sense for random I / O operations that generate many disk seek operations on the disk subsystem. We change it like this:
echo 100000 > /sys/block/[DEVICE]/queue/nr_requests Sometimes changing this parameter may fail to give results , for example, in the case of InnoDB (due to the peculiarities of this application, which itself optimizes the data before it is written) or in case of an increase in the parameter above the default when working with SSD drives (since they do not disk seek operations).Guest OS
In some cases, VMFS shows better performance than RDM . So in some tests with FC 4G you can get 300 MByte / sec using VMFS and about 200 MByte / sec with RDM .
File system
FS can make significant adjustments when testing performance.
The size of the FS block should be a multiple of 4KB. For example, if we run a synthetic load similar to the generated OLTP , where the size of the operated block is on average 8KB, then we put 8KB. I also want to note that as a file system itself, its implementation for a specific OS and version can greatly influence the overall performance picture. So for when writing 10 MB blocks in 100 streams with the dd file command from the database on the UFS file system located on the LUN , the FC 4G with FAS 2240 data storage and 21 + 2 SAS 600 10k disks in one unit showed a speed of 150 MB / s, while however, the ZFS configuration showed two times more FS (approaching the theoretical maximum of the network channel), and the Noatime parameter didn’t affect the situation at all.
Noatime on Khost
At the file system level, you can configure the parameter when installing noatime and nodiratime , which will not allow updating the access time to files, which often has a very positive effect on performance. For FSs such as UFS, EXT3, and others. One of the customers installing noatime when mounting an ext3 file system on Red Hat Enterprise Linux 6 greatly reduced the load on the host CPU .
Loading table
For Linux machines, you need to select the disk geometry when creating a LUN : " linux " (for machines without xen) or " xen " if Linux LVM with Dom0 is installed on this moon.
Misalignment
For any OS, when creating LUNs , in the storage settings, select the correct geometry. In the case of an incorrectly specified size of the FS block, an incorrectly specified LUN geometry, the MBR / GPT parameter that is not correctly selected on the host, we will observe at peak loads messages in the NetApp FAS console about a certain " LUN misalignment" event. Sometimes these messages may appear erroneously, in the case of their rare appearance just ignore them. You can check this by running the lun stats command on the storage system .
NetApp Host Utilities
Do not ignore this item. The toolkit sets the correct delays, queue size for HBAs, and other settings on the host. Install Host Utilities after installing the drivers. Displays the connected LUNs and their detailed information from the storage side. The set of utilities is free and can be downloaded from the Netta technical support website. After installation, run the utility.
host_config <-setup> <-protocol fcp|iscsi|mixed> <-multipath mpxio|dmp|non> [-noalua] She is to be
/ opt / netapp / santools /
After that, most likely, you will need to restart the host.
NetApp Linux Forum
Don't forget to search for more information and ask your questions at https://linux.netapp.com/forum .
Applications
Depending on the configuration, protocols, loads, and infrastructure, your applications may have different tuning and fine tuning recommendations. To do this, contact the Best Practice Guide for the appropriate applications for your configuration. The most common may be
- NetApp SnapManager for Oracle & SAN network
- Oracle DB on Clustered ONTAP , NetApp for Oracle Database , Best Practices for Oracle Dataset , SnapManager for Oracle
- Oracle VM
- DB2 , DB2 and FlexClone , Deploying an IBM DB2 Multipartition Database
- Mysql
- NetApp and MySQL Infrastructure for Web 2.0 / LAMP
- Red Hat Enterprise Linux 6, KVM
- Lotus Domino 8.5 for Linux
- Citrix xenserver
- Deploying Red Hat Enterprise Linux OpenStack Platform 4 on NetApp Clustered Data ONTAP
- and etc.
Drivers
Do not forget to install the drivers for your HBA adapter (by compiling them for your kernel) before you install the NetApp Host Utility. Follow the recommended HBA adapter settings. Often, you need to change the queue length and timeout for optimal interaction with NetApp. If you are using VMware ESXi or other virtualization, do not forget to enable NPIV if you need to forward virtual HBA adapters inside the virtual machine. Some NPIV- based adapters can be configured for QoS , such as the Qlogic HBA 8100 series .
Compatibility
Make extensive use of the compatibility matrix in your practice to reduce potential problems in the data center infrastructure.
I am sure that over time, I will have something to add to this article on optimizing the Linux host, so look here from time to time.
I ask to send messages on errors in the text to the LAN .
Notes and additions on the contrary please in the comments
Source: https://habr.com/ru/post/245357/
All Articles