Wintering cacti with online temperature control
For many years, as a wife became fascinated with the cultivation of cacti, and yet she could not manage to arrange for them to winter properly. The fact is that for cacti it is very important that they survive the winter at a temperature of 5 to 15 ° C - not lower, not to die, and not higher, not to decide that it is already spring. I would like to share with you how I managed to create an Arduino temperature control system with online control via Dropbox with very affordable means.
Starting materials
- Arduino Uno with breadboard
- Chip temperature sensor LM35
- Heaterblow type heater
- Chinese extension cord
- Mechanical relay (5 V per coil for 220 V control circuit)
- Old laptop
Heater and relay
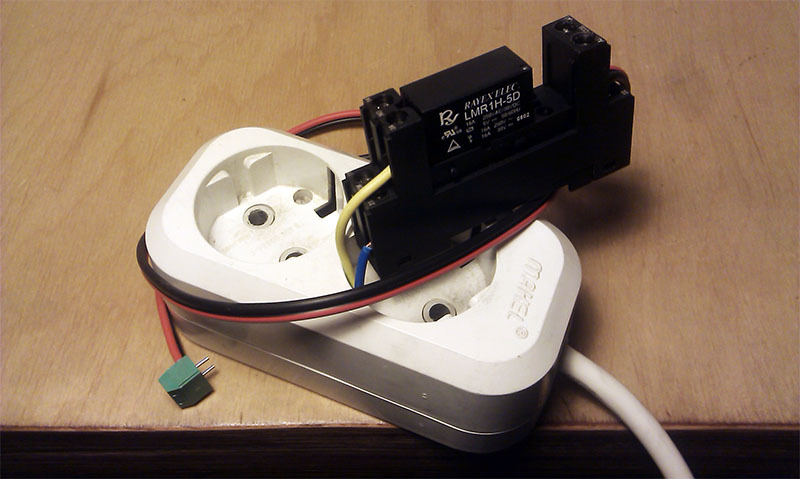
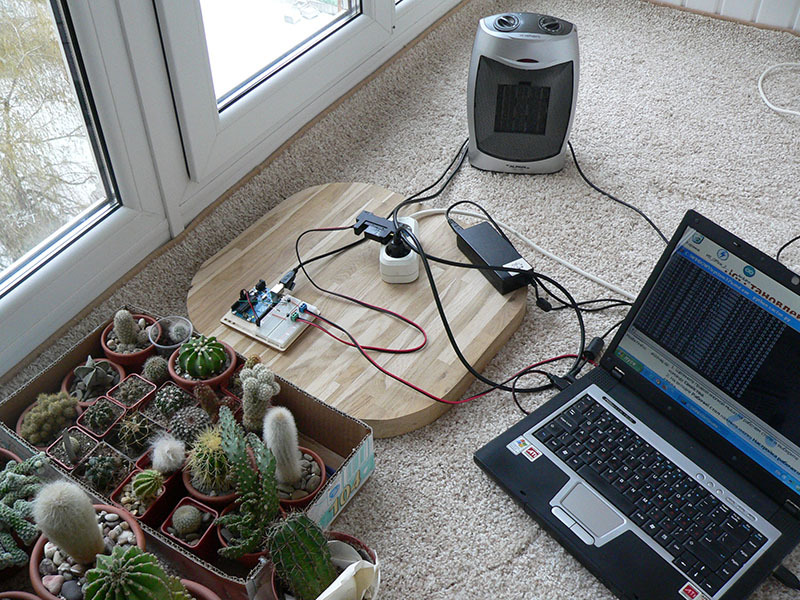
A winter house is organized on a balcony where the sun does not fall, so there is always cool there. If the temperature falls below a predetermined threshold, then the heater, which I connected to the Arduino via a mechanical relay, must be turned on. In order not to disassemble the heater, I modified the Chinese extension cord:
')
- Cut and unused an unused piece of "earth" wire from both sides
- I connected this wire to the bus instead of one of the “active” wires.
- Stretched the ends of both wires through the inner hole and connected them to the relay on the front of the extension cord
- Connect control cables to the relay with a convenient terminal.
Now Arduino can control a heater connected via an extension cord!
Stages of modification of the extension cord in the relay (photo)
Schematic diagram
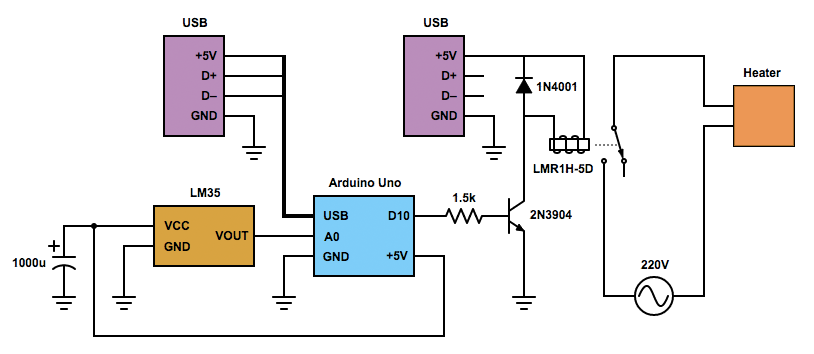
Arduino Uno board is connected via USB to an old laptop. As a temperature sensor, I used the LM35 chip, which linearly displays the ambient temperature and voltage.
A separate power supply is needed to power the relay, since the coil's rated current of 110 mA is close to the Arduino Uno's current output limit. The first time, I still used the power from the Arduino Uno , but the readings of the temperature meter went off each time the relay was turned on, so I arranged the power through a separate USB connection.
The heater is connected to an extension cord, the extension cord is connected to the power supply. When the relay is turned on, the heater starts warming immediately, but at low power, so as not to frighten cacti with sudden temperature changes.
Program
The program for the Arduino once per second polls the temperature sensor and outputs the temperature value via a serial interface. In addition to the instantaneous temperature value, the program outputs the averaged value and the state vector: heater control mode (always on / always off / automatic) and the temperature range for the automatic mode. In this mode, the program turns on the heater when the temperature drops below the first preset threshold, and turns it off when it rises above the second preset threshold.
Program for Arduino
/////////////////////////////////////////////////////////////////////////////// // Cactus Tracker v1.0.1 / December 8, 2014 // by Maksym Ganenko <buratin.barabanus at Google Mail> /////////////////////////////////////////////////////////////////////////////// const int PIN_HEATER = 10; const int DELAY_MS = 1000; const int MAGIC = 10101; const float TEMP_MAX = 20.0; enum { OFF = 0, ON, AUTO }; int mode = AUTO; float tempAverage = NAN; bool heater = false; float heaterFrom = 5.f; float heaterTo = 10.f; void startHeater() { digitalWrite(PIN_HEATER, HIGH); heater = true; } void stopHeater() { digitalWrite(PIN_HEATER, LOW); heater = false; } void setup() { Serial.begin(9600); digitalWrite(PIN_HEATER, LOW); pinMode(PIN_HEATER, OUTPUT); analogReference(INTERNAL); for (int i = 0; i < 100; ++i) { analogRead(A0); } } void loop() { float tempMV = float(analogRead(A0)) / 1024 * 1.1; float tempCurrent = tempMV / 10e-3; if (isnan(tempAverage)) { tempAverage = tempCurrent; } else { tempAverage = tempAverage * 0.95f + tempCurrent * 0.05f; } if (Serial.available()) { if (Serial.parseInt() == MAGIC) { int newMode = Serial.parseInt(); float newHeaterFrom = Serial.parseFloat(); float newHeaterTo = Serial.parseFloat(); if (newMode >= OFF && newMode <= AUTO && newHeaterFrom < newHeaterTo) { mode = newMode; heaterFrom = newHeaterFrom; heaterTo = newHeaterTo; stopHeater(); } } } bool overheat = tempAverage >= TEMP_MAX; if (!overheat && (mode == ON || (mode == AUTO && tempAverage <= heaterFrom))) { startHeater(); } if (overheat || mode == OFF || (mode == AUTO && tempAverage >= heaterTo)) { stopHeater(); } Serial.print("mode = "); Serial.print(mode); Serial.print(", tempCurrent = "); Serial.print(tempCurrent); Serial.print(", tempAverage = "); Serial.print(tempAverage); Serial.print(", heater = "); Serial.print(heater); Serial.print(", heaterFrom = "); Serial.print(heaterFrom); Serial.print(", heaterTo = "); Serial.println(heaterTo); delay(DELAY_MS); } /////////////////////////////////////////////////////////////////////////////// On an old laptop, there is Python with the pySerial library installed . A Python program connects to Arduino via a serial interface and every ten minutes adds the average temperature and device state vector to the cactuslog.txt file. The log also includes the exact time on and off the heater. If the program detects the command file cactuscmd.txt , then the contents of this file are sent to Arduino several times through a serial interface, and the file itself is renamed to cactusini.txt . This batch file is executed once when the program starts, so if there is a power outage and a system reboot, then through this file it will restore its original state.
Python program for an old laptop
############################################################################### # Cactus Tracker v1.0.1 / December 8, 2014 # by Maksym Ganenko <buratin.barabanus at Google Mail> ############################################################################### import serial, re import sys, os, traceback from datetime import datetime # arduino serial port in your system SERIAL = (sys.platform == "win32") and "COM4" or "/dev/tty.usbmodem1421" # input / output files INIFILE = "cactusini.txt" CMDFILE = "cactuscmd.txt" LOGFILE = "cactuslog.txt" # log update period in seconds UPDATE_PERIOD_SEC = 600 ############################################################################### def execute(cmdfile, **argv): if os.path.isfile(cmdfile): try: # input fcmd = open(cmdfile) stream.write(((fcmd.read().strip() + " ") * 10).strip()) fcmd.close() if "renameTo" in argv: dstfile = argv["renameTo"] if os.path.isfile(dstfile): os.remove(dstfile) os.rename(cmdfile, dstfile) except: traceback.print_exc() if fcmd and not fcmd.closed: fcmd.close() firstRun = True fcmd, flog, timemark, lastState = None, None, None, None stream = serial.Serial(SERIAL, 9600) while True: s = stream.readline() if "mode" in s: record = dict(re.findall(r"(\w+)\s+=\s+([-.\d]+)", s)) mode, temp = int(record["mode"]), float(record["tempAverage"]) heater = int(record["heater"]) heaterFrom = float(record["heaterFrom"]) heaterTo = float(record["heaterTo"]) state = (mode, heater, heaterFrom, heaterTo) if firstRun: execute(INIFILE) firstRun = False execute(CMDFILE, renameTo = INIFILE) timeout = not timemark or \ (datetime.now() - timemark).seconds > UPDATE_PERIOD_SEC if timeout or state != lastState: output = (datetime.now(), temp, mode, heater, heaterFrom, heaterTo) output = "%s,%.2f,%d,%d,%.1f,%.1f" % output try: # output flog = open(LOGFILE, "a") flog.write(output + "\n") except: traceback.print_exc() if flog: flog.close() print output timemark = datetime.now() lastState = state ############################################################################### Visualization and Dropbox
The whole project fits in one folder added to Dropbox . One Python program running on an old laptop connected to the Arduino , and works with logs and commands as local files. Another Python program is launched from the same folder on any computer and creates a simple HTTP server with the specified address and port. You will need to install several libraries for Python: SciPy and dateutil .
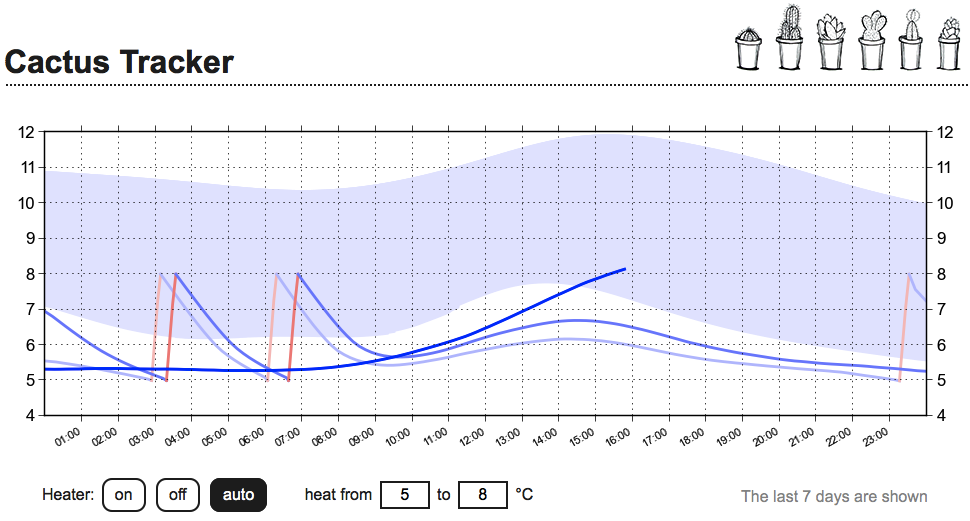
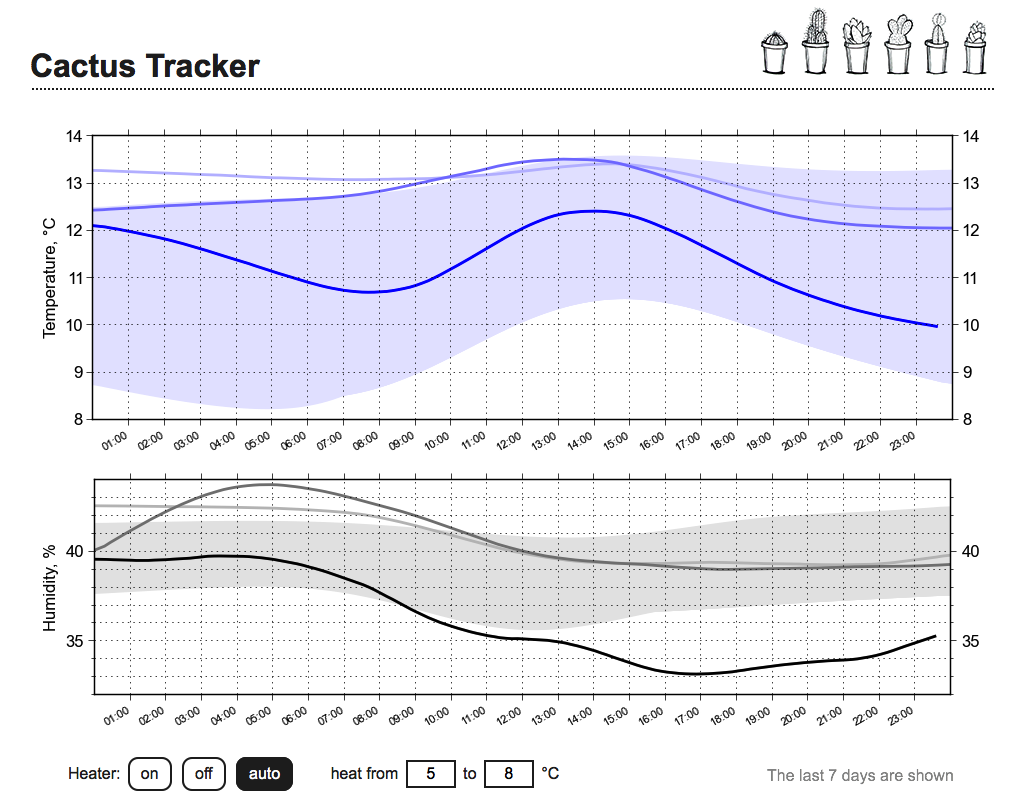
By running the second program, you can monitor the temperature in the zimovnik directly from the browser! The generated page displays:
- smoothed temperature graph for the last three days
- temperature limits for the last week
- heater activation periods
- current mode of the system with the possibility of changing
Check the chart again
Thanks to Dropbox , this project can be launched not only at home, but also, for example, at the cottage. Dropbox itself will synchronize all files, and the programs are written as if they deal only with local files. The only thing you will need to take care of a possible power outage and restart the computer.
Python program to display and control the winte
######################################################################################### # Cactus Tracker v1.0.5 / January 11, 2015 # by Maksym Ganenko <buratin.barabanus at Google Mail> ######################################################################################### import io, os, re, traceback import BaseHTTPServer, urlparse, base64 import dateutil.parser import matplotlib, numpy from matplotlib import pylab from matplotlib.ticker import AutoMinorLocator from matplotlib.colors import rgb2hex from datetime import datetime, timedelta from itertools import groupby HOST = "stepan.local" PORT = 8080 USERNAME = "cactus" PASSWORD = "forever" LOGFILE = "cactuslog.txt" CMDFILE = "cactuscmd.txt" FONT = "Arial" FONT_SIZE = 12 STATS_DAYS_NUM = 7 SMOOTH_WINDOW = 9 CURVE_ALPHA = [1.0, 0.5, 0.25, 0.1] MAGIC = 10101 # time difference in seconds between real time and log time LOG_TIME_OFFSET_SEC = 3600 OFF, ON, AUTO = 0, 1, 2 ######################################################################################### class CactusHandler(BaseHTTPServer.BaseHTTPRequestHandler): def do_GET(self): if not self.authorize(): return url = urlparse.urlparse(self.path) query = urlparse.parse_qs(url.query) pending, smooth = False, SMOOTH_WINDOW if "mode" in query and "hfrom" in query and "hto" in query: pending = True try: mode = int(query["mode"][0]) heaterFrom = float(query["hfrom"][0]) heaterTo = float(query["hto"][0]) self.update_params(mode, heaterFrom, heaterTo) except: traceback.print_exc() if "smooth" in query: try: smooth = int(query["smooth"][0]) except: traceback.print_exc() if self.path in [ "/cactus.png", "/favicon.ico" ]: self.send_image(self.path) else: self.send_page(pending, smooth) self.wfile.close() def authorize(self): if self.headers.getheader("Authorization") == None: return self.send_auth() else: auth = self.headers.getheader("Authorization") code = re.match(r"Basic (\S+)", auth) if not code: return self.send_auth() data = base64.b64decode(code.groups(0)[0]) code = re.match(r"(.*):(.*)", data) if not code: return self.send_auth() user, password = code.groups(0)[0], code.groups(0)[1] if user != USERNAME or password != PASSWORD: return self.send_auth() return True def send_auth(self): self.send_response(401) self.send_header("WWW-Authenticate", "Basic realm=\"Cactus\"") self.send_header("Content-type", "text/html") self.end_headers() self.send_default() self.wfile.close() return False def send_default(self): self.wfile.write(""" <html> <body style="background:url(data:image/png;base64,{imageCode}) repeat;"> </body> </html>""".format(imageCode = "iVBORw0KGgoAAAANSUhEUgAAAAYAAAAGCAYAAADgzO9IAAA" + "AJ0lEQVQIW2NkwA7+M2IR/w8UY0SXAAuCFCNLwAWRJVAEYRIYgiAJALsgBgYb" + "CawOAAAAAElFTkSuQmCC")) def address_string(self): host, port = self.client_address[:2] return host def update_params(self, mode, heaterFrom, heaterTo): if max(mode, heaterFrom, heaterTo) >= MAGIC: print "invalid params values" return fout = open(CMDFILE, "w") fout.write("%d %d %.1f %.1f" % (MAGIC, mode, heaterFrom, heaterTo)) fout.close() def send_image(self, path): filename = os.path.basename(path) name, ext = os.path.splitext(filename) fimage = open(filename) self.send_response(200) format = { ".png" : "png", ".ico" : "x-icon" } aDay = timedelta(days = 1) now = datetime.now().strftime('%a, %d %b %Y %H:%M:%S GMT') expires = (datetime.now() + aDay).strftime('%a, %d %b %Y %H:%M:%S GMT') self.send_header("Content-type", "image/" + format[ext]) self.send_header("Cache-Control", "public, max-age=" + str(aDay.total_seconds())) self.send_header("Date", now) self.send_header("Expires", expires) self.send_header("Content-length", os.path.getsize(filename)) self.end_headers() self.wfile.write(fimage.read()) fimage.close() def fix_time(self, X): time = X[0].timetuple() if time.tm_hour == 0 and time.tm_min <= 11: X[0] -= timedelta(seconds = time.tm_min * 60 + time.tm_sec) time = X[-1].timetuple() if time.tm_hour == 23 and time.tm_min >= 49: offset = (60 - time.tm_min - 1) * 60 + (60 - time.tm_sec - 1) X[-1] += timedelta(seconds = offset) def make_smooth(self, Y, winSize): winSize = min(winSize, len(Y) - 2) if winSize == 0: return list(Y) Y = [ 2 * Y[0] - foo for foo in reversed(Y[1:winSize + 1]) ] + list(Y) \ + [ 2 * Y[-1] - foo for foo in reversed(Y[-winSize - 1:-1]) ] window = numpy.ones(winSize * 2 + 1) / float(winSize * 2 + 1) Y = numpy.convolve(Y, window, 'same') Y = Y[winSize:-winSize] return list(Y) def send_page(self, pending, smooth): self.send_response(200) self.send_header("Content-type", "text/html") self.end_headers() data, flog = [ ], None nowDate = datetime.now().date() while not flog: try: flog = open(LOGFILE) except: traceback.print_exc() mode, heater, heaterFrom, heaterTo = AUTO, 0, 5, 10 for s in flog: row = tuple(s.strip().split(",")) offset = timedelta(seconds = LOG_TIME_OFFSET_SEC) date = dateutil.parser.parse(row[0]) + offset temp = float(row[1]) if len(row) == 3: heater = int(row[2]) elif len(row) >= 3: mode, heater = int(row[2]), int(row[3]) heaterFrom, heaterTo = float(row[4]), float(row[5]) data.append((date, temp, heater)) stats = [ ] matplotlib.rc("font", family = FONT, size = FONT_SIZE) fig = pylab.figure(figsize = (964 / 100.0, 350 / 100.0), dpi = 100) ax = pylab.axes() for date, points in groupby(data, lambda foo: foo[0].date().isoformat()): X, Y, H = zip(*points) deltaDays = (nowDate - X[0].date()).days if deltaDays >= STATS_DAYS_NUM: continue if len(X) == 1: continue # convert to same day data alpha = CURVE_ALPHA[min(len(CURVE_ALPHA) - 1, deltaDays)] tempColor = rgb2hex((1 - alpha, 1 - alpha, 1)) heaterColor = rgb2hex((1, 1 - alpha, 1 - alpha)) X = [ datetime.combine(nowDate, foo.time()) for foo in X ] self.fix_time(X) if deltaDays < len(CURVE_ALPHA) - 1: # make smooth and draw start = 0 for heater, group in groupby(zip(Y, H), lambda foo: foo[1]): finish = start + len(list(group)) XS = X[start:finish + 1] if heater: YS = Y[start:finish + 1] elif finish + 1 - start < smooth: winSize = (finish + 1 - start) / 2 YS = self.make_smooth(Y[start:finish + 1], winSize) else: YS = self.make_smooth(Y[start:finish + 1], smooth) pylab.plot(XS, YS, linewidth = 2, color = heater and heaterColor or tempColor) start = finish else: for i in range(3): Y = self.make_smooth(Y, smooth) self.fix_time(X) stats.append((X, Y)) # plot stats curve if deltaDays == len(CURVE_ALPHA) - 1: X0, Y0 = stats.pop(0) for curve in stats: X1, Y1 = curve pylab.fill(X0 + list(reversed(X1)), Y0 + list(reversed(Y1)), color = tempColor) ax.xaxis_date() ax.xaxis.set_major_formatter(matplotlib.dates.DateFormatter("%H:%M")) ax.xaxis.set_major_locator(matplotlib.dates.HourLocator()) ax.yaxis.get_major_locator().set_params(integer = True, nbins = 11) ax.xaxis.grid(True, "major") ax.yaxis.grid(True, "major") ticks = ax.yaxis.get_major_locator().bin_boundaries(*ax.get_ylim()) if len(ticks) >= 2 and round(ticks[1] - ticks[0]) > 1: step = int(round(ticks[1] - ticks[0])) ax.yaxis.grid(True, "minor") ax.yaxis.set_minor_locator(AutoMinorLocator(n = step)) ax.tick_params(axis = "both", which = "both", direction = "out", labelright = True) ax.tick_params(axis = "x", which = "major", labelsize = 8) ax.grid(which = "major", alpha = 1.0) fig.autofmt_xdate() pylab.tight_layout() image = io.BytesIO() pylab.savefig(image, format = "png") pylab.clf() image.seek(0) graph = "<img src='data:image/png;base64,%s'/>" % \ base64.b64encode(image.getvalue()) image.close() pending = pending or os.path.isfile(CMDFILE) self.wfile.write(re.sub(r"{\s", r"{{ ", re.sub(r"\s}", r" }}", """ <html> <head> <title>Cactus Tracker</title> <meta http-equiv="refresh" content="{pending};URL='/'"> <style> body { font-family: {font}, sans-serif; font-size: {fontSize}pt; width: 964px; margin: 47px 30px 0 30px; padding: 0; background-color: white; color: #262626; } h1 { font-size: 24pt; margin: 0; padding-bottom: 4px; border-bottom: 2px dotted #262626; margin-bottom: 26px; } p { margin-left: 38px; margin-bottom: 20px; } input { font-family: {font}, sans-serif; font-size: {fontSize}pt; border: 2px solid #262626; padding: 2px 6px; } button { font-family: {font}, sans-serif; font-size: {fontSize}pt; padding: 4px 8px; border: 2px solid #262626; border-radius: 10px; background-color: white; color: #262626; margin: 0 3px; } form { display: inline-block; margin: 0; } .selected, button:hover:not([disabled]) { cursor: pointer; background-color: #262626; color: white; } .selected:hover { cursor: default; } .heater { width: 50px; text-align: center; margin: 0 3px; } .pending { opacity: 0.5; } .hidden { display: none; } </style> </head> <body> <h1>Cactus Tracker</h1> <div>{graph}</div> <table style="width: 100%;" cellspacing=0 cellpadding=0> <tr> <td align=left> <form action="/" class="{transparent}"> <p>Heater: <button type="submit" name="mode" class="{modeOn}" value="1" {disabled}> on </button> <button type="submit" name="mode" class="{modeOff}" value="0" {disabled}> off </button> <button type="submit" name="mode" class="{modeAuto}" value="2" {disabled}> auto </button> <input type="hidden" name="hfrom" value="{heaterFrom:.0f}"/> <input type="hidden" name="hto" value="{heaterTo:.0f}"/> </form> <form action="/" class="{transparent} {heaterAuto}"> <span style="margin-left: 30px;"> <input type="hidden" name="mode" value="{mode}"/> heat from <input name="hfrom" class="heater" maxlength=2 value="{heaterFrom:.0f}" {disabled}/> to <input name="hto" class="heater" maxlength=2 value="{heaterTo:.0f}" {disabled}/> °C <button type="submit" style="visibility: hidden;" {disabled}></button> </span> </form> </td> <td style="opacity: 0.5;" align=right> <span style="margin-right: 40px;">The last {days} days are shown</span> </td> </tr> </table> </div> <div style="position: absolute; top: 7px; left: 760px;"> <img src="cactus.png"> </div> </body> </html> """)).format( font = FONT, fontSize = FONT_SIZE, days = STATS_DAYS_NUM, graph = graph, mode = mode, heaterFrom = heaterFrom, heaterTo = heaterTo, modeOff = (mode == OFF) and "selected" or "", modeOn = (mode == ON) and "selected" or "", modeAuto = (mode == AUTO) and "selected" or "", pending = pending and "20" or "1200", disabled = pending and "disabled=true" or "", transparent = pending and "pending" or "", heaterAuto = (mode != AUTO) and "hidden" or "")) ######################################################################################### server = BaseHTTPServer.HTTPServer((HOST, PORT), CactusHandler) server.serve_forever() ######################################################################################### Links
/ \ / \ / \ / \ / \ / \ / \ / \ / \ / \ \ \ \ \ \ \ \ \ \ \ \ \ \ \ \ \ \ \ \ \ \ \ \ \ \ \ \ \ \ \ \ \ / \ / \ / \ / \ / \ / \ / \ / \ / \ / \ \ \ \ \ \ \ \ \ \ \ \ \ \ \ \ \ \ \ \ \ \ \ \ \ \ \ \ \ \ \ \ \ / \ / \ / \ / \ / \ / \ / \ / \ / \ / \ \ \ \ \ \ \ \ \ \ \ \ \ \ \ \ \ \ \ \ \ \ \ \ \ \ \ \ \ \ \ \ \ / \ / \ / \ / \ / \ / \ / \ / \ / \ / \ \ \ \ \ \ \ \ \ \ \ \ \ \ \ \ \ \ \ \ \ \ \ \ \ \ \ \ \ \ \ \ \ / \ / \ / \ / \ / \ / \ / \ / \ / \ / \ \ \ \ \ \ \ \ \ \ \ \ \ \ \ \ \ \ \ \ \ \ \ \ \ \ \ \ \ \ \ \ \ / \
UPDATE
- Translated the project to Arduino Nano , which greatly improved the aesthetics and conciseness of the assembly
- Added a digital humidity sensor DHT-22 . At the same time, I made sure that the temperature measured by the sensor is approximately equal to the readings of LM35 , which remained the main temperature sensor.
- I discovered the reason why the temperature sensor reads when the heater was turned on: the relay current raised the sensor ground. Corrected by using two different controller ground inputs for a relay and a sensor. The second power is no longer needed!
- Significantly improved graph smoothing algorithm
Source: https://habr.com/ru/post/245285/
All Articles