Do not worry, we will look after them. Integration of Zabbix into the client’s personal account
Tantum possumus quantum scimus
Perhaps everyone will agree - monitoring is one of the most important components of the IT infrastructure.
You need to know about the status of your charges, because you really do not want to "suddenly" find a scattered RAID, clogged up to the top of the root partition or LA that exceeds all reasonable limits.
Tools, for continuous monitoring of equipment life, everyone chooses.
Someone like Nagios, someone chooses Munin, as well as there are fans of proprietary or other solutions.
We, creating a monitoring service for our customers, chose Zabbix.
But it is not enough just to connect the server to the monitoring, you need to organize the relationship with the ticket system and the user's personal account. In addition to informing about the presence of a problem, automatically create a request to the technical support service, to respond to the incident as soon as possible, and also notify the client additionally by email.
')
Under Habrokat we will tell how we did it.
Description.
A little dwell on the procedure for connecting the service.
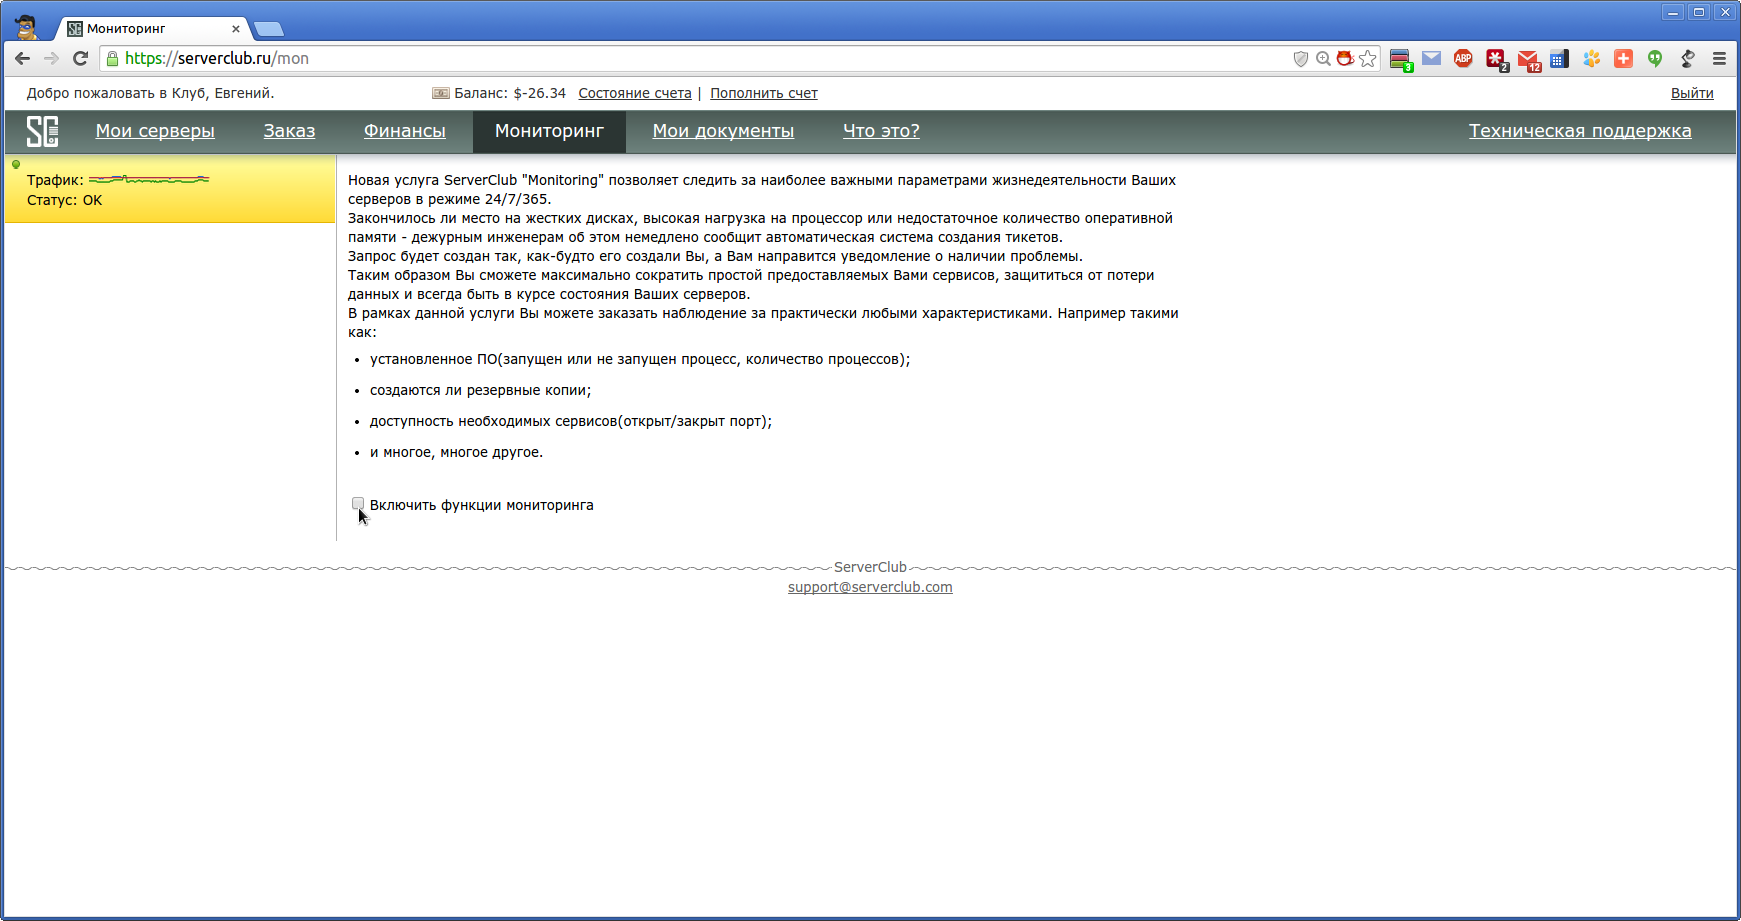
First of all, you need to select the Monitoring tab.
Read the description of the service and connect it.
Out of the box, the most important, in our opinion, important parameters are available for selection.

Click on "Settings" to set the desired thresholds and notification options.
Thresholds can be set from 10% to 90% in 10% increments.
It is also possible to customize notification options.

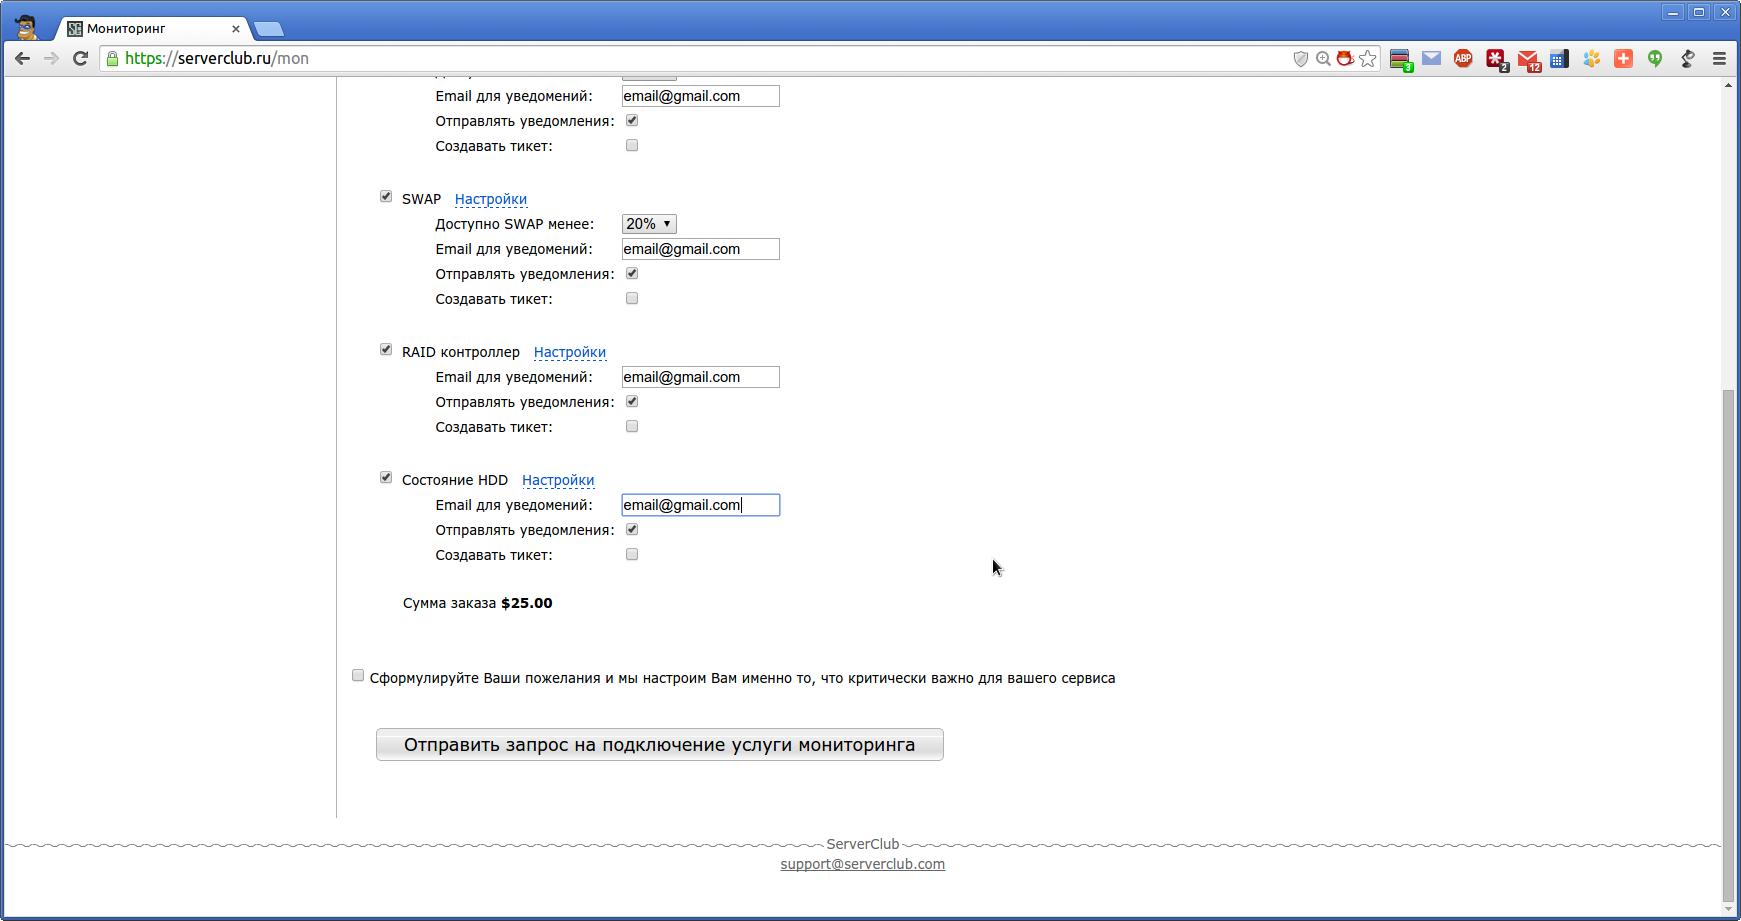
What if the set of predefined metrics does not fully comply with the monitoring requirements?
In this case, it is possible to send your wishes via a special form and then we set up monitoring of the server (s) exactly as the client needs.

For system administrators, an application for service connection and ticket is created, where the client can additionally discuss the details and control the connection.

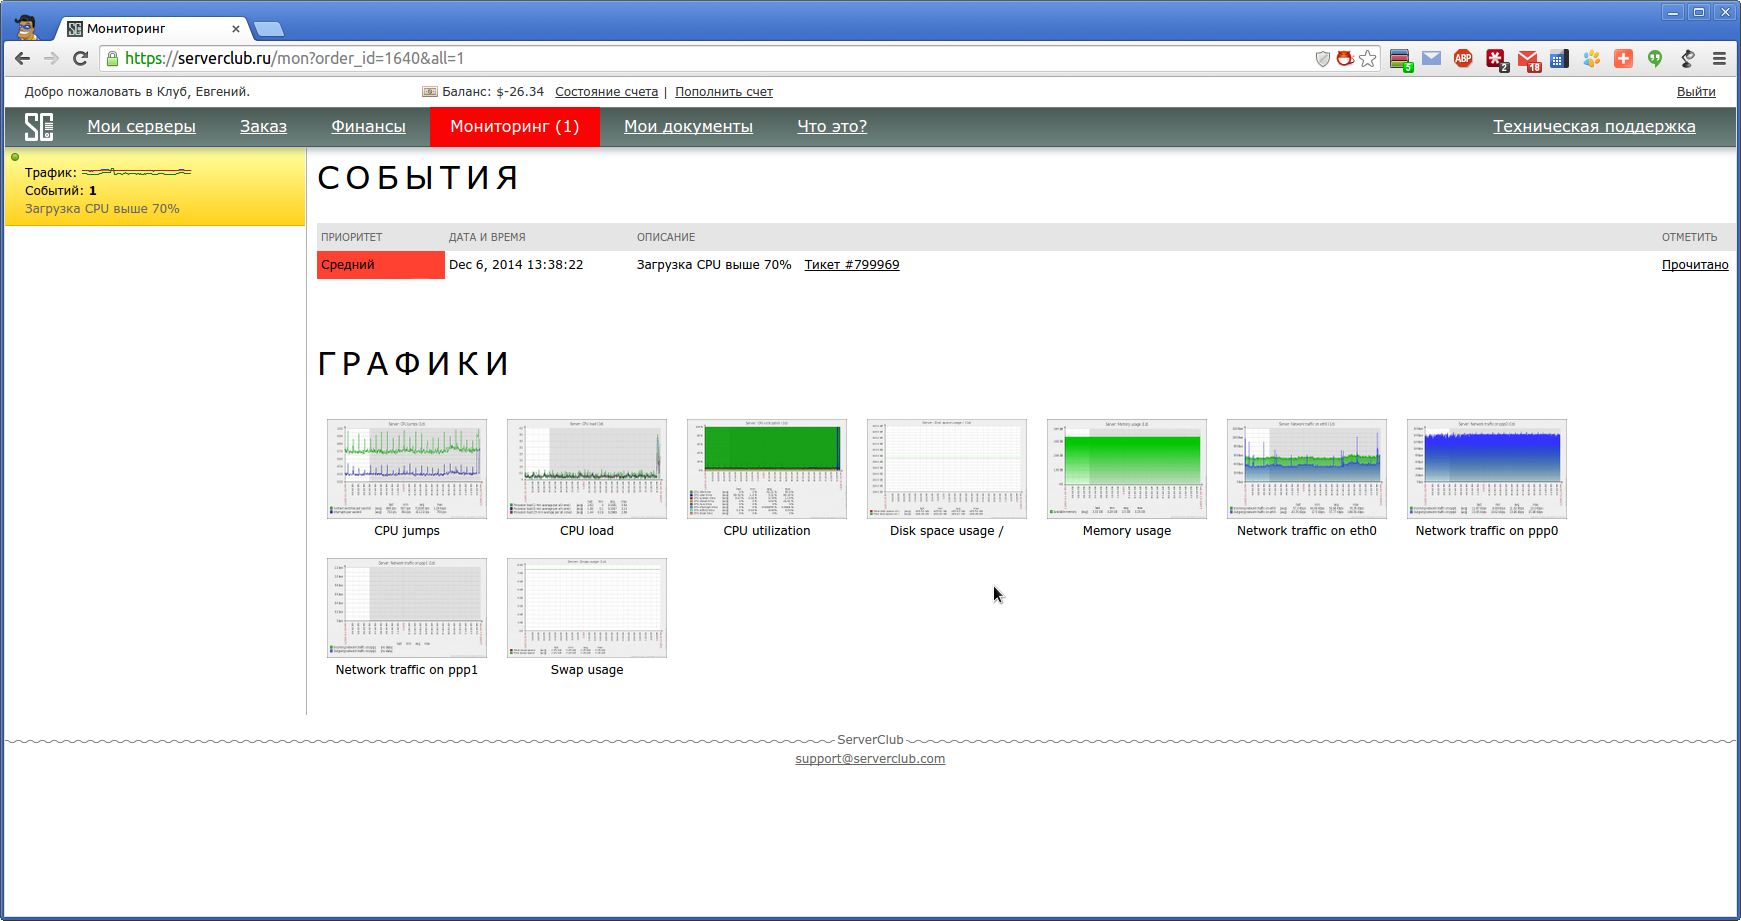
When the threshold values specified earlier are exceeded, the monitoring system reports a problem by highlighting the Monitoring tab in your account in red.
It also sends a notification email to the client and creates a ticket for engineers on duty (if the corresponding checkboxes have been checked).
Clicking on the link "Read" disable the color display.
After the description of the triggered trigger, a link to the ticket in the technical support system is indicated, where you can clarify the details with the engineer on duty.
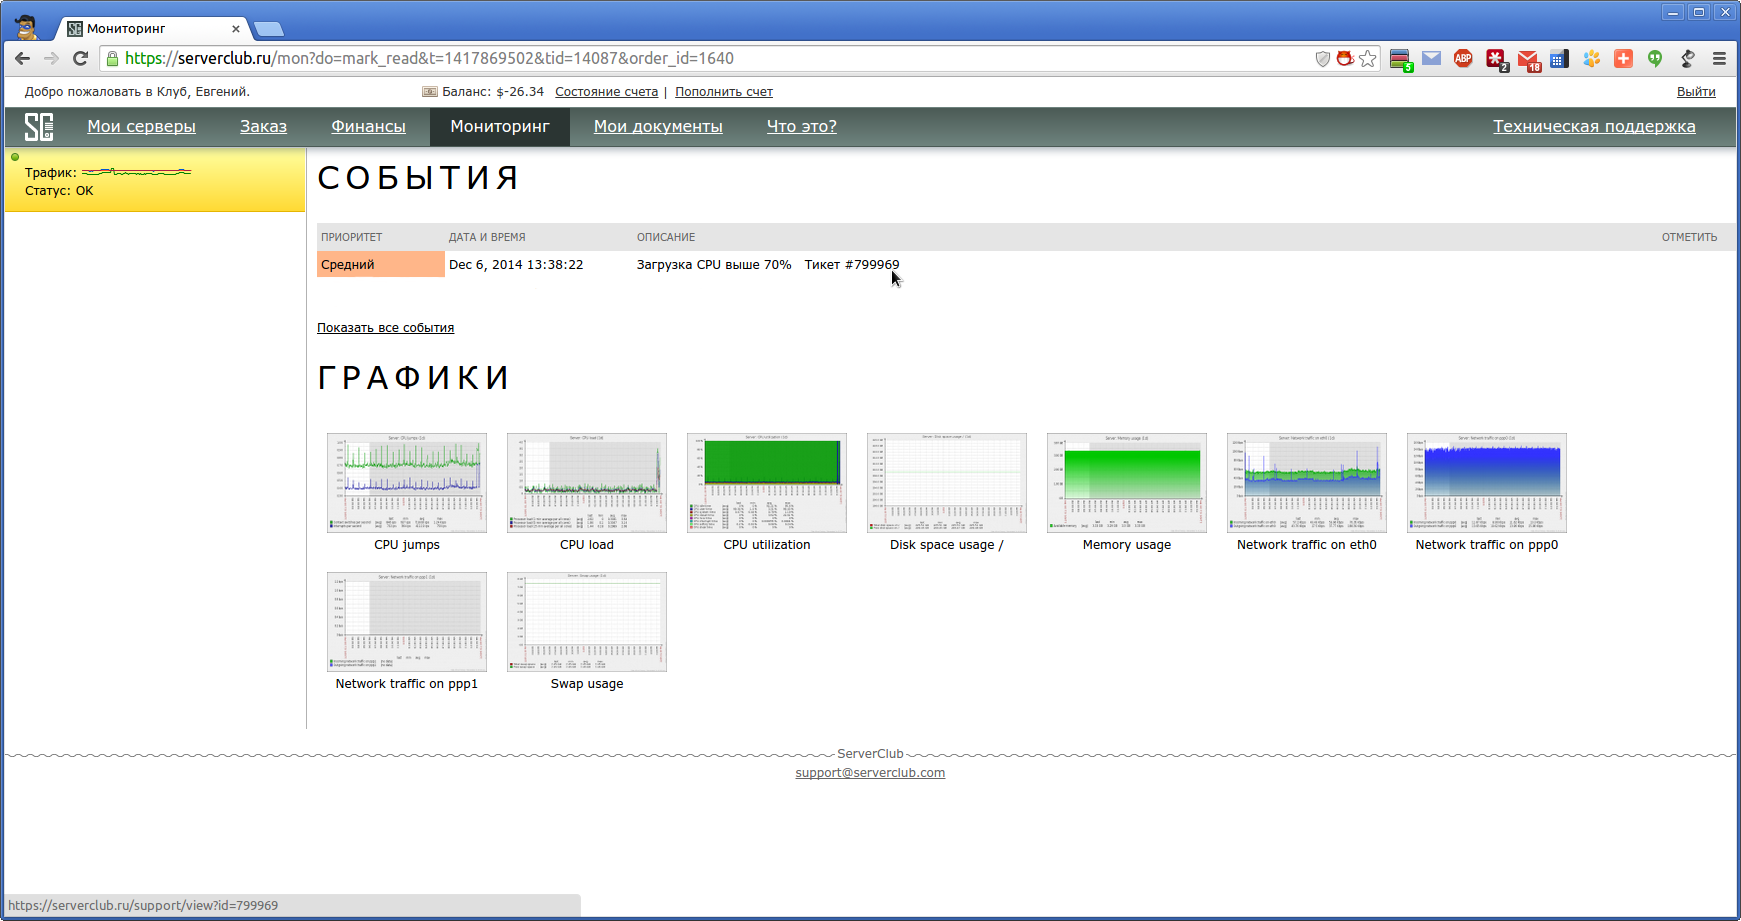
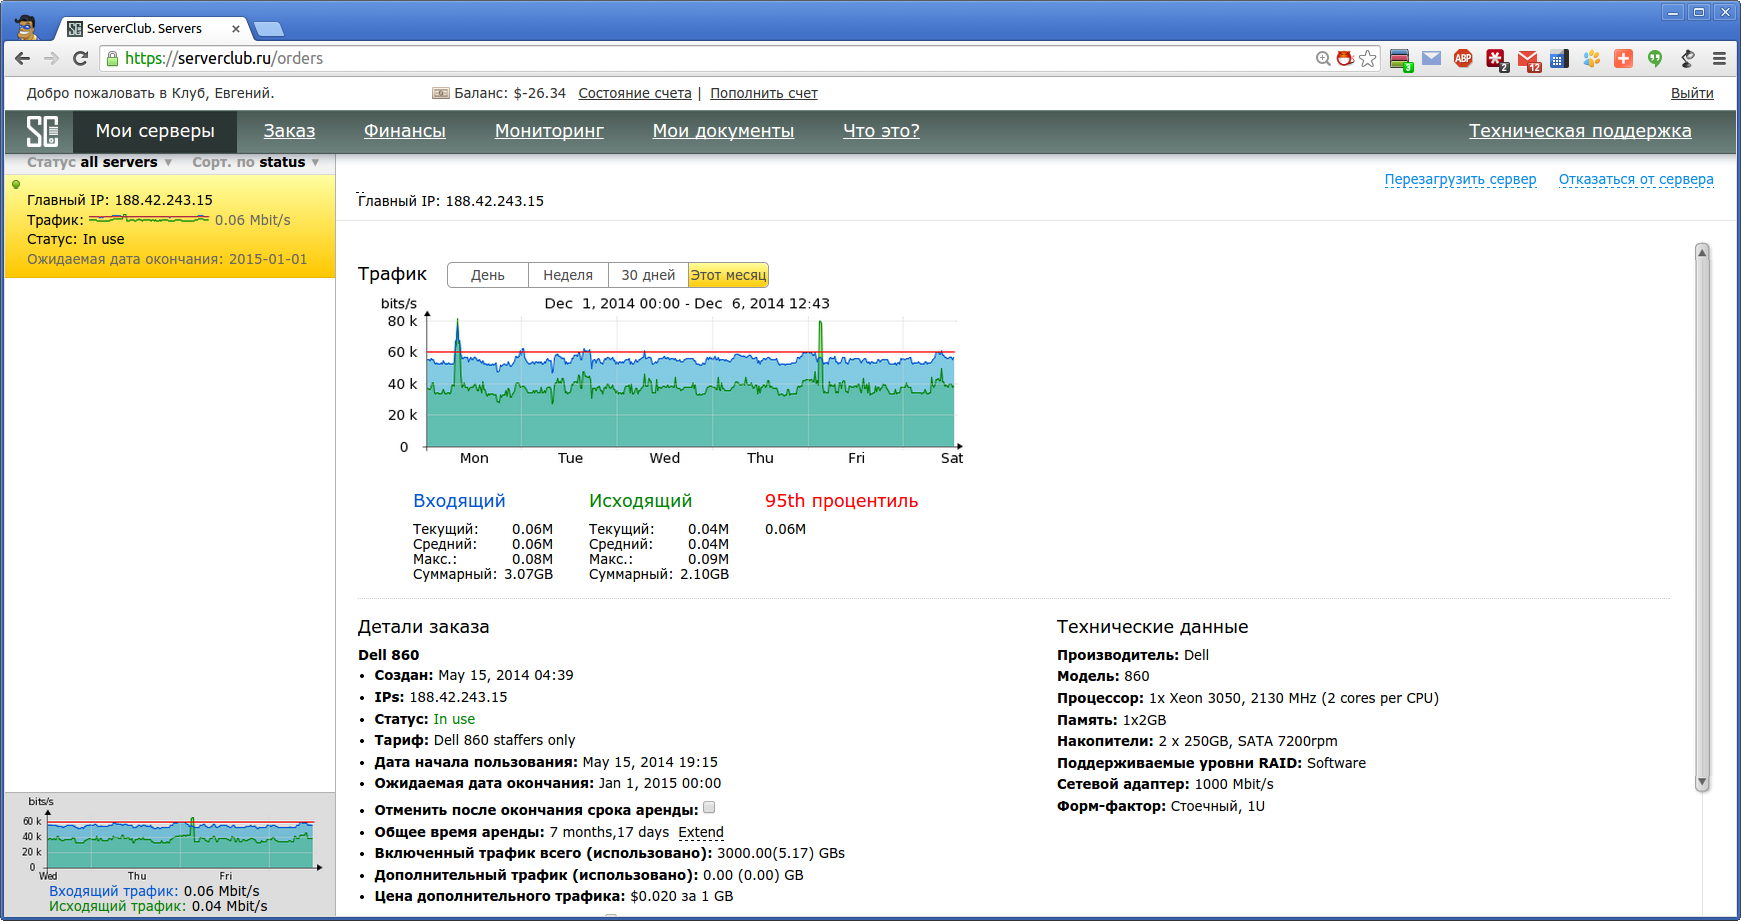
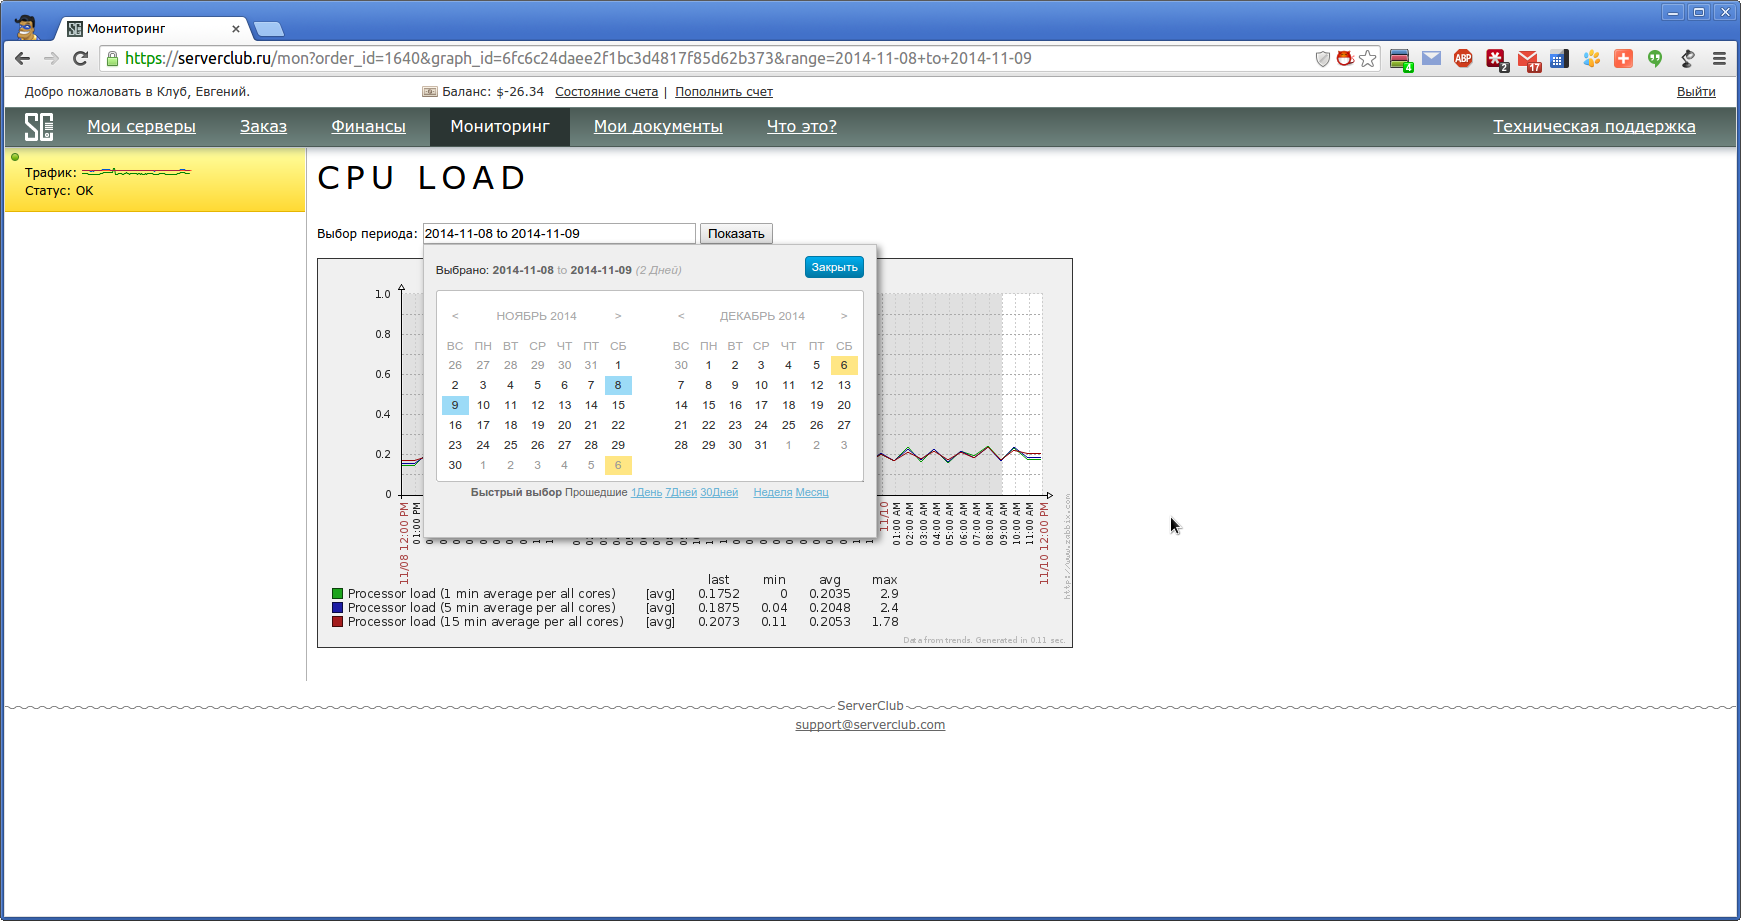
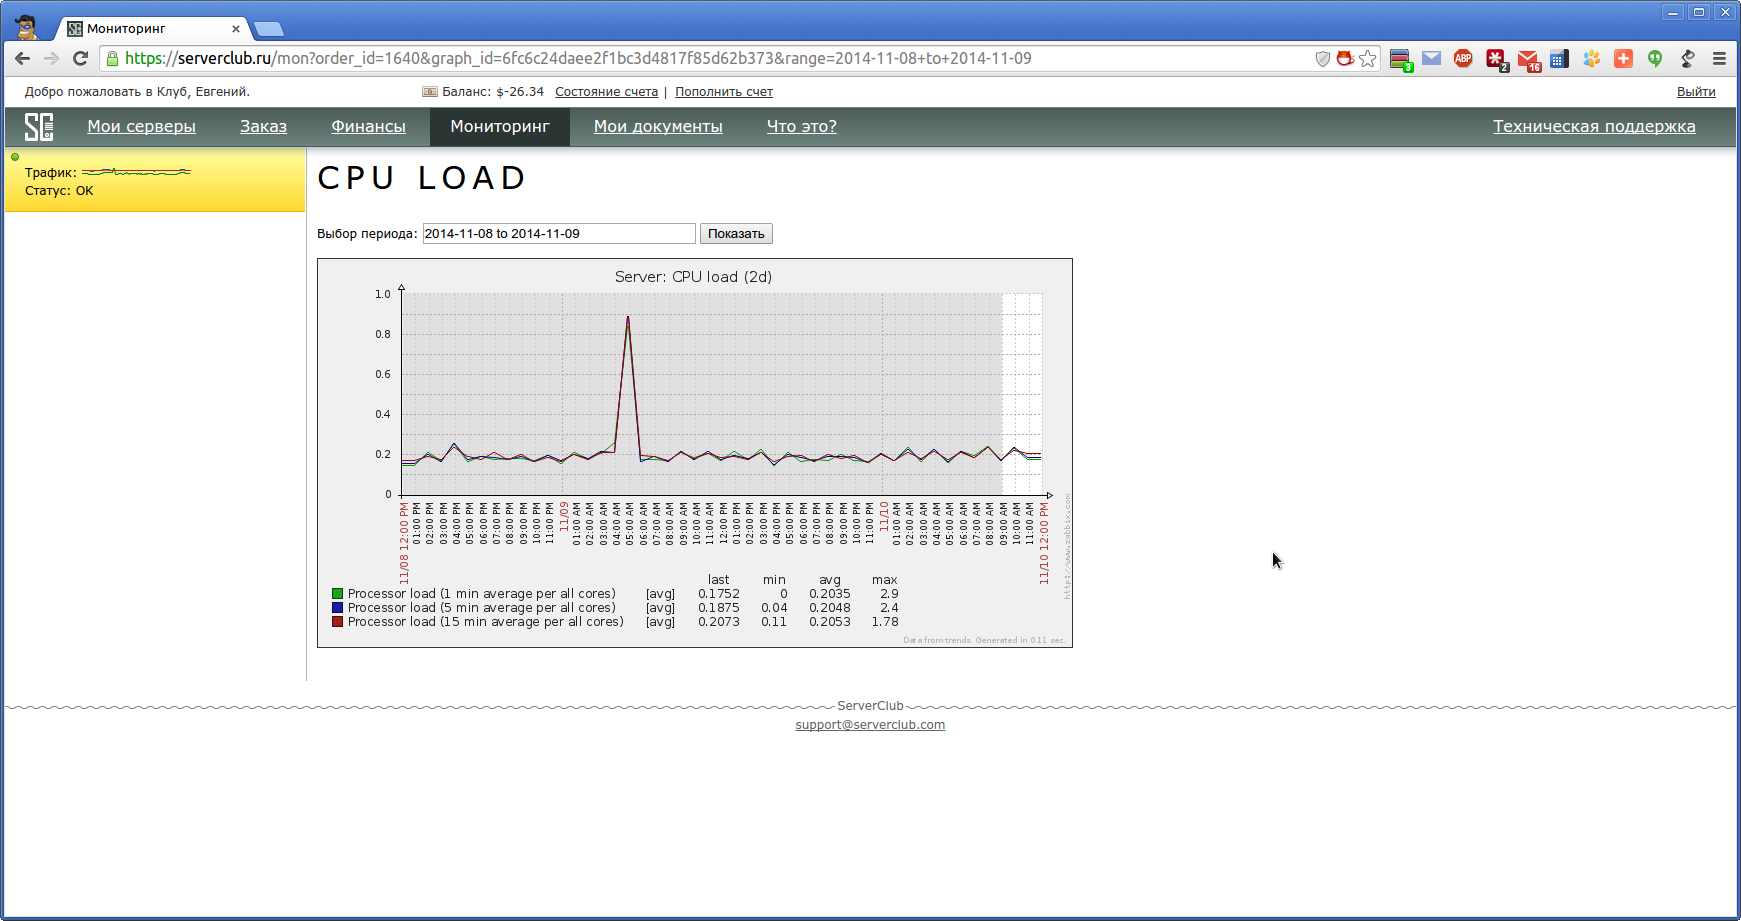
For each of the graphs available to view data in the context of the desired period of time.
Technical part.
To integrate with our admin panel, we used the class found in the githab open spaces.
The choice criterion was the ability to receive graphics images (there is no such functionality in the API) and the simplicity of the class implementation.
Several others were written in such a way that it was not clear - this is for working with an API or for launching a spacecraft.
This class is designed for Zabbix versions up to 2.2, so I had to modify it a bit. We added the features we needed, corrected the authorization for the 2.4 versions used by us and some parameters in ZabbixAPI calls.
We also changed the script for creating graphics in zabbix, so that you can cut out the extra data and insert your title.
Data exchange goes via http / https, the API returns the json object as an array.
Charts are taken somewhat more cunning - as if the browser is emulated, i.e. the script through curl is authorized login / password and with the given cookie downloads png-shku with the schedule.
The graphs pictures (and their previews) are stored in redis, with a lifetime of 1 hour, if the graph was not updated, for example, they chose a different date or 1 minute passed from the last show of graphs to the user in the personal account, this was done to prevent the user from working at all zabbix creating images with each page refresh.
Images are formed with each unique request, i.e. if the user does not enter into monitoring, then the system does not twitch about the graphs.
All requests to Zabbix are hidden by keys based on md5 hashing with salt. Query parameters are also stored in redis and are not accessible to the user, i.e. specific parameters and links to the monitoring server are not visible.
The cron script once per minute checks all active triggers and records the date and time of the start of the event and the date and time when the check showed that such a trigger is no longer active (only the triggers selected when connecting the service are logged).
Depending on the selected events, the trigger sends a message to the user about the new active trigger and the triggers that he has not yet marked as read in the personal account and / or a trigger with a text of the trigger and / or the “Monitoring” menu blinks.
In Zabbix itself, the trigger templates in the description are set as “scm_ID trigger threshold%”, for example “scm_CPU 70%”, due to which, after ordering, the script itself can find the trigger ID (unique for each host and variant of trigger), and this makes it easy to replace the description “ scm_CPU 70% "on" CPU load more than 70% "or" CPU load above 70%. "
Our admin panel shows all available schedules, triggers and events for this host, and the user can turn them on / off at any time.
Templates for monitoring some specific things were created from scratch, or the ones found were modified, the default templates were also slightly corrected for our specifics.
If there is interest, we will be happy to share with the community.
That's all !
We thank you for your attention!
Source: https://habr.com/ru/post/245119/
All Articles