The slowest x86 instruction
Everyone knows and loves the x86 assembler. Most of its instructions are performed by a modern processor in units or fractions of nanoseconds. Some operations that are decoded into a long sequence of microcode, or awaiting memory access can run much longer — up to hundreds of nanoseconds. This post is about champions. The hit parade of four instructions under the cut, but for those who are too lazy to read the entire text, I will write here that the main villain is [memory] ++ under certain conditions.
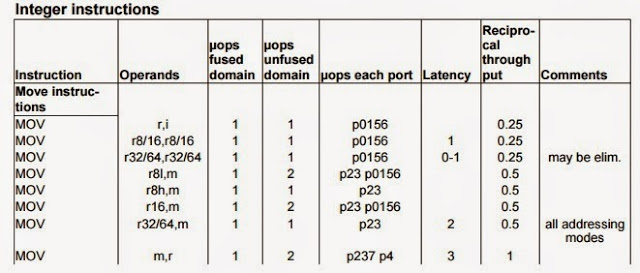
The KDV is taken from the document by Agner Foh, which, along with two documents from Intel (optimization guide and architecture software development manual), contains many useful and interesting topics.
To begin with, there are commands that are expected to be executed within microseconds. For example, IN, OUT or RSM (return from SMM). VMEXIT has greatly accelerated in recent years, and microsecond fractions last on microprocessors. There is MWAIT, which by definition is executed as long as possible. In general, there are many “heavy” instructions in ring 0, consisting entirely of microcode — WRMSR, CPUID, setting control registers, etc. The examples I give below can be performed with the privileges of ring 3, that is, in any ordinary program. Even C programming is not necessary - virtual machines of some popular languages are able to generate code containing these operations. These are not some special processor commands, but ordinary instructions, sometimes under special conditions.
')
Since they are executed for a long time, any sane profiler will detect them with the usual time profiling, if, of course, they are found in a fairly “hot” code. There are also separate performance counters (PMU registers) that respond exclusively to such cases, with their help you can find these operations in a large program, even if they do not take a lot of absolute time (just why?). The most popular tools for this are Vtune and Linux perf. You can also use PCM , but it will not show where the instruction is.
Villain number four. The x86 command (in fact, x87), which can run for almost 700 clock cycles - FYl2X. Calculates the binary logarithm multiplied by the second operand. There is no analogue in SSE, so it is still found in nature. There is no special counter.
Villain number three. Perhaps a slightly artificial example, but often used. Fortunately, mostly in the drivers.
The MFENCE command (or its subsets - LFENCE, SFENCE. By the way, LFENCE + SFENCE! = MFENCE). If a long memory operation or PCIe write was performed before MFENCE, for example, an operation with non-temporal (MOVNTI, MOVNTPS, MASKMOVDQU, etc.) or operand located in the write through / write combined memory area, then the “fence” itself It will take almost a microsecond or longer. A performance counter for this situation exists, but is not in the processor core, but in “uncore”, it is easier to work with it through PCM.
Villain number two. Here is a very simple code.
What do you think about what time will be? (It doesn't matter if this code is compiled into x87 or scalar SSE). This single instruction will be executed in 1-2 microseconds. This is the so-called denormal operation, a special case that is handled by a long microcode sequence. It is caught easily, the PMU register - the performance counter is called FP_ASSIST.ALL. By the way, it is clear that measuring the difference in TSC when executing one (or even several dozen) instructions is almost always meaningless. This case is an exception, we measure a long microcode.
The main villain.
Well, and the bonus - unlike other participants of the parade hit, this code will force all other cores to also stop for a smoke break for a period of several thousand cycles.
This is also caught with Vtune, perf, PCM, etc. using the LOCK_CYCLES.SPLIT_LOCK_UC_LOCK_DURATION counter. The example may seem far-fetched, but over the past year I have encountered this problem with my clients twice. In one of the cases, LOCK_CYCLES.SPLIT_LOCK_UC_LOCK_DURATION went off scale during initialization of a huge program written in .net. I didn’t figure out then, rantatime or the client’s code put the mutex so badly, but the performance dropped seriously - another independent program running on a different core slowed down thirty times.
Does anyone know even a slower instruction? (REP MOV not offer).
The KDV is taken from the document by Agner Foh, which, along with two documents from Intel (optimization guide and architecture software development manual), contains many useful and interesting topics.
To begin with, there are commands that are expected to be executed within microseconds. For example, IN, OUT or RSM (return from SMM). VMEXIT has greatly accelerated in recent years, and microsecond fractions last on microprocessors. There is MWAIT, which by definition is executed as long as possible. In general, there are many “heavy” instructions in ring 0, consisting entirely of microcode — WRMSR, CPUID, setting control registers, etc. The examples I give below can be performed with the privileges of ring 3, that is, in any ordinary program. Even C programming is not necessary - virtual machines of some popular languages are able to generate code containing these operations. These are not some special processor commands, but ordinary instructions, sometimes under special conditions.
')
Since they are executed for a long time, any sane profiler will detect them with the usual time profiling, if, of course, they are found in a fairly “hot” code. There are also separate performance counters (PMU registers) that respond exclusively to such cases, with their help you can find these operations in a large program, even if they do not take a lot of absolute time (just why?). The most popular tools for this are Vtune and Linux perf. You can also use PCM , but it will not show where the instruction is.
Villain number four. The x86 command (in fact, x87), which can run for almost 700 clock cycles - FYl2X. Calculates the binary logarithm multiplied by the second operand. There is no analogue in SSE, so it is still found in nature. There is no special counter.
Villain number three. Perhaps a slightly artificial example, but often used. Fortunately, mostly in the drivers.
The MFENCE command (or its subsets - LFENCE, SFENCE. By the way, LFENCE + SFENCE! = MFENCE). If a long memory operation or PCIe write was performed before MFENCE, for example, an operation with non-temporal (MOVNTI, MOVNTPS, MASKMOVDQU, etc.) or operand located in the write through / write combined memory area, then the “fence” itself It will take almost a microsecond or longer. A performance counter for this situation exists, but is not in the processor core, but in “uncore”, it is easier to work with it through PCM.
Villain number two. Here is a very simple code.
 double fptest = 3000000000.0f;  // Same with float.
 // TSC1
 int inttest = 2 + fptest;
 // TSC2
 time = TSC2 - TSC1;
What do you think about what time will be? (It doesn't matter if this code is compiled into x87 or scalar SSE). This single instruction will be executed in 1-2 microseconds. This is the so-called denormal operation, a special case that is handled by a long microcode sequence. It is caught easily, the PMU register - the performance counter is called FP_ASSIST.ALL. By the way, it is clear that measuring the difference in TSC when executing one (or even several dozen) instructions is almost always meaningless. This case is an exception, we measure a long microcode.
The main villain.
 static unsigned char array [128];
 for (int i = 0; i <64; i ++) if ((int) (array + i)% 64 == 63) break;
 lock = (unsigned int *) (array + i);
 for (i = 0; i <1024; i) * (lock) ++;  // prime
 // TSC1
    asm volatile (
     "lock xaddl% 1, (% 0) \ n"
     : // no output
     : "r" (lock), "r" (1));
    // or in Windows, just InterlockedIncrement (lock);
 // TSC2
 time = TSC2 - TSC1;
Well, and the bonus - unlike other participants of the parade hit, this code will force all other cores to also stop for a smoke break for a period of several thousand cycles.
This is also caught with Vtune, perf, PCM, etc. using the LOCK_CYCLES.SPLIT_LOCK_UC_LOCK_DURATION counter. The example may seem far-fetched, but over the past year I have encountered this problem with my clients twice. In one of the cases, LOCK_CYCLES.SPLIT_LOCK_UC_LOCK_DURATION went off scale during initialization of a huge program written in .net. I didn’t figure out then, rantatime or the client’s code put the mutex so badly, but the performance dropped seriously - another independent program running on a different core slowed down thirty times.
Does anyone know even a slower instruction? (REP MOV not offer).
Source: https://habr.com/ru/post/244565/
All Articles