Principles of Business Application Monitoring
Greetings to all readers! Today I would like to talk about the basic principles of monitoring business applications that are used daily by many companies around the world. The concept of "business application" should be understood as a software package that provides support for a particular business process of a company.
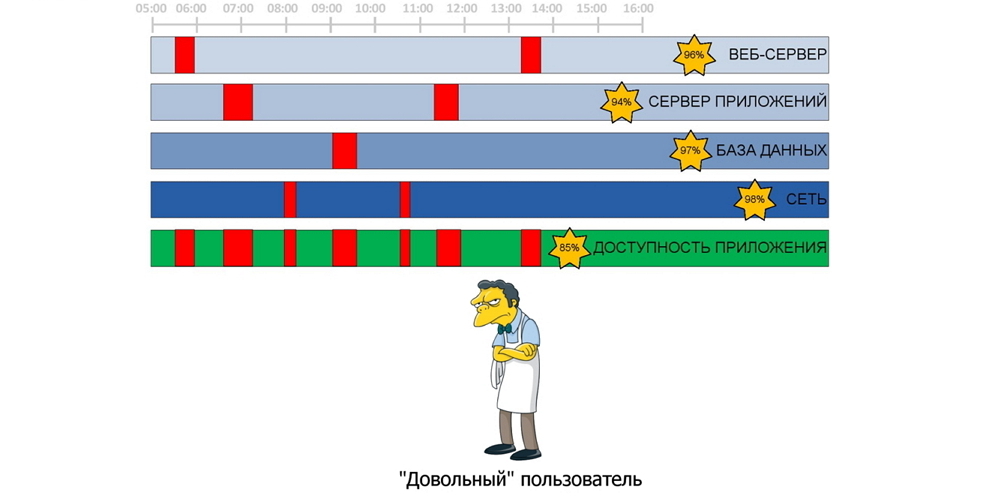
The most typical example of a modern application architecture is the so-called. "Three Star", i.e. a web server, an application server, and a database server; therefore, each of these components will have a little less than full effect on the operation of the entire application. If we consider just such a configuration, then from my own experience I can say that most often a situation arises that looks like this in an exaggerated way:
')
Periods of unavailability or poor performance of a component are projected onto the overall accessibility of the application that the user feels on himself: i.e. even though the current application systems can provide their availability greatly in 90%, the overall performance of the entire business application may not even reach 90%. In the real world, the picture above may look somehow different, but the essence is always the same - it is the unpredictability of the nature of the influence of the smallest problems with application components on the entire software complex as a whole. Below is an analysis of what, how and why, please under the cat.
In any company, situations arise when certain periods of inaccessibility of one of the application links eventually result in periods of poor performance or complete inaccessibility of the user web interface (read, the main functionality of the application). If the IT landscape of a company is complex, it can be very difficult to figure out which layer is the source of the problem and who to ask for its solution. If we return to the visualization of such a thing, then all this can be depicted as follows:
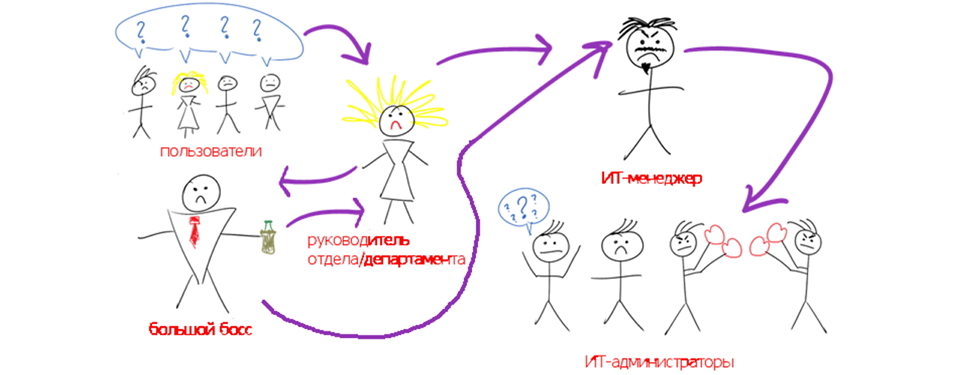
The situation is lose-lose, i.e. everybody loses. Users feel that IT does not understand them, the line manager uses IT and the most important boss, who sends rays of indignation to the IT manager, to solve a specific situation. An IT manager with mixed feelings goes to his administrators who are trying to blame each other, providing the results of their monitoring systems (or the work of handwritten scripts) and further, on and on. In general, this situation can last for quite a long time, as long as the problem resolves itself at best, or all IT administrators will come to an agreement to conduct diagnostics each in their system and finally find the root cause. According to the experience of communication with the customer, I can say that there is still such a scenario, when it was not possible to do anything on my own (due to insufficient expertise or other objective reasons), and the vendor’s case has the appropriate software that can stretch out quite indefinitely.
There is another point at which I will dwell in more detail. Any application system requires monitoring, and not always the company has something industrial for this. In such a situation, in most cases, the administrator will be helped out by the built-in butt monitoring mechanism, and in case of his absence, this could be a well-proven script that runs on a regular basis. It’s great that the administrator uses tools that are convenient and understandable for him, and now let's assume that a planetary-scale ahtung arose (a radical degradation of the application’s performance or its complete unavailability). At the same time, the script launch mechanism decided for some time not to be executed and calmly to smoke aside. As a result, waving screenshots in front of the CIO confirming that there was monitoring after all, but the script issued an exception and the scheduler stumbled, it might not be the best idea. Built-in monitoring is good because it takes into account the features of the application, but again, the application owner may not be very comfortable collecting diverse information from all administrators and reporting to management on the continuity of the business process that the application supports. In my opinion, application system administrators should not waste their valuable time on supporting the monitoring system; they should shift this functionality to specially trained employees within the company or to an external contractor.
What can be done to create win-win situations? So that big bosses do not have additional questions on the topic “what are you doing, so that this does not happen again,” and you, as a person from IT (or a manager for the availability of such and such services), do not worry again, you should have timely information the status of all components of the systems involved in the main (and not so) business of the company. Preferably on a large LCD-TV, preferably with large clear signatures, color indication (a la red-yellow-green) and, somewhere near, a list of names in front of the service names. And it would be great to click the mouse on the service (which is colored, for example, in red) and find out on which link the problem occurred. Thus, we came to the idea of a single (and it could be an umbrella) monitoring system that covers all parts of a business application using standard monitoring modules (of course, there is always the opportunity to use custom scripts along with standard tools, or use a different tool or industrial monitoring system). Below is an example of the so-called heat map, i.e. service maps:
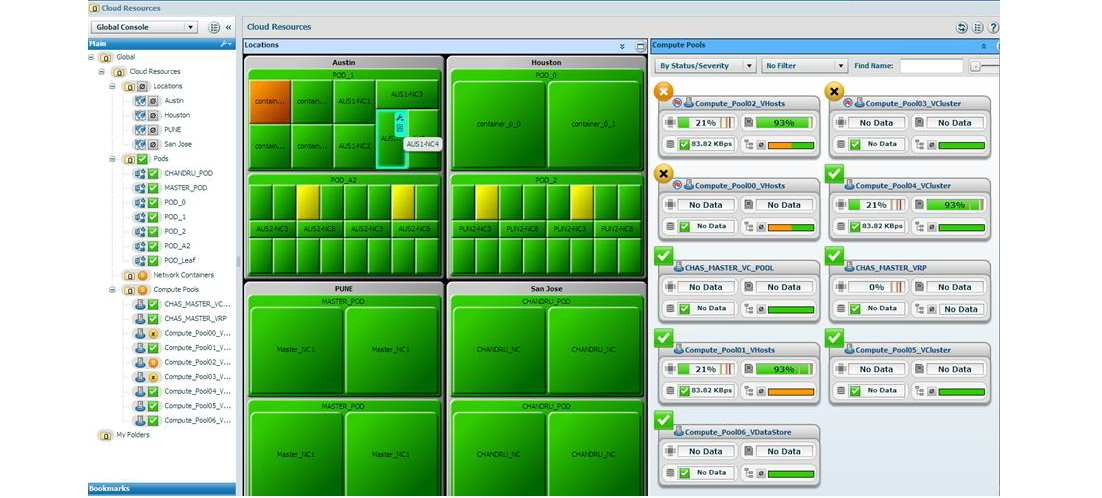
Thus, IT staff or a business service manager have the opportunity to literally “keep abreast” and at any time have an idea of where the problem arose, and who you can find out about the timing of the decision in order to report to users or leadership. Such monitoring is very useful when you perform maintenance work on a large number of applications (or their components) and want to make sure that everything has recovered successfully after a reboot, because spending the rest of the night (well, after all, such work is most often carried out at night) on manual verification of the whole "zoo" would not be entirely rational.
The current level of industrial monitoring systems allows for deep monitoring and even counting the level of accessibility of a business application. This can be especially important when the IT department provides a business with a set of services (or services) for which a service level agreement (SLA) has been concluded. The monitoring system will allow you to generate reports with the necessary detail, allow you to accumulate statistics and understand which components of a business application are not sufficiently productive, and, in the end, will allow the business to at least somehow understand how well IT service is provided. But you will have the most complete picture of the operation of the application, if at a certain frequency on an average workstation you do what the user does. About this below.
Finally, we turn to the question of monitoring a business application from the user's point of view; without this, it’s nowhere at all. It is clear that end users are most sensitive to performance degradation or unavailability of the application, and it would be the most preferable option to “see” with their eyes. Hiring people who will, for example, arrange bank transactions and sit with a stopwatch, measuring the response time of the same Siebel web interface, is not the best thing to do. The best option in this case would be to write a special algorithm (synthetic transaction) that will launch the browser, authorize the application, and transfer the conditional amount of 1 ruble from one account to another. Especially for dear readers, I wrote a browser transaction (there are also transactions with heavy customers) using the example of one well-known online store. It measures the elapsed time for each step — the initial loading of the page into the browser, the time it takes to authorize the user, the time to search for the product, and interstitial redirects and transitions — plus the success of each step and transaction as a whole is checked.
The system allows you to control that specific images have been downloaded, it is also possible to recognize text from a page (OCR method), compare it with something, or simply write it, for example, in a database. You can get transaction timing, i.e. At each step, a timer is started, which measures its execution time and checks for success, so that the application owner can understand at what step the failure occurred.
It turns out that if the conditional user declares to you that everything in your application is slow and buggy, you can provide the results of such transactions and explain that his case is unique and is happening in perfect isolation from reality :) Seriously, providing such performance graphs will help you get rid of unnecessary activities to find user-made problems.
In the end, we have a tool that allows you to receive information about the existence of a problem at a very early stage (even before users start contacting customer support). The success / failure of the transaction (or its availability) monitoring system can allow to bind to the business service (if we talk about the service-resource model) and adjust the degree of its influence on the service as a whole (the so-called connection weight). Below is an example of a service-resource model:

For those who want to further understand their users, there are systems for monitoring real transactions. Even more cool, even more technological. Such systems look like this:
Those. All HTTP / HTTPS traffic that is routed to a web server (web server farm) is mirrored to a special collector (indicated in the diagram as Collector). Next, it is analyzed and the formation of pre-defined representations (sometimes called dashlets from the English. Dashlets). This kind of monitoring can be used, for example, as a mechanism for debugging web applications to search for low-performing components, or to define algorithms for users to navigate between pages, determine the geographic location of a user, type of browser, etc. Below is an example of a network traffic analyzer dashboard:
Pay attention to the so-called. "Glass" in the upper right corner of the window. This is a predetermined algorithm for users to switch between pages, which calculates how many users move from one page to another in exactly this order, and how many users leave this sequence and at what step. You can build graphs and make reports on almost any parameter that is transmitted in the HTTP headers (user name, id, etc.), i.e. the system is really flexible and ready to adapt to the needs of the customer.
Finally, we turn to the deep diagnostics of the business application (especially important for custom development). Such analysis can be done by systems such as Application Diagnostics, diagnostics can be performed for both JAVA and .NET applications. Special agent clings to the process that runs on the server and analyzes the sequence of its actions. For example, the picture below shows an example of such an analysis for a .NET application that throws an exception, and we can see that it occurs after a query in the database.
To debug and monitor samopisnyh applications simply must have.
At the output, we can have an umbrella solution that will receive data on the application from all the described sources and, most importantly, a complete picture of what is happening inside the application, and how it affects our (not afraid of the word) favorite user, for the sake of of which everything is started. There are a lot of software vendors on the market that have the entire arsenal of solutions described, and choosing the optimal solution based on the budget, needs, expectations, etc., may not be so difficult. Most of the Oupensor and industrial solutions can be assembled like a puzzle: i.e. If you already have network or infrastructure monitoring from one vendor, you are more likely to be able to supplement it with, for example, synthetic monitoring from another vendor.
Today, IT seeks to get as close to the business as possible, and influence the company's strategy as a whole, and the tools that the IT manager can look into (or higher) and understand that money has not been wasted, are in general very much in demand by the market .
I tried to give a superficial idea of the various methods of monitoring an abstract business application, and if you have any questions, I will be happy to answer them. It will also be interesting to know in what ways you solve monitoring tasks and what problems you have to face, especially considering the influence of current foreign policy factors. Thanks for attention!
Article author: Anton Kasimov
The most typical example of a modern application architecture is the so-called. "Three Star", i.e. a web server, an application server, and a database server; therefore, each of these components will have a little less than full effect on the operation of the entire application. If we consider just such a configuration, then from my own experience I can say that most often a situation arises that looks like this in an exaggerated way:
')
Periods of unavailability or poor performance of a component are projected onto the overall accessibility of the application that the user feels on himself: i.e. even though the current application systems can provide their availability greatly in 90%, the overall performance of the entire business application may not even reach 90%. In the real world, the picture above may look somehow different, but the essence is always the same - it is the unpredictability of the nature of the influence of the smallest problems with application components on the entire software complex as a whole. Below is an analysis of what, how and why, please under the cat.
Scenario close to real
In any company, situations arise when certain periods of inaccessibility of one of the application links eventually result in periods of poor performance or complete inaccessibility of the user web interface (read, the main functionality of the application). If the IT landscape of a company is complex, it can be very difficult to figure out which layer is the source of the problem and who to ask for its solution. If we return to the visualization of such a thing, then all this can be depicted as follows:
The situation is lose-lose, i.e. everybody loses. Users feel that IT does not understand them, the line manager uses IT and the most important boss, who sends rays of indignation to the IT manager, to solve a specific situation. An IT manager with mixed feelings goes to his administrators who are trying to blame each other, providing the results of their monitoring systems (or the work of handwritten scripts) and further, on and on. In general, this situation can last for quite a long time, as long as the problem resolves itself at best, or all IT administrators will come to an agreement to conduct diagnostics each in their system and finally find the root cause. According to the experience of communication with the customer, I can say that there is still such a scenario, when it was not possible to do anything on my own (due to insufficient expertise or other objective reasons), and the vendor’s case has the appropriate software that can stretch out quite indefinitely.
There is another point at which I will dwell in more detail. Any application system requires monitoring, and not always the company has something industrial for this. In such a situation, in most cases, the administrator will be helped out by the built-in butt monitoring mechanism, and in case of his absence, this could be a well-proven script that runs on a regular basis. It’s great that the administrator uses tools that are convenient and understandable for him, and now let's assume that a planetary-scale ahtung arose (a radical degradation of the application’s performance or its complete unavailability). At the same time, the script launch mechanism decided for some time not to be executed and calmly to smoke aside. As a result, waving screenshots in front of the CIO confirming that there was monitoring after all, but the script issued an exception and the scheduler stumbled, it might not be the best idea. Built-in monitoring is good because it takes into account the features of the application, but again, the application owner may not be very comfortable collecting diverse information from all administrators and reporting to management on the continuity of the business process that the application supports. In my opinion, application system administrators should not waste their valuable time on supporting the monitoring system; they should shift this functionality to specially trained employees within the company or to an external contractor.
How to learn to understand the application
What can be done to create win-win situations? So that big bosses do not have additional questions on the topic “what are you doing, so that this does not happen again,” and you, as a person from IT (or a manager for the availability of such and such services), do not worry again, you should have timely information the status of all components of the systems involved in the main (and not so) business of the company. Preferably on a large LCD-TV, preferably with large clear signatures, color indication (a la red-yellow-green) and, somewhere near, a list of names in front of the service names. And it would be great to click the mouse on the service (which is colored, for example, in red) and find out on which link the problem occurred. Thus, we came to the idea of a single (and it could be an umbrella) monitoring system that covers all parts of a business application using standard monitoring modules (of course, there is always the opportunity to use custom scripts along with standard tools, or use a different tool or industrial monitoring system). Below is an example of the so-called heat map, i.e. service maps:
Thus, IT staff or a business service manager have the opportunity to literally “keep abreast” and at any time have an idea of where the problem arose, and who you can find out about the timing of the decision in order to report to users or leadership. Such monitoring is very useful when you perform maintenance work on a large number of applications (or their components) and want to make sure that everything has recovered successfully after a reboot, because spending the rest of the night (well, after all, such work is most often carried out at night) on manual verification of the whole "zoo" would not be entirely rational.
The current level of industrial monitoring systems allows for deep monitoring and even counting the level of accessibility of a business application. This can be especially important when the IT department provides a business with a set of services (or services) for which a service level agreement (SLA) has been concluded. The monitoring system will allow you to generate reports with the necessary detail, allow you to accumulate statistics and understand which components of a business application are not sufficiently productive, and, in the end, will allow the business to at least somehow understand how well IT service is provided. But you will have the most complete picture of the operation of the application, if at a certain frequency on an average workstation you do what the user does. About this below.
How to learn to understand the user
Finally, we turn to the question of monitoring a business application from the user's point of view; without this, it’s nowhere at all. It is clear that end users are most sensitive to performance degradation or unavailability of the application, and it would be the most preferable option to “see” with their eyes. Hiring people who will, for example, arrange bank transactions and sit with a stopwatch, measuring the response time of the same Siebel web interface, is not the best thing to do. The best option in this case would be to write a special algorithm (synthetic transaction) that will launch the browser, authorize the application, and transfer the conditional amount of 1 ruble from one account to another. Especially for dear readers, I wrote a browser transaction (there are also transactions with heavy customers) using the example of one well-known online store. It measures the elapsed time for each step — the initial loading of the page into the browser, the time it takes to authorize the user, the time to search for the product, and interstitial redirects and transitions — plus the success of each step and transaction as a whole is checked.
The system allows you to control that specific images have been downloaded, it is also possible to recognize text from a page (OCR method), compare it with something, or simply write it, for example, in a database. You can get transaction timing, i.e. At each step, a timer is started, which measures its execution time and checks for success, so that the application owner can understand at what step the failure occurred.
It turns out that if the conditional user declares to you that everything in your application is slow and buggy, you can provide the results of such transactions and explain that his case is unique and is happening in perfect isolation from reality :) Seriously, providing such performance graphs will help you get rid of unnecessary activities to find user-made problems.
In the end, we have a tool that allows you to receive information about the existence of a problem at a very early stage (even before users start contacting customer support). The success / failure of the transaction (or its availability) monitoring system can allow to bind to the business service (if we talk about the service-resource model) and adjust the degree of its influence on the service as a whole (the so-called connection weight). Below is an example of a service-resource model:
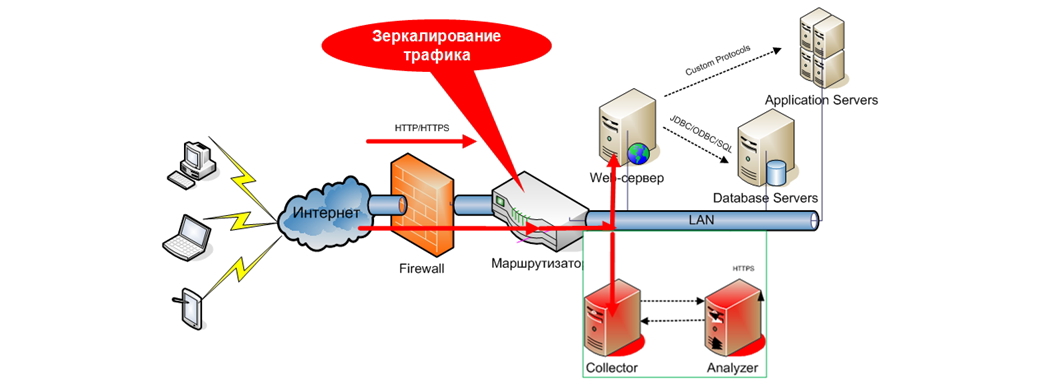
For those who want to further understand their users, there are systems for monitoring real transactions. Even more cool, even more technological. Such systems look like this:
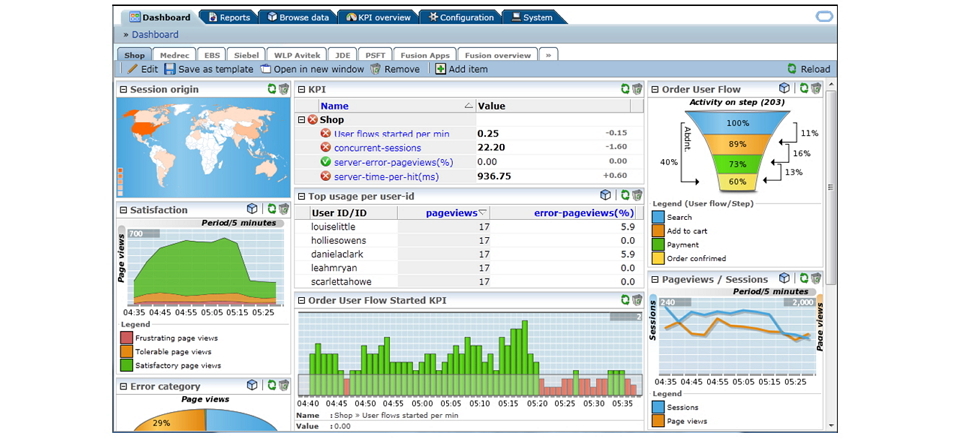
Those. All HTTP / HTTPS traffic that is routed to a web server (web server farm) is mirrored to a special collector (indicated in the diagram as Collector). Next, it is analyzed and the formation of pre-defined representations (sometimes called dashlets from the English. Dashlets). This kind of monitoring can be used, for example, as a mechanism for debugging web applications to search for low-performing components, or to define algorithms for users to navigate between pages, determine the geographic location of a user, type of browser, etc. Below is an example of a network traffic analyzer dashboard:
Pay attention to the so-called. "Glass" in the upper right corner of the window. This is a predetermined algorithm for users to switch between pages, which calculates how many users move from one page to another in exactly this order, and how many users leave this sequence and at what step. You can build graphs and make reports on almost any parameter that is transmitted in the HTTP headers (user name, id, etc.), i.e. the system is really flexible and ready to adapt to the needs of the customer.
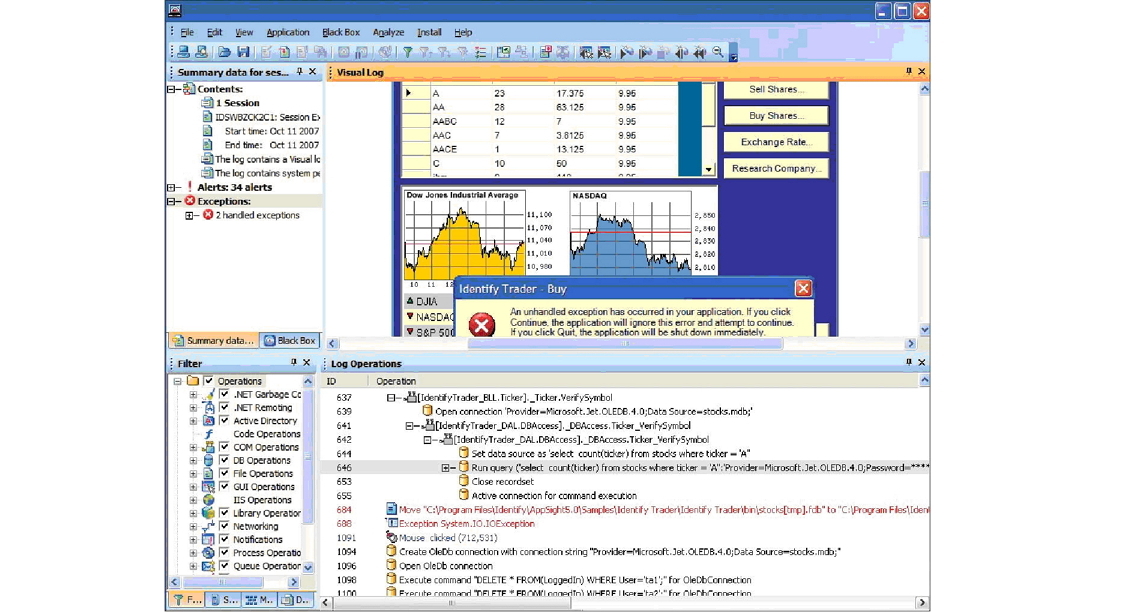
Finally, we turn to the deep diagnostics of the business application (especially important for custom development). Such analysis can be done by systems such as Application Diagnostics, diagnostics can be performed for both JAVA and .NET applications. Special agent clings to the process that runs on the server and analyzes the sequence of its actions. For example, the picture below shows an example of such an analysis for a .NET application that throws an exception, and we can see that it occurs after a query in the database.
To debug and monitor samopisnyh applications simply must have.
And what about the output
At the output, we can have an umbrella solution that will receive data on the application from all the described sources and, most importantly, a complete picture of what is happening inside the application, and how it affects our (not afraid of the word) favorite user, for the sake of of which everything is started. There are a lot of software vendors on the market that have the entire arsenal of solutions described, and choosing the optimal solution based on the budget, needs, expectations, etc., may not be so difficult. Most of the Oupensor and industrial solutions can be assembled like a puzzle: i.e. If you already have network or infrastructure monitoring from one vendor, you are more likely to be able to supplement it with, for example, synthetic monitoring from another vendor.
Today, IT seeks to get as close to the business as possible, and influence the company's strategy as a whole, and the tools that the IT manager can look into (or higher) and understand that money has not been wasted, are in general very much in demand by the market .
I tried to give a superficial idea of the various methods of monitoring an abstract business application, and if you have any questions, I will be happy to answer them. It will also be interesting to know in what ways you solve monitoring tasks and what problems you have to face, especially considering the influence of current foreign policy factors. Thanks for attention!
Article author: Anton Kasimov
Source: https://habr.com/ru/post/243991/
All Articles