Node.js on fire
We are creating a new generation of Netflix.com web application using node.js. You can learn more about our campaign from the presentation that we presented at NodeConf.eu a few months ago. Today I want to share my experience in tuning the performance of a new stack of our application.
We first encountered problems when we noticed that the delay in the request in our node.js application increases over time. In addition, it used more processor resources than we expected, and this correlated with the delay time. We had to use the reboot as a temporary solution while we were looking for a reason with the help of new tools and performance analytics techniques in our Linux EC2 environment.
')
We noticed that the request delay in our node.js application increases over time. So, on some of our servers, the delay grew from 1 millisecond to 10 milliseconds every hour. We also saw the dependence of increasing CPU utilization.
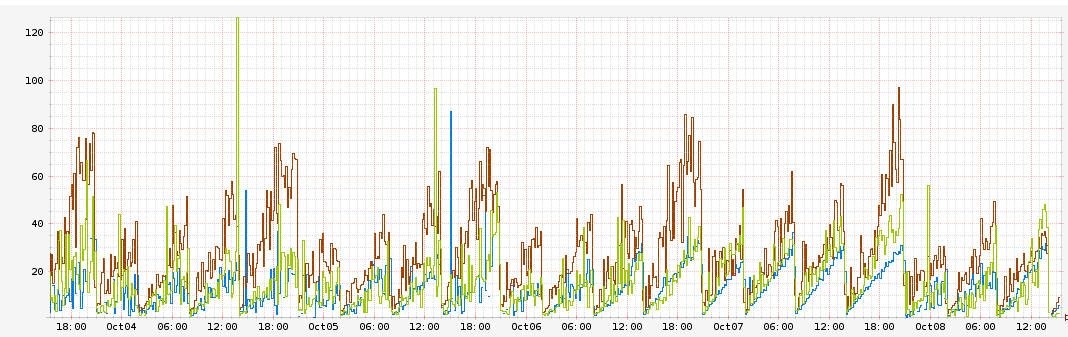
This graph shows the request delay in milliseconds relative to time. Each color denotes a different copy of AWS AZ. You can see that the delay is constantly increasing by 10 milliseconds per hour and reaches 60 milliseconds before rebooting.
Initially, we assumed that these could be memory leaks in our own request handlers, which, in turn, caused delays. We tested this assumption by using load testing of an isolated application by adding metrics to measure delays only on our request handlers and the total request delay time, and also increasing the memory used in node.js to 32 gigabytes.
We found out that the delay in our handlers remains constant and equals 1 millisecond. We also found that the amount of memory used by the process also remains unchanged, reaching approximately 1.2 gigabytes. Nevertheless, the overall delay and processor usage continued to grow. This meant that our handlers had nothing to do with it, and the problems are deeper on the stack.
Something added an extra 60 milliseconds to query service. We needed a way to profile the CPU usage of the application and visualize the data. We came to the aid of Linux Perf Events and flame graphs processor.
If you are not familiar with flame graphs, then I advise you to read Brendan Gregg's excellent article in which he explains everything in detail. Here is its summary (directly from the article):
Previously, node.js flame graphs could only be used on DTrace systems in conjunction with jstack () from Dave Pacheco. However, the Google V8 team recently added support for perf_events to the V8 engine, which allows profiling JavaScript on Linux. In this article, Brendan described the use of a new feature that appeared in node.js 0.11.13 to create flame graphs in Linux.
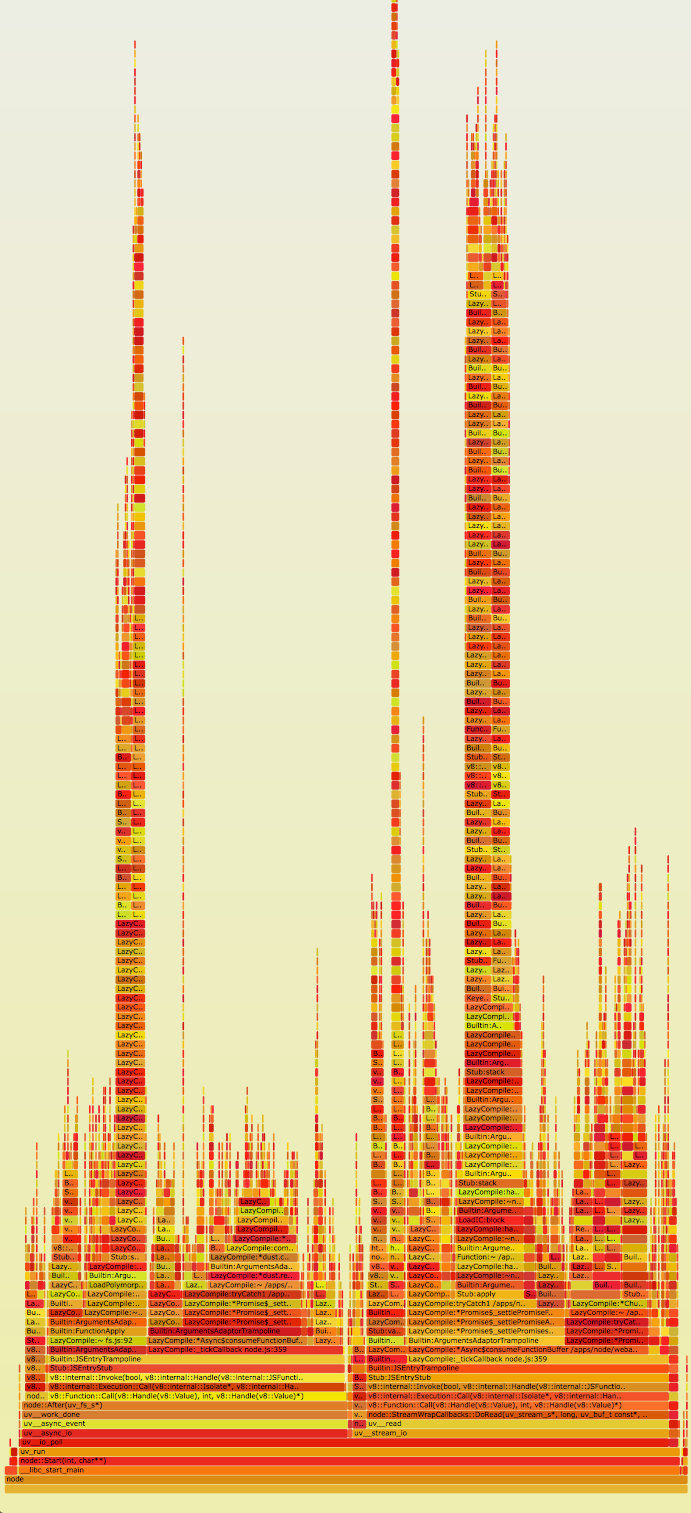
From this link you can see the original interactive flame graph of our application in SVG.
Immediately, you can note the incredibly large stacks in the application (Y-axis). It is also obvious that they have a lot of time (axis X). Upon closer inspection, it will
We found two interesting points in the Express source code 1 :
A global array is not the most appropriate data structure in this case, since in order to find a route, on average, O (n) operations are required. It is not clear why the Express developers decided not to use a constant data structure, for example, a hash table for storing handlers. Compounding the situation and the fact that the array is treated recursively. This explains why we have seen such high stacks in flame graphs. Another interesting fact is that Express allows you to install multiple handlers for a single route.
In this case, the search for route
Once launched, the application displays these handlers:
Note that there are two identical handlers for the
Now our assumption was that delays occurred due to the constant increase in the array with handlers. Most likely, handlers were duplicated somewhere in our code. We added additional logging, which output an array of request handlers, and noticed that it grows 10 elements per hour. These handlers were identical to each other, as in the example above.
Something added to the application 10 identical handlers for static routes per hour. Next, we found that when iterating through these handlers, the cost of calling each of them takes about 1 millisecond. This correlates with what we saw earlier, when the response latency grew by 10 milliseconds per hour.
It turned out that this was caused by a periodic (10 times per hour) update of handlers in our code from an external source. We implemented this by removing the old handlers and adding new ones to the array. Unfortunately, we also always added a handler for the static route during this operation. Since Express allows you to add multiple handlers for one route, all these duplicates were added to the array. Worst of all, they were all added before the others, which meant that before Express found the API handler for our service, it would call the handler for the static route several times.
This fully explains why request delays grew by 10 milliseconds per hour. In fact, after we eliminated the error in our code, the constant increase in the delay time and the increase in CPU usage ceased.
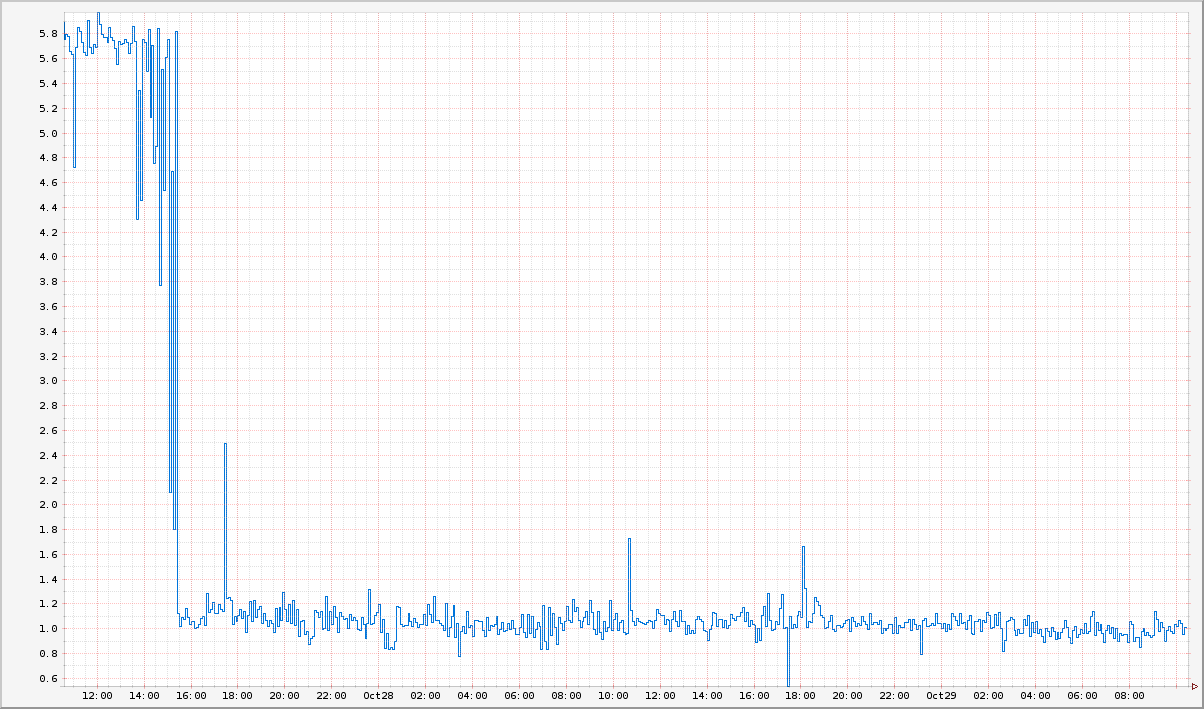
This graph shows that the delay time was reduced to one millisecond after the code was updated.
What kind of experience have we got? First, we must fully understand how the dependencies in our code are arranged before using it in production. We made a wrong assumption about the operation of the Express API without examining its code. Improper use of the Express API is the ultimate cause of our performance problems.
Secondly, visibility is paramount in solving performance problems. Flame graphs gave us a tremendous understanding of where our application spends the most CPU time and resources. I can't imagine how we could solve this problem by not being able to get the node.js stacks and visualize them using flame graphs.
Wanting to improve visibility, we migrate to Restify , which will allow us to improve our control over our application 2 . This is beyond the scope of this article, so read our blog on how we use node.js in Netflix.
Want to solve similar problems with us? Our team is looking for an engineer to work with the node.js stack.
Posted by: Yunong Xiao @yunongx
Notes:
Translator's Notes:
Comments and comments regarding the translation are welcome in personal messages.
UPD : attentive readers noticed that the translator did a wrong transcription of the author's name of the original article. Thanks for the domix32 and lany tips .
We first encountered problems when we noticed that the delay in the request in our node.js application increases over time. In addition, it used more processor resources than we expected, and this correlated with the delay time. We had to use the reboot as a temporary solution while we were looking for a reason with the help of new tools and performance analytics techniques in our Linux EC2 environment.
')
The fire is burning
We noticed that the request delay in our node.js application increases over time. So, on some of our servers, the delay grew from 1 millisecond to 10 milliseconds every hour. We also saw the dependence of increasing CPU utilization.
This graph shows the request delay in milliseconds relative to time. Each color denotes a different copy of AWS AZ. You can see that the delay is constantly increasing by 10 milliseconds per hour and reaches 60 milliseconds before rebooting.
Fire extinguishing
Initially, we assumed that these could be memory leaks in our own request handlers, which, in turn, caused delays. We tested this assumption by using load testing of an isolated application by adding metrics to measure delays only on our request handlers and the total request delay time, and also increasing the memory used in node.js to 32 gigabytes.
We found out that the delay in our handlers remains constant and equals 1 millisecond. We also found that the amount of memory used by the process also remains unchanged, reaching approximately 1.2 gigabytes. Nevertheless, the overall delay and processor usage continued to grow. This meant that our handlers had nothing to do with it, and the problems are deeper on the stack.
Something added an extra 60 milliseconds to query service. We needed a way to profile the CPU usage of the application and visualize the data. We came to the aid of Linux Perf Events and flame graphs processor.
If you are not familiar with flame graphs, then I advise you to read Brendan Gregg's excellent article in which he explains everything in detail. Here is its summary (directly from the article):
- Each block denotes a function on the stack (stack frame)
- The y-axis indicates the stack depth (the number of frames in the stack). The upper block denotes the function that was executed by the processor, all that is lower is its call stack.
- The X axis indicates the number of function calls. It does not show the amount of time spent by the function, as on most graphs. The order of location does not matter, the blocks are simply sorted in lexicographical order.
- The width of the block shows the total execution time of the function by the processor or part of the execution time of the function that called it. Wide function blocks can be performed more slowly than narrow ones, and can simply be called more often.
- The number of calls may exceed the time if the function was executed in several threads.
- Colors have no special meaning and are determined in random order from “warm” tones. Flame graphs [literally "flame graphics"; approx. translator] are called so because they show the “hottest” places in the application code.
Previously, node.js flame graphs could only be used on DTrace systems in conjunction with jstack () from Dave Pacheco. However, the Google V8 team recently added support for perf_events to the V8 engine, which allows profiling JavaScript on Linux. In this article, Brendan described the use of a new feature that appeared in node.js 0.11.13 to create flame graphs in Linux.
From this link you can see the original interactive flame graph of our application in SVG.
Immediately, you can note the incredibly large stacks in the application (Y-axis). It is also obvious that they have a lot of time (axis X). Upon closer inspection, it will
route.handle that these stack frames are full of references to the route.handle and route.handle.next from Express .We found two interesting points in the Express source code 1 :
- Route handlers for all paths are stored in one global array.
- Express recursively iterates and calls all handlers until it finds a suitable route.
A global array is not the most appropriate data structure in this case, since in order to find a route, on average, O (n) operations are required. It is not clear why the Express developers decided not to use a constant data structure, for example, a hash table for storing handlers. Compounding the situation and the fact that the array is treated recursively. This explains why we have seen such high stacks in flame graphs. Another interesting fact is that Express allows you to install multiple handlers for a single route.
[a, b, c, c, c, c, d, e, f, g, h] In this case, the search for route
c would be terminated when the first suitable handler was found (position 2 in the array). However, in order to find the route handler d (position 6 in the array), it would be necessary to spend extra time calling several instances c . We checked it with a simple Express application: var express = require('express'); var app = express(); app.get('/foo', function (req, res) { res.send('hi'); }); // app.get('/foo', function (req, res) { res.send('hi2'); }); console.log('stack', app._router.stack); app.listen(3000); Once launched, the application displays these handlers:
stack [ { keys: [], regexp: /^\/?(?=/|$)/i, handle: [Function: query] }, { keys: [], regexp: /^\/?(?=/|$)/i, handle: [Function: expressInit] }, { keys: [], regexp: /^\/foo\/?$/i, handle: [Function], route: { path: '/foo', stack: [Object], methods: [Object] } }, { keys: [], regexp: /^\/foo\/?$/i, handle: [Function], route: { path: '/foo', stack: [Object], methods: [Object] } } ] Note that there are two identical handlers for the
/foo route. It would be nice if Express threw an error every time one route has multiple handlers.Now our assumption was that delays occurred due to the constant increase in the array with handlers. Most likely, handlers were duplicated somewhere in our code. We added additional logging, which output an array of request handlers, and noticed that it grows 10 elements per hour. These handlers were identical to each other, as in the example above.
Something added to the application 10 identical handlers for static routes per hour. Next, we found that when iterating through these handlers, the cost of calling each of them takes about 1 millisecond. This correlates with what we saw earlier, when the response latency grew by 10 milliseconds per hour.
It turned out that this was caused by a periodic (10 times per hour) update of handlers in our code from an external source. We implemented this by removing the old handlers and adding new ones to the array. Unfortunately, we also always added a handler for the static route during this operation. Since Express allows you to add multiple handlers for one route, all these duplicates were added to the array. Worst of all, they were all added before the others, which meant that before Express found the API handler for our service, it would call the handler for the static route several times.
This fully explains why request delays grew by 10 milliseconds per hour. In fact, after we eliminated the error in our code, the constant increase in the delay time and the increase in CPU usage ceased.
This graph shows that the delay time was reduced to one millisecond after the code was updated.
When the smoke cleared
What kind of experience have we got? First, we must fully understand how the dependencies in our code are arranged before using it in production. We made a wrong assumption about the operation of the Express API without examining its code. Improper use of the Express API is the ultimate cause of our performance problems.
Secondly, visibility is paramount in solving performance problems. Flame graphs gave us a tremendous understanding of where our application spends the most CPU time and resources. I can't imagine how we could solve this problem by not being able to get the node.js stacks and visualize them using flame graphs.
Wanting to improve visibility, we migrate to Restify , which will allow us to improve our control over our application 2 . This is beyond the scope of this article, so read our blog on how we use node.js in Netflix.
Want to solve similar problems with us? Our team is looking for an engineer to work with the node.js stack.
Posted by: Yunong Xiao @yunongx
Notes:
- In particular, this code snippet . Note that the
next()function is called recursively to iterate through the array of handlers. - Restify provides many mechanisms for getting the best visibility of our application, from DTrace support to node-bunyan c integration.
Translator's Notes:
- I have nothing to do with Netflix. But I left the link to the vacancy intentionally, I will be sincerely glad if it is useful to someone.
- The comments to the original article explain why Express does not use hash tables as a data structure for storing handlers. The reason lies in the fact that the regular expression by which the required handler is selected cannot be the key in the hash table. And if you store it as a string, you will also have to compare all the keys from the hash table (although this does not negate the fact that if you add a second handler to the route, you could throw at least a warning).
- You can also read the detailed answer from Eran Hammer (one of the contributors to hapi ) and the discussion that followed.
Comments and comments regarding the translation are welcome in personal messages.
UPD : attentive readers noticed that the translator did a wrong transcription of the author's name of the original article. Thanks for the domix32 and lany tips .
Source: https://habr.com/ru/post/243945/
All Articles