How to perform data analysis by writing just one line of code
 In version 14.2, we completely rewrote the mechanism for exporting data to MS Excel formats. Now export to Excel works much faster and the document that is obtained as a result saves grouping, filtering, sorting from the grid, “live” sammari on formulas, conditional formatting and much more .
Users have new opportunities for detailed analysis of data from the grid in their familiar Excel. A manager, accountant or financial analyst can now get tabular data from grid to Excel quickly and accurately.
Many years ago, I began my IT career with enterprise automation using solutions from 1C. One of the major clients was preparing an annual report and something did not converge. I was asked to write a few special requests to localize the discrepancies. I think that accounting could do without inviting a specialist and save time and money if they had a good export to Excel. Of course, this approach has limitations. For example, the amount of data analyzed may be too large for Excel.
Thanks to the new export, users have new opportunities for deep analysis and visualization of data using Excel. Unfortunately, I don’t remember exactly what was wrong when that annual report did not converge. Therefore, to demonstrate the possibilities of new exports, let us imagine that there is an application in which there is data on sales of goods from the store for a certain period in the form of a table. The manager wants to know which products make a greater contribution to the revenue, those perform an ABC analysis . As you guessed, in this application, ABC analysis is not implemented, but there is a button that, if pressed, calls the view.ExportToXls (..) method.
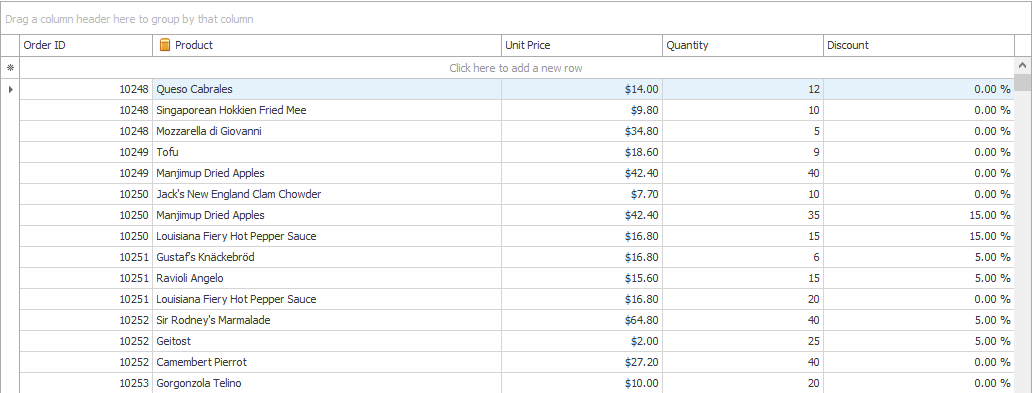
This is what this application looks like. The table shows the accounting of goods sold with discounts. Those familiar with our line of controls will surely recognize the TableView module from the main XtraGrid demo. Yes, it is, therefore, if you wish, you can always repeat this example exactly on your side.
')
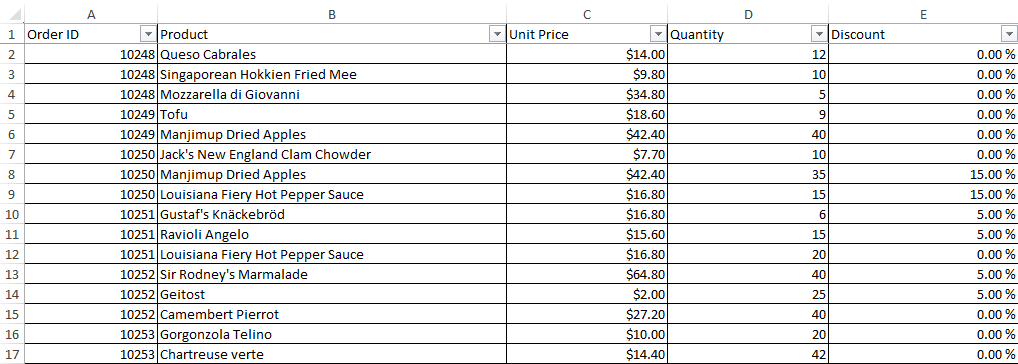
After export, we get this data in Excel. The table contains approximately 2,200 lines. Export speed on my laptop was about 7 thousand lines per second.
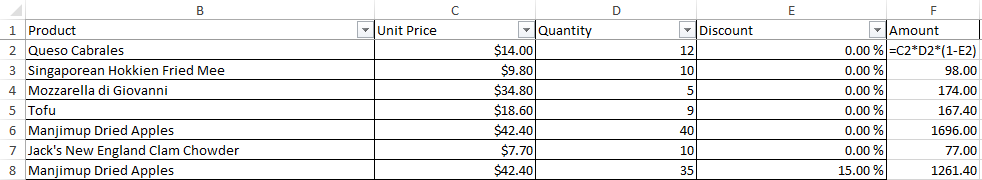
We have price, quantity and discount. Add a column F with a formula for the cost.
Now we need to get a turn for each product. The easiest way to do this is a pivot table. In the rows of the pivot table there will be a column Product, in values - the column Amount, which has standard processing% of the total amount selected.
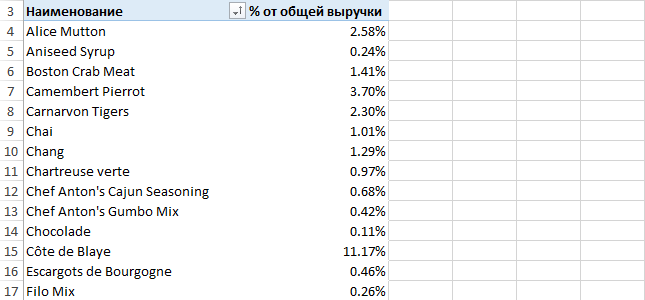
It remains to sort by the second column and calculate the cumulative total.
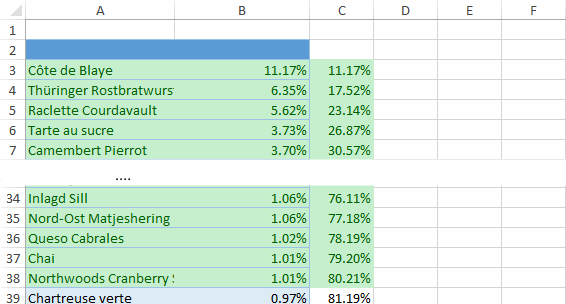
Green highlighted products that formed 80% of revenue, as required to find. Thus, we have shown that with the new export, users can perform deep data analysis in Excel without the help of developers. In the above example, ABC analysis was performed of data on sales of 80 products from the source table containing 2155 rows. The analyzed table may contain significantly more data.
In this article, data analysis was performed in Microsoft Excel 2013, but you can use any other spreadsheet program. By the way, DevExpress has a control for working with spreadsheets . Spreadsheet Control is called. New export went into beta release 14.2, which is already available .
Source: https://habr.com/ru/post/243859/
All Articles