Analyze text with Azure Machine Learning
In this post, I’ll tell you how you can use Microsoft Azure Machine Learning to analyze text tonality, as well as what problems you may encounter when using Azure ML and how to get around them.
What is the analysis of tonality is well described in the article “Teach the computer to the senses (sentiment analysis in Russian)” .
Our goal will be to build a web service that accepts some text as input and returns 1 if the text is positive, and -1 if it is negative. Microsoft Azure Machine Learning is ideally (almost) suitable for this task, as there is a built-in ability to publish the results of calculations as a web service and support for the R language - this eliminates the need to write your crutches and configure your virtual machine / web server. In general, all the benefits of cloud technology. In addition, it was recently announced that everyone can try Azure ML even without an Azure account and a credit card - only a Microsoft Account is needed.
The whole process will be reduced to two points:
To recognize tonality we will use a naive Bayes classifier. For training, we need a tagged sample containing a set of some texts and corresponding estimates. Next, for this set, a document-term matrix is built, where the rows correspond to the documents, and the columns represent the terms that are found in them. Each cell contains the number of repetitions of this term in the corresponding document. Thus, for the two documents " Today is a good weather " and " I do not feel very well, the weather is to blame, " the document-term matrix will look like this:
')
Please note that in the table there are two forms of the same word - “good” and “good”. This can be avoided by using stemming (those cutting the endings according to certain rules), but then the results may worsen. Read more about this, as well as the weighting of terms and N-grams, see the article at the link at the beginning of the post.
After constructing this matrix, it can be directly used to train the Bayes classifier. But let's move on from theory to practice.
We will evaluate the tone of posts on the walls in the VC. Accordingly, for the training of the classifier, a sample of posts with a tonality is needed. It can be downloaded from this link (attention, this sample was marked during our (I, ASTAPP and MKulikow ) participation in the Big Data hackathon , and, accordingly, it does not pretend to high accuracy and may contain errors, since the markup was made in large in a hurry). In this sample, there are about 3500 random posts from random VKontakte walls, of which 341 are positive and 115 are negative. Evaluation of posts was carried out on a scale from -10 to 10.
So let's create an experiment in Azure ML to train a classifier. Go to the ML home page and click New -> Experiment -> Blank Experiment. Before you open the pure field of the new experiment. From above, you can immediately change the name to a more decent one - habr_article_sentiment, for example.
Now you need to upload our dataset to Azure. In theory, to do this, click New -> Dataset -> From Local File, and then select Generic CSV File with a header from the list “Select a type for new dataset:”. However, there is a problem - if the line contains a newline character (\ n), even if it is escaped with quotation marks, then the import will be incorrect. And in the posts on the walls of the VK this symbol is necessarily present. This bug can be circumvented by uploading a CSV file to the database, and then using the Reader block from the Data Input and Output section to load data. Drag this block onto the experiment field, configure the database connection and set the SQL query for the data selection (do not forget to tick the “Accept any server certificate (insecure)” box. ”The SQL query will look like this:
Now you can run the experiment and check what will be at the output of the Reader block - to do this, click on the Run button at the bottom of the page, and after completion of execution, click on the output node of the right mouse button and select "Visualize". You should get something like this:
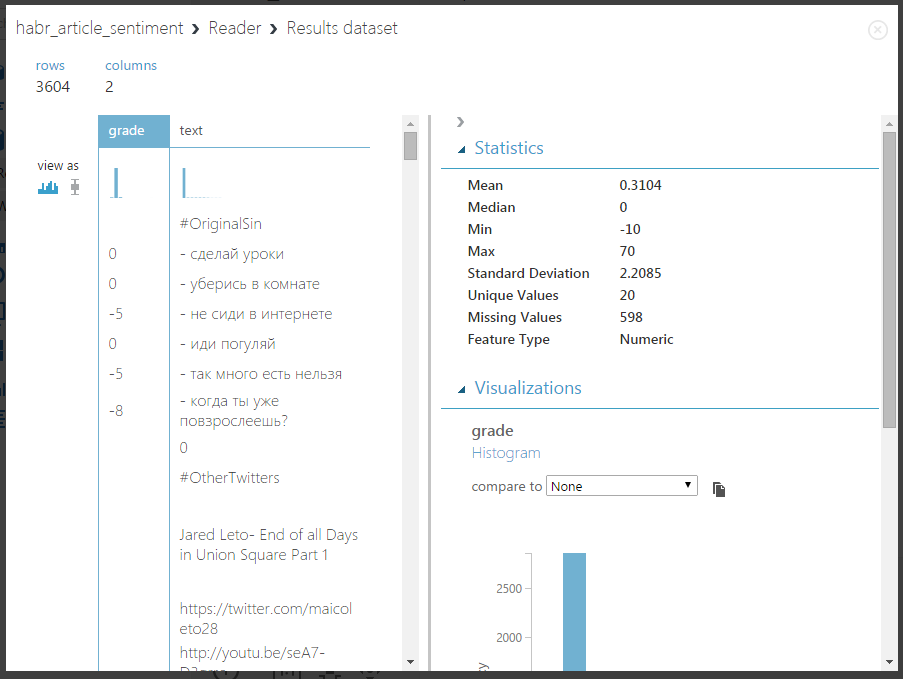
In the block on the right, you can see some statistics - it is clear that the maximum value is 70, this is an obvious typo in the marking process, and there are unmarked lines (lines with a neutral tone).
Now let's remove the empty lines, and also give estimates from the scale from -10 to 10 to the categorical assessment: -1, 0 and 1. To do this, use the blocks Missing Value Scrubber and Clip Values. Using the search in the panel with blocks, find and drag the Missing Value Scrubber block on the experiment field and connect its input with the output of the Reader block:

Set the settings of this block as in the picture above - here, I think, everything is clear.
Now drag the Clip Values block - this block is used to detect and replace outliers and is perfect for our purposes - just set the min. and max. value as -1 and 1 respectively.

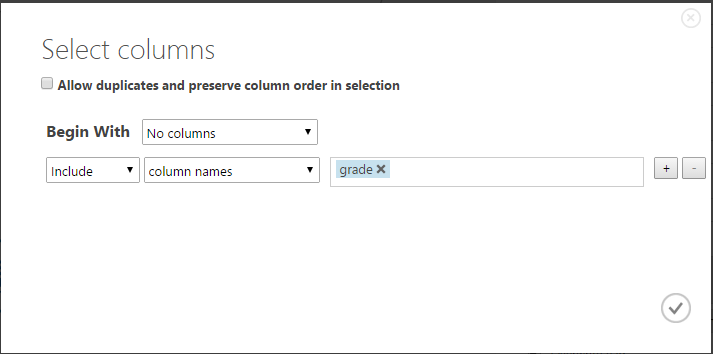
Please note that this block has a Columns Selector - you should choose which columns it will process. The default is all digital. Let's select our grade column — click Launch Column Selector and set the following settings:
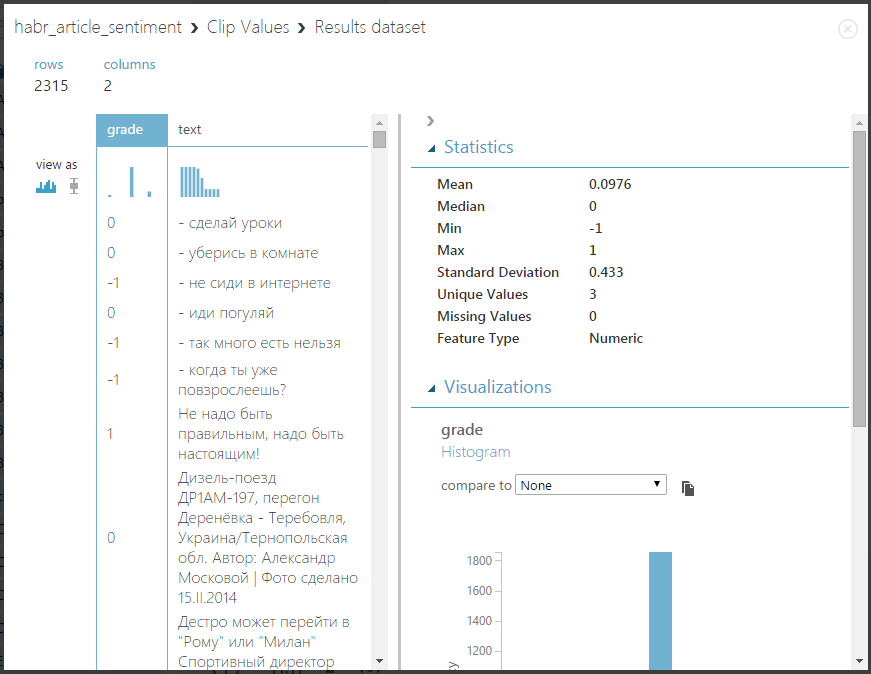
Let's try to run the experiment and see what happens - click Run and visualize the output of the Clip Values block:
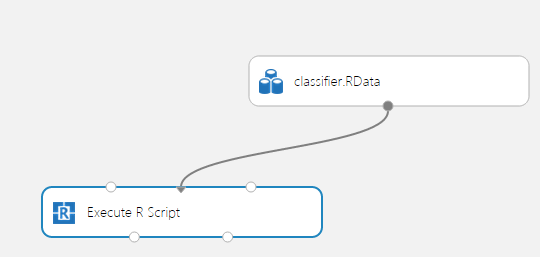
Wonderful! Just what is needed - now we can go directly to the training of the classifier. Since Azure ML supports the execution of arbitrary R-scripts, we will use the naive Bayes classifier from the e1071 package for R. Drag the Execute R Script block onto the experiment field and connect the Clip Values output to the Dataset1 input point:

It should immediately be said: ideally, the process of teaching the model and its subsequent use is as follows: we create an experiment, choose the model we want to use, teach it and carry out an accuracy check. Then, we simply right-click on the output of the model and select “Save as Trained Model”. After that, the trained model is saved in the block section, and we can always use it - those in order to publish a web service, we simply create a new experiment, drag our trained model there and set the weekend output points. Everything is very easy and understandable. However, at the moment there is no possibility to save the trained model from the block of type “Execute R Script”. I very much hope that this will be fixed soon (vote, please, for this here ). However, the ability to save and use the model from the R-script is still there: you can serialize an object into a set of bytes, and then submit it to the output of the block (after converting this set to a single-column DataFrame, since only DataFram 'can be fed to the output s). After the experiment is completed, you can right-click on the exit point and select Save as Dataset. In future experiments, it will be possible to select this dataset and connect it to the input of the R-script block, and then load it and deserialize it. The way is crooked, but it works :) You can do a little easier if you have a locally installed R - we train the model, save it in .RData, package it in zip, and load this zip into the dataset section and connect it to the third input of the R-script block - “ Script Bundle (Zip) ". In general, you can directly upload a file of type .RData to the dataset section, but I did not find a single block to which it is then connected - it does not even connect to the R-script block, which would be quite logical: (
In view of the above, the code on R looks like this:
Now, finally, you can run the experiment! It took me about a minute to complete it. After completion, if everything passed without errors, you can right-click on the output port and save the classifier as a new datasset:

This completes the training of the model and you can proceed to the next part - using the resulting model, creating and publishing a web service.
Create a new experiment and name it, for example, habr_article_sentiment_use. Drag the Execute R Script block onto the field and connect the previously saved classifier to its second port:
And we will connect to the first port just a text file with a single column containing 1 line - a test proposal for checking the model. This is necessary for two reasons - firstly, we will see that the classifier really works, but, most importantly, it will give Azure Machine Learning information about the structure of the input data of the web service, which we will publish - in this case, it accepts only 1 string as input parameter. This text file might look like this, for example:
The result is this:

Make sure by clicking Visualize on the output of this dataset that it has only one column named “text”.
Now let's write an R-script to use the classifier:
Let's run the experiment and visualize the result - I got -1, although the text is generally positive. This indicates a low sample quality and the need to use more complex approaches. Our hackathon had an accuracy of about 72%.
Next you need to set the input point of the web service - click on the first input of the R-script block and select Set as Publish Input. Similarly, set the output: click on the output point “Result Dataset” and select Set as Publish Output. Now you can finally publish the web service - click on the Publish Web Service on the panel below (if this button is unavailable, just start the experiment, after its execution it is activated). After confirmation, you will be transferred to the newly published web service page:
From here you can go to the generated web service help page - to do this, click on the API Help Page in the REQUEST / RESPONSE line. This page contains comprehensive information on how to use the web service, even code samples in different languages. Let's try to make the first request - using your favorite REST client, send the following JSON service:
In response, we will come:
That's all! As you can see, using Azure Machine Learning is very simple, although at the moment there are some problems. But, like Azure as a whole, Azure ML is developing very fast, and I hope that soon there will be no need for all these workarounds and the bugs will disappear.
In conclusion, here are two helpful links:
What is the analysis of tonality is well described in the article “Teach the computer to the senses (sentiment analysis in Russian)” .
Our goal will be to build a web service that accepts some text as input and returns 1 if the text is positive, and -1 if it is negative. Microsoft Azure Machine Learning is ideally (almost) suitable for this task, as there is a built-in ability to publish the results of calculations as a web service and support for the R language - this eliminates the need to write your crutches and configure your virtual machine / web server. In general, all the benefits of cloud technology. In addition, it was recently announced that everyone can try Azure ML even without an Azure account and a credit card - only a Microsoft Account is needed.
The whole process will be reduced to two points:
- Creating and training models
- Using the resulting model
Model training
To recognize tonality we will use a naive Bayes classifier. For training, we need a tagged sample containing a set of some texts and corresponding estimates. Next, for this set, a document-term matrix is built, where the rows correspond to the documents, and the columns represent the terms that are found in them. Each cell contains the number of repetitions of this term in the corresponding document. Thus, for the two documents " Today is a good weather " and " I do not feel very well, the weather is to blame, " the document-term matrix will look like this:
| Today | the good | weather | I | not | highly | OK | myself | feel | is to blame | |
| doc1 | one | one | one | 0 | 0 | 0 | 0 | 0 | 0 | 0 |
| doc2 | 0 | 0 | one | one | one | one | one | one | one | one |
')
Please note that in the table there are two forms of the same word - “good” and “good”. This can be avoided by using stemming (those cutting the endings according to certain rules), but then the results may worsen. Read more about this, as well as the weighting of terms and N-grams, see the article at the link at the beginning of the post.
After constructing this matrix, it can be directly used to train the Bayes classifier. But let's move on from theory to practice.
Practice
We will evaluate the tone of posts on the walls in the VC. Accordingly, for the training of the classifier, a sample of posts with a tonality is needed. It can be downloaded from this link (attention, this sample was marked during our (I, ASTAPP and MKulikow ) participation in the Big Data hackathon , and, accordingly, it does not pretend to high accuracy and may contain errors, since the markup was made in large in a hurry). In this sample, there are about 3500 random posts from random VKontakte walls, of which 341 are positive and 115 are negative. Evaluation of posts was carried out on a scale from -10 to 10.
So let's create an experiment in Azure ML to train a classifier. Go to the ML home page and click New -> Experiment -> Blank Experiment. Before you open the pure field of the new experiment. From above, you can immediately change the name to a more decent one - habr_article_sentiment, for example.
Now you need to upload our dataset to Azure. In theory, to do this, click New -> Dataset -> From Local File, and then select Generic CSV File with a header from the list “Select a type for new dataset:”. However, there is a problem - if the line contains a newline character (\ n), even if it is escaped with quotation marks, then the import will be incorrect. And in the posts on the walls of the VK this symbol is necessarily present. This bug can be circumvented by uploading a CSV file to the database, and then using the Reader block from the Data Input and Output section to load data. Drag this block onto the experiment field, configure the database connection and set the SQL query for the data selection (do not forget to tick the “Accept any server certificate (insecure)” box. ”The SQL query will look like this:
SELECT score AS grade, text FROM tmp.big_data_hack Now you can run the experiment and check what will be at the output of the Reader block - to do this, click on the Run button at the bottom of the page, and after completion of execution, click on the output node of the right mouse button and select "Visualize". You should get something like this:
In the block on the right, you can see some statistics - it is clear that the maximum value is 70, this is an obvious typo in the marking process, and there are unmarked lines (lines with a neutral tone).
Now let's remove the empty lines, and also give estimates from the scale from -10 to 10 to the categorical assessment: -1, 0 and 1. To do this, use the blocks Missing Value Scrubber and Clip Values. Using the search in the panel with blocks, find and drag the Missing Value Scrubber block on the experiment field and connect its input with the output of the Reader block:
Set the settings of this block as in the picture above - here, I think, everything is clear.
Now drag the Clip Values block - this block is used to detect and replace outliers and is perfect for our purposes - just set the min. and max. value as -1 and 1 respectively.
Please note that this block has a Columns Selector - you should choose which columns it will process. The default is all digital. Let's select our grade column — click Launch Column Selector and set the following settings:
Let's try to run the experiment and see what happens - click Run and visualize the output of the Clip Values block:
Wonderful! Just what is needed - now we can go directly to the training of the classifier. Since Azure ML supports the execution of arbitrary R-scripts, we will use the naive Bayes classifier from the e1071 package for R. Drag the Execute R Script block onto the experiment field and connect the Clip Values output to the Dataset1 input point:
It should immediately be said: ideally, the process of teaching the model and its subsequent use is as follows: we create an experiment, choose the model we want to use, teach it and carry out an accuracy check. Then, we simply right-click on the output of the model and select “Save as Trained Model”. After that, the trained model is saved in the block section, and we can always use it - those in order to publish a web service, we simply create a new experiment, drag our trained model there and set the weekend output points. Everything is very easy and understandable. However, at the moment there is no possibility to save the trained model from the block of type “Execute R Script”. I very much hope that this will be fixed soon (vote, please, for this here ). However, the ability to save and use the model from the R-script is still there: you can serialize an object into a set of bytes, and then submit it to the output of the block (after converting this set to a single-column DataFrame, since only DataFram 'can be fed to the output s). After the experiment is completed, you can right-click on the exit point and select Save as Dataset. In future experiments, it will be possible to select this dataset and connect it to the input of the R-script block, and then load it and deserialize it. The way is crooked, but it works :) You can do a little easier if you have a locally installed R - we train the model, save it in .RData, package it in zip, and load this zip into the dataset section and connect it to the third input of the R-script block - “ Script Bundle (Zip) ". In general, you can directly upload a file of type .RData to the dataset section, but I did not find a single block to which it is then connected - it does not even connect to the R-script block, which would be quite logical: (
In view of the above, the code on R looks like this:
library("RTextTools") library("stringr") library("tm") library("e1071") # ( 1) data <- maml.mapInputPort(1) # , / data <- data[data$grade != 0,] # - dtm <- create_matrix(data$text , language="russian" , minWordLength = 2 , maxWordLength = 10, , stemWords = FALSE , removeNumbers = TRUE , removeSparseTerms = 0 ) mat = as.matrix(dtm) # DocumentTermMatrix # classifier = naiveBayes(mat, as.factor(data$grade)) # serClsf <- serialize(classifier, connection = NULL) # DataFrame output <- data.frame(clsfr = as.integer(serClsf)) maml.mapOutputPort("output"); Now, finally, you can run the experiment! It took me about a minute to complete it. After completion, if everything passed without errors, you can right-click on the output port and save the classifier as a new datasset:
This completes the training of the model and you can proceed to the next part - using the resulting model, creating and publishing a web service.
Using the model
Create a new experiment and name it, for example, habr_article_sentiment_use. Drag the Execute R Script block onto the field and connect the previously saved classifier to its second port:
And we will connect to the first port just a text file with a single column containing 1 line - a test proposal for checking the model. This is necessary for two reasons - firstly, we will see that the classifier really works, but, most importantly, it will give Azure Machine Learning information about the structure of the input data of the web service, which we will publish - in this case, it accepts only 1 string as input parameter. This text file might look like this, for example:
"text" " . , , , . ." The result is this:
Make sure by clicking Visualize on the output of this dataset that it has only one column named “text”.
Now let's write an R-script to use the classifier:
library("RTextTools") library("stringr") library("tm") library("e1071") # , - data <- maml.mapInputPort(1) serializedObj <- maml.mapInputPort(2) # classifier <- unserialize(as.raw(serializedObj$clsfr)) # C - doc <- data$text dtm <- create_matrix(doc , language="russian" , minWordLength = 4 , maxWordLength = 10, , stemWords = FALSE , removeNumbers = TRUE , removeSparseTerms = 0 ) mat = as.matrix(dtm) # predicted <- predict(classifier, mat) # DataFrame result <- as.data.frame(predicted) # maml.mapOutputPort("result"); Let's run the experiment and visualize the result - I got -1, although the text is generally positive. This indicates a low sample quality and the need to use more complex approaches. Our hackathon had an accuracy of about 72%.
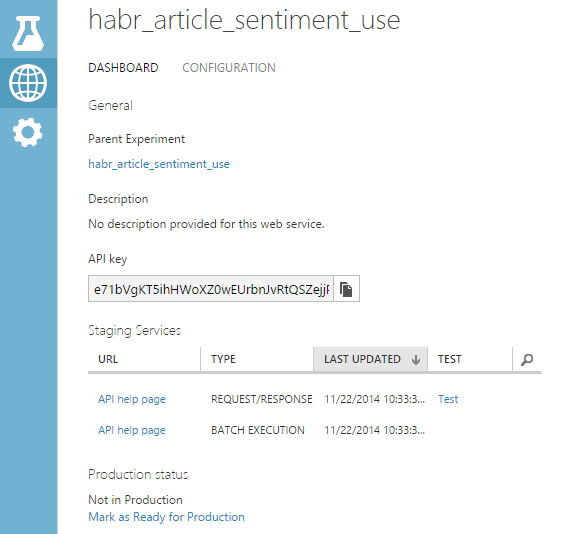
Next you need to set the input point of the web service - click on the first input of the R-script block and select Set as Publish Input. Similarly, set the output: click on the output point “Result Dataset” and select Set as Publish Output. Now you can finally publish the web service - click on the Publish Web Service on the panel below (if this button is unavailable, just start the experiment, after its execution it is activated). After confirmation, you will be transferred to the newly published web service page:
From here you can go to the generated web service help page - to do this, click on the API Help Page in the REQUEST / RESPONSE line. This page contains comprehensive information on how to use the web service, even code samples in different languages. Let's try to make the first request - using your favorite REST client, send the following JSON service:
{ "Id": "score00001", "Instance": { "FeatureVector": { "text": " , ... , , ... " }, "GlobalParameters": {} } } In response, we will come:
["-1"] Conclusion
That's all! As you can see, using Azure Machine Learning is very simple, although at the moment there are some problems. But, like Azure as a whole, Azure ML is developing very fast, and I hope that soon there will be no need for all these workarounds and the bugs will disappear.
In conclusion, here are two helpful links:
- Fast start to Azure Machine Learning: http://habrahabr.ru/company/microsoft/blog/236823/
- The Machine Learning Center on the Azure website: http://azure.microsoft.com/en-us/documentation/services/machine-learning/
Source: https://habr.com/ru/post/243705/
All Articles