White Cube on guard of air purity, part 2
The second part of the publication on the White Cuba.
In the first part , a homemade device for measuring environmental parameters was described. This is the second part of the publication.
White Cuba construction
')
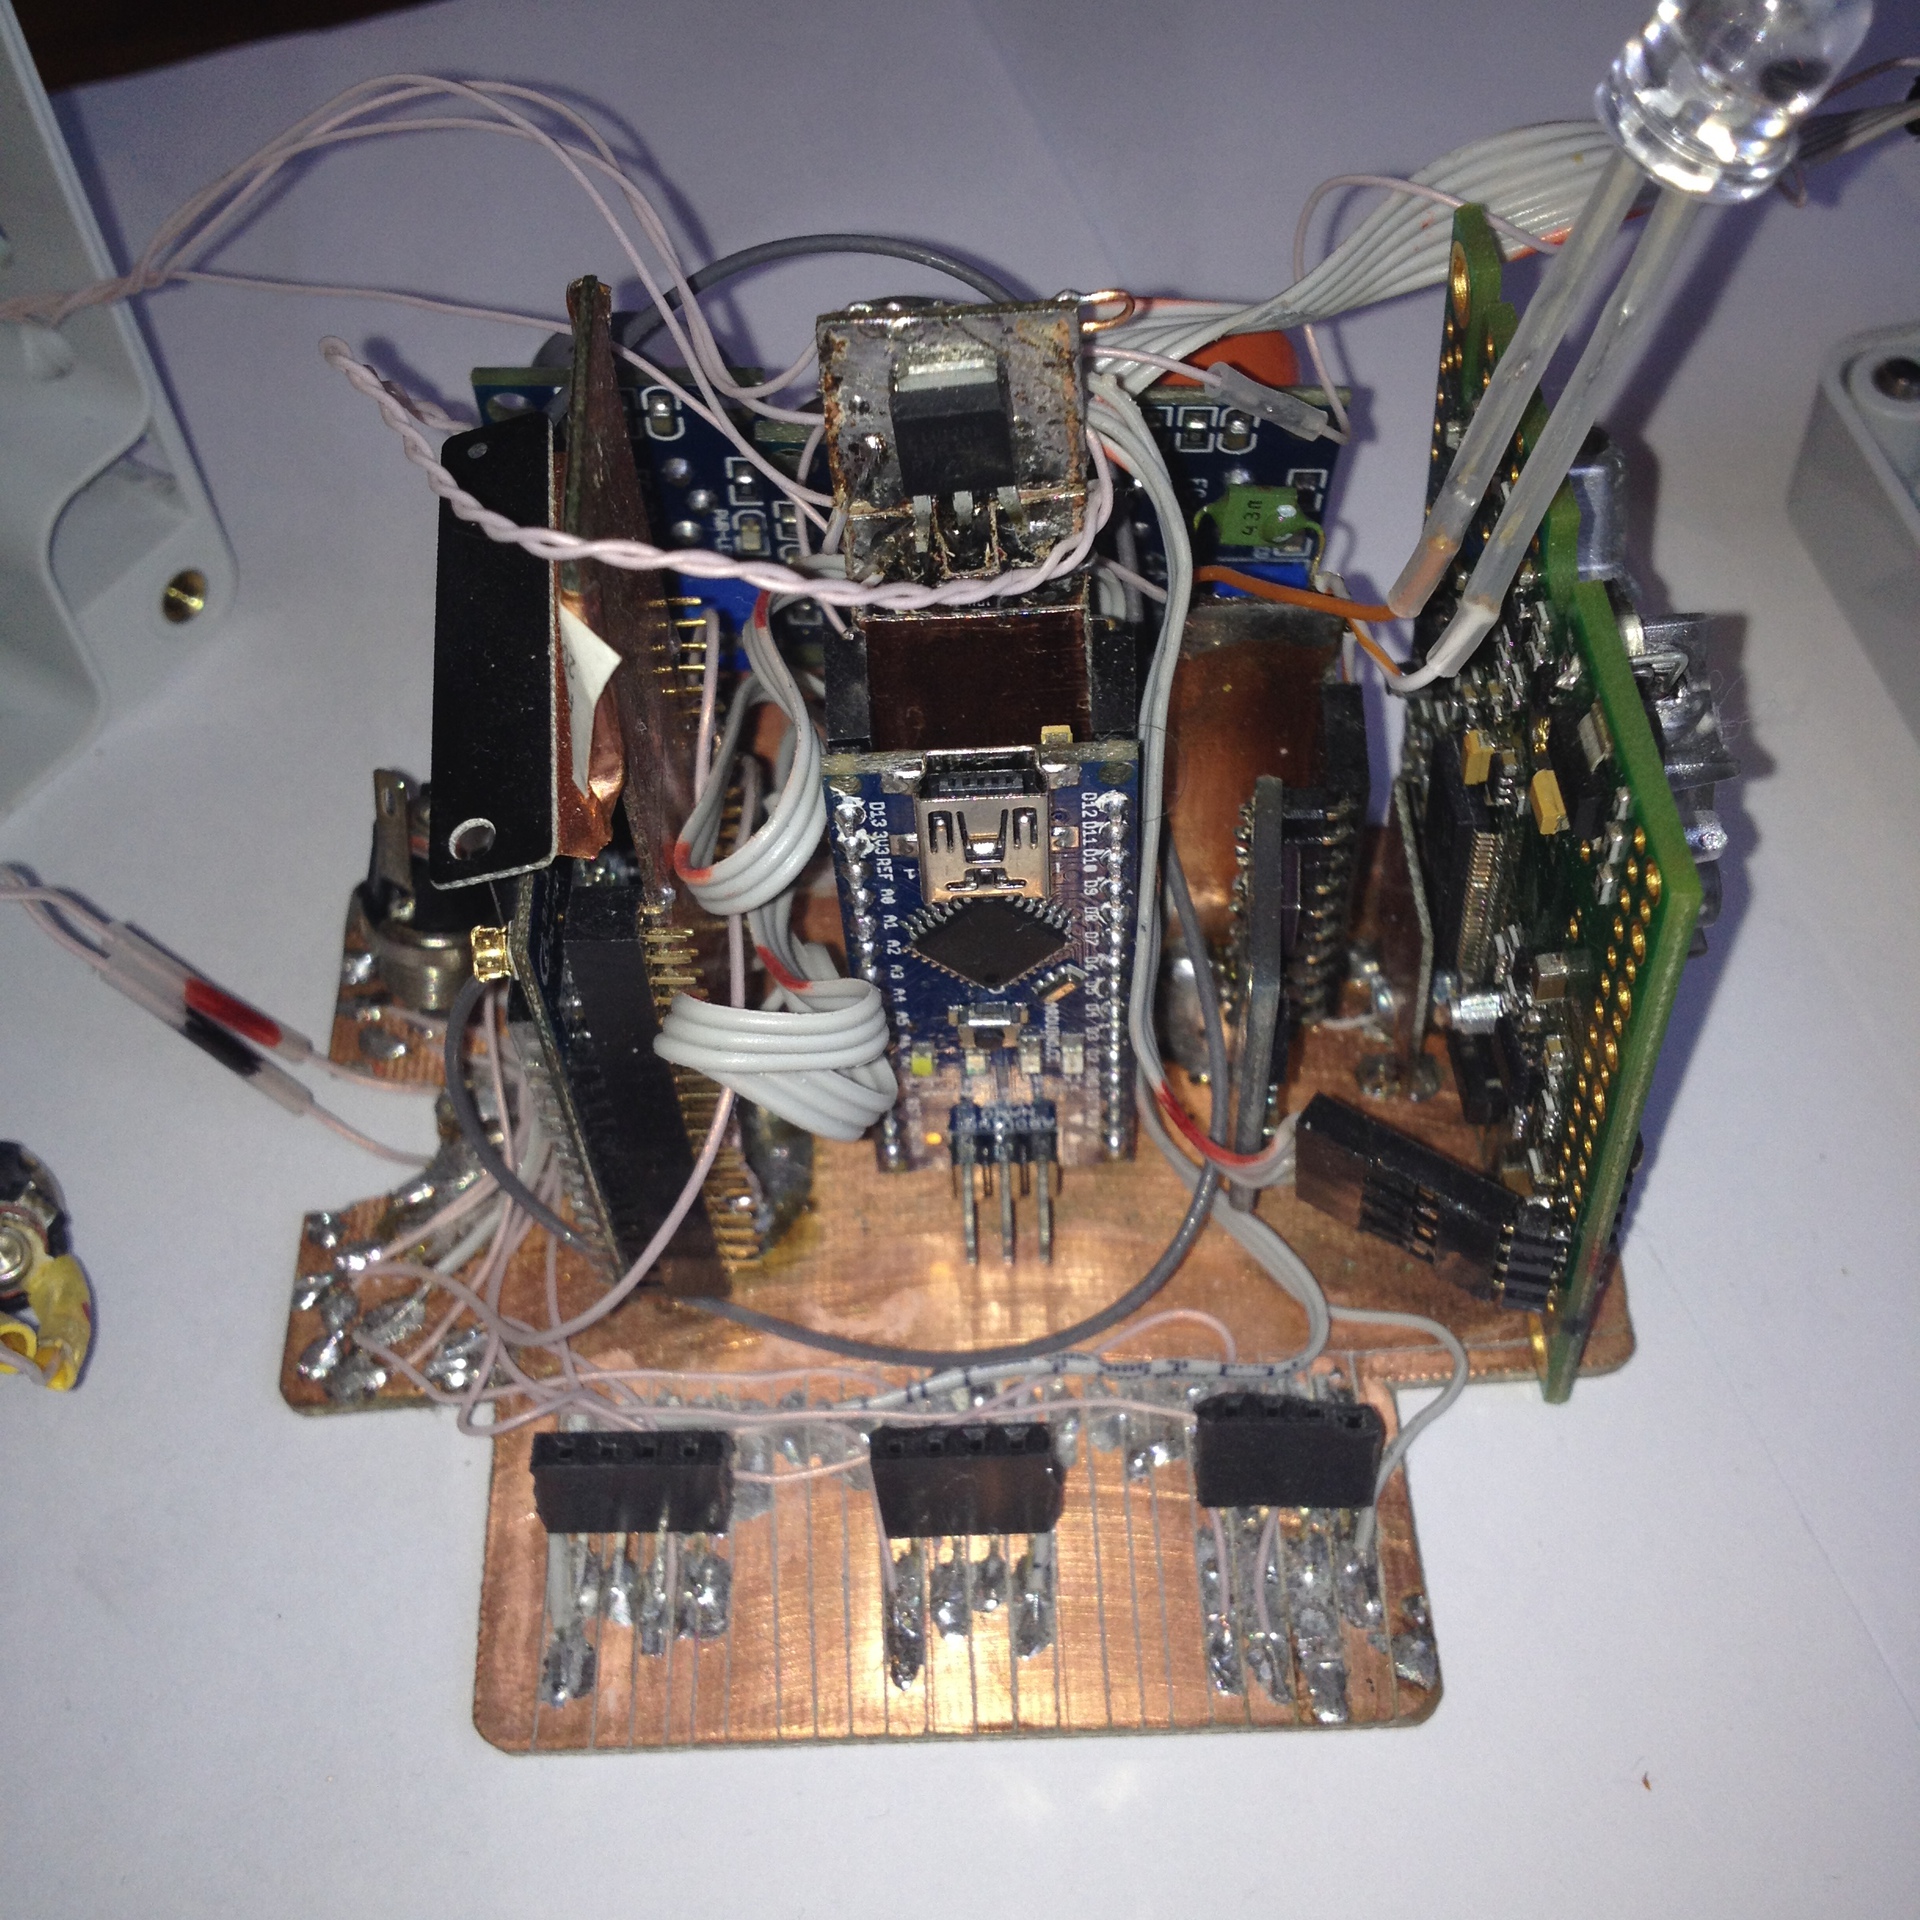
The main module of the BC is mounted on the basis of double-sided foil fiberglass. The base is cut in the shape of the bottom of Cuba. On this plate, slits were made with a stationery knife for mounting connectors for gas sensors, power distribution.
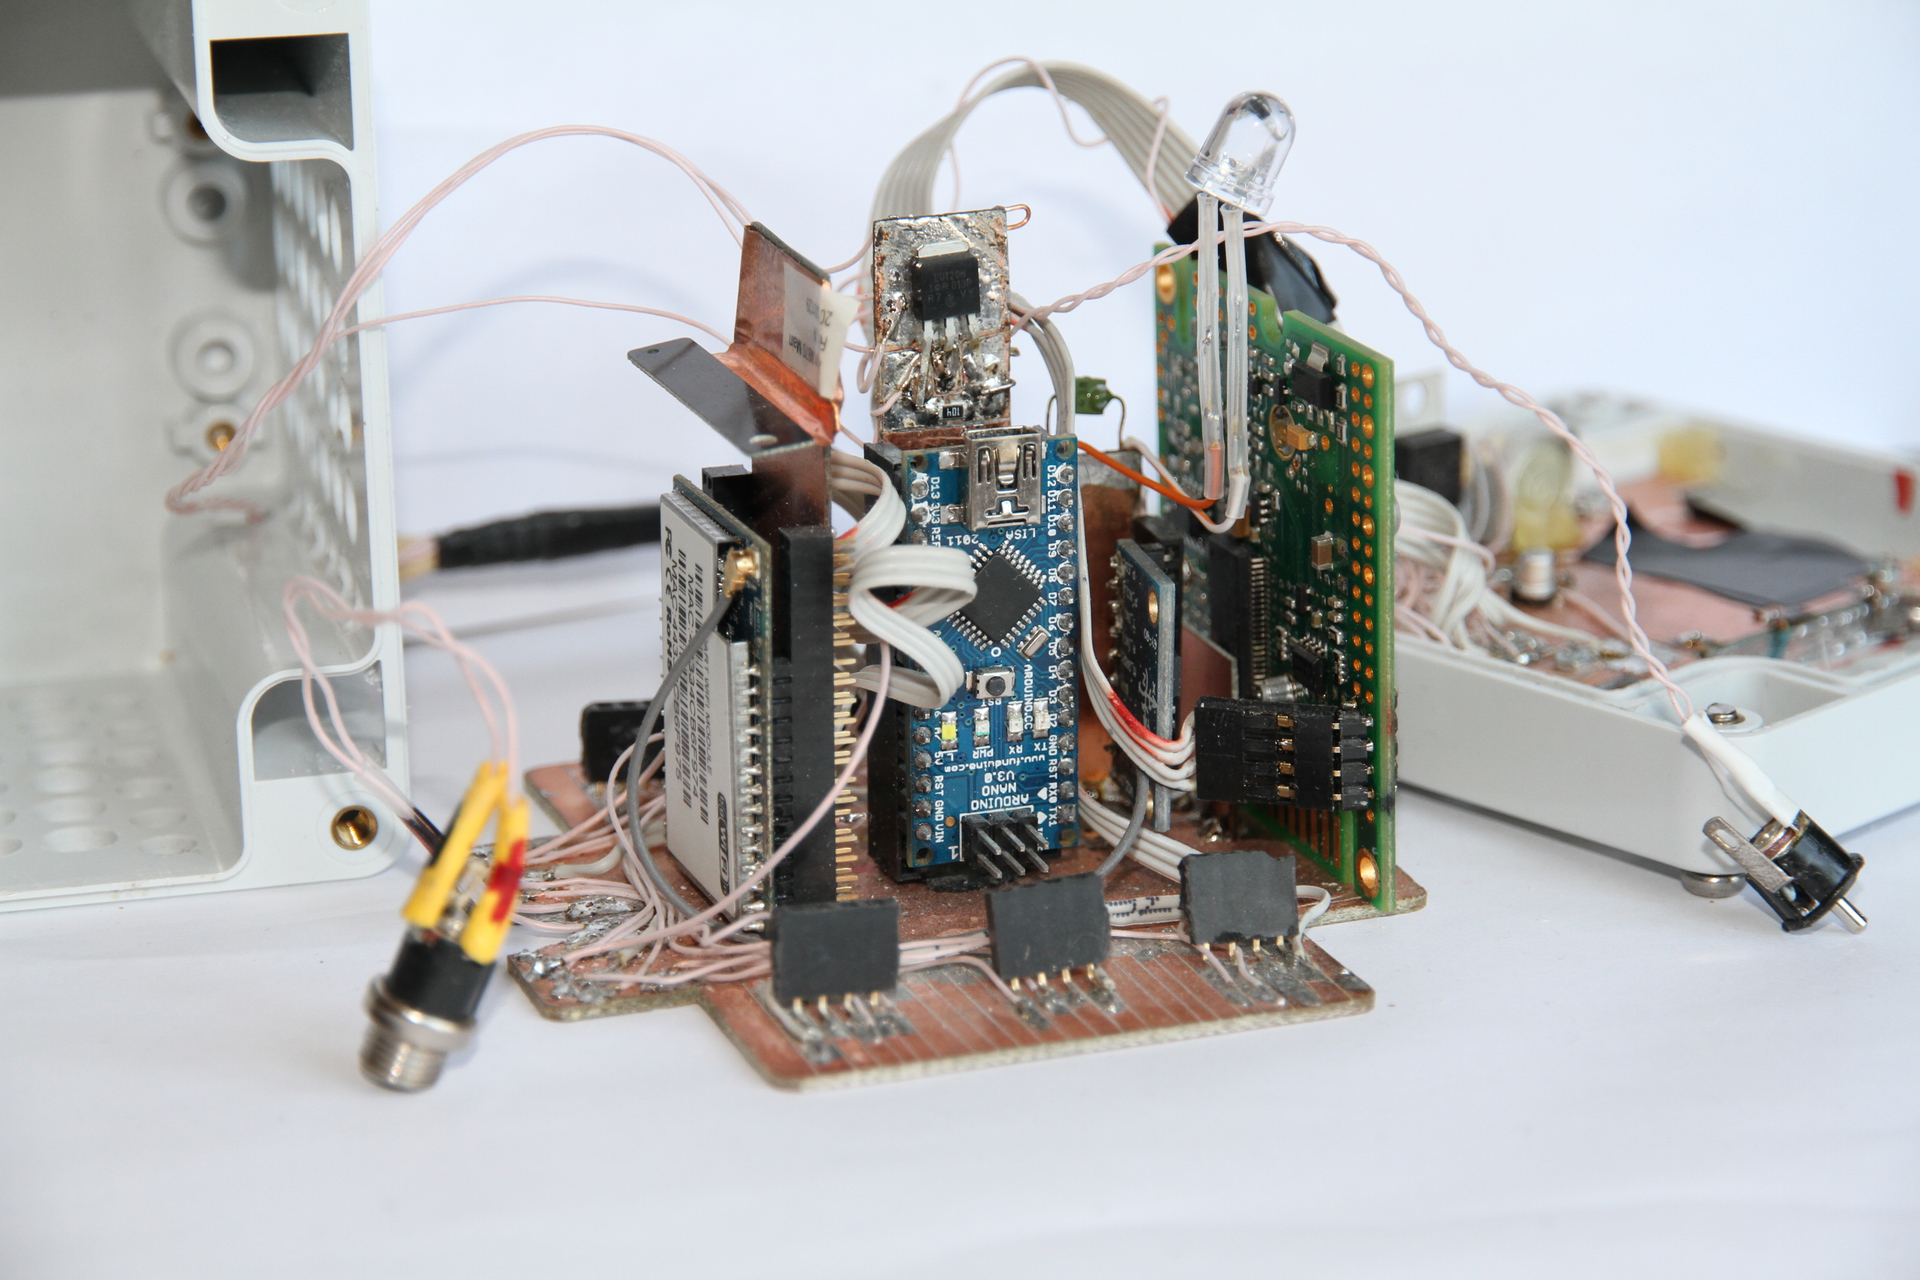
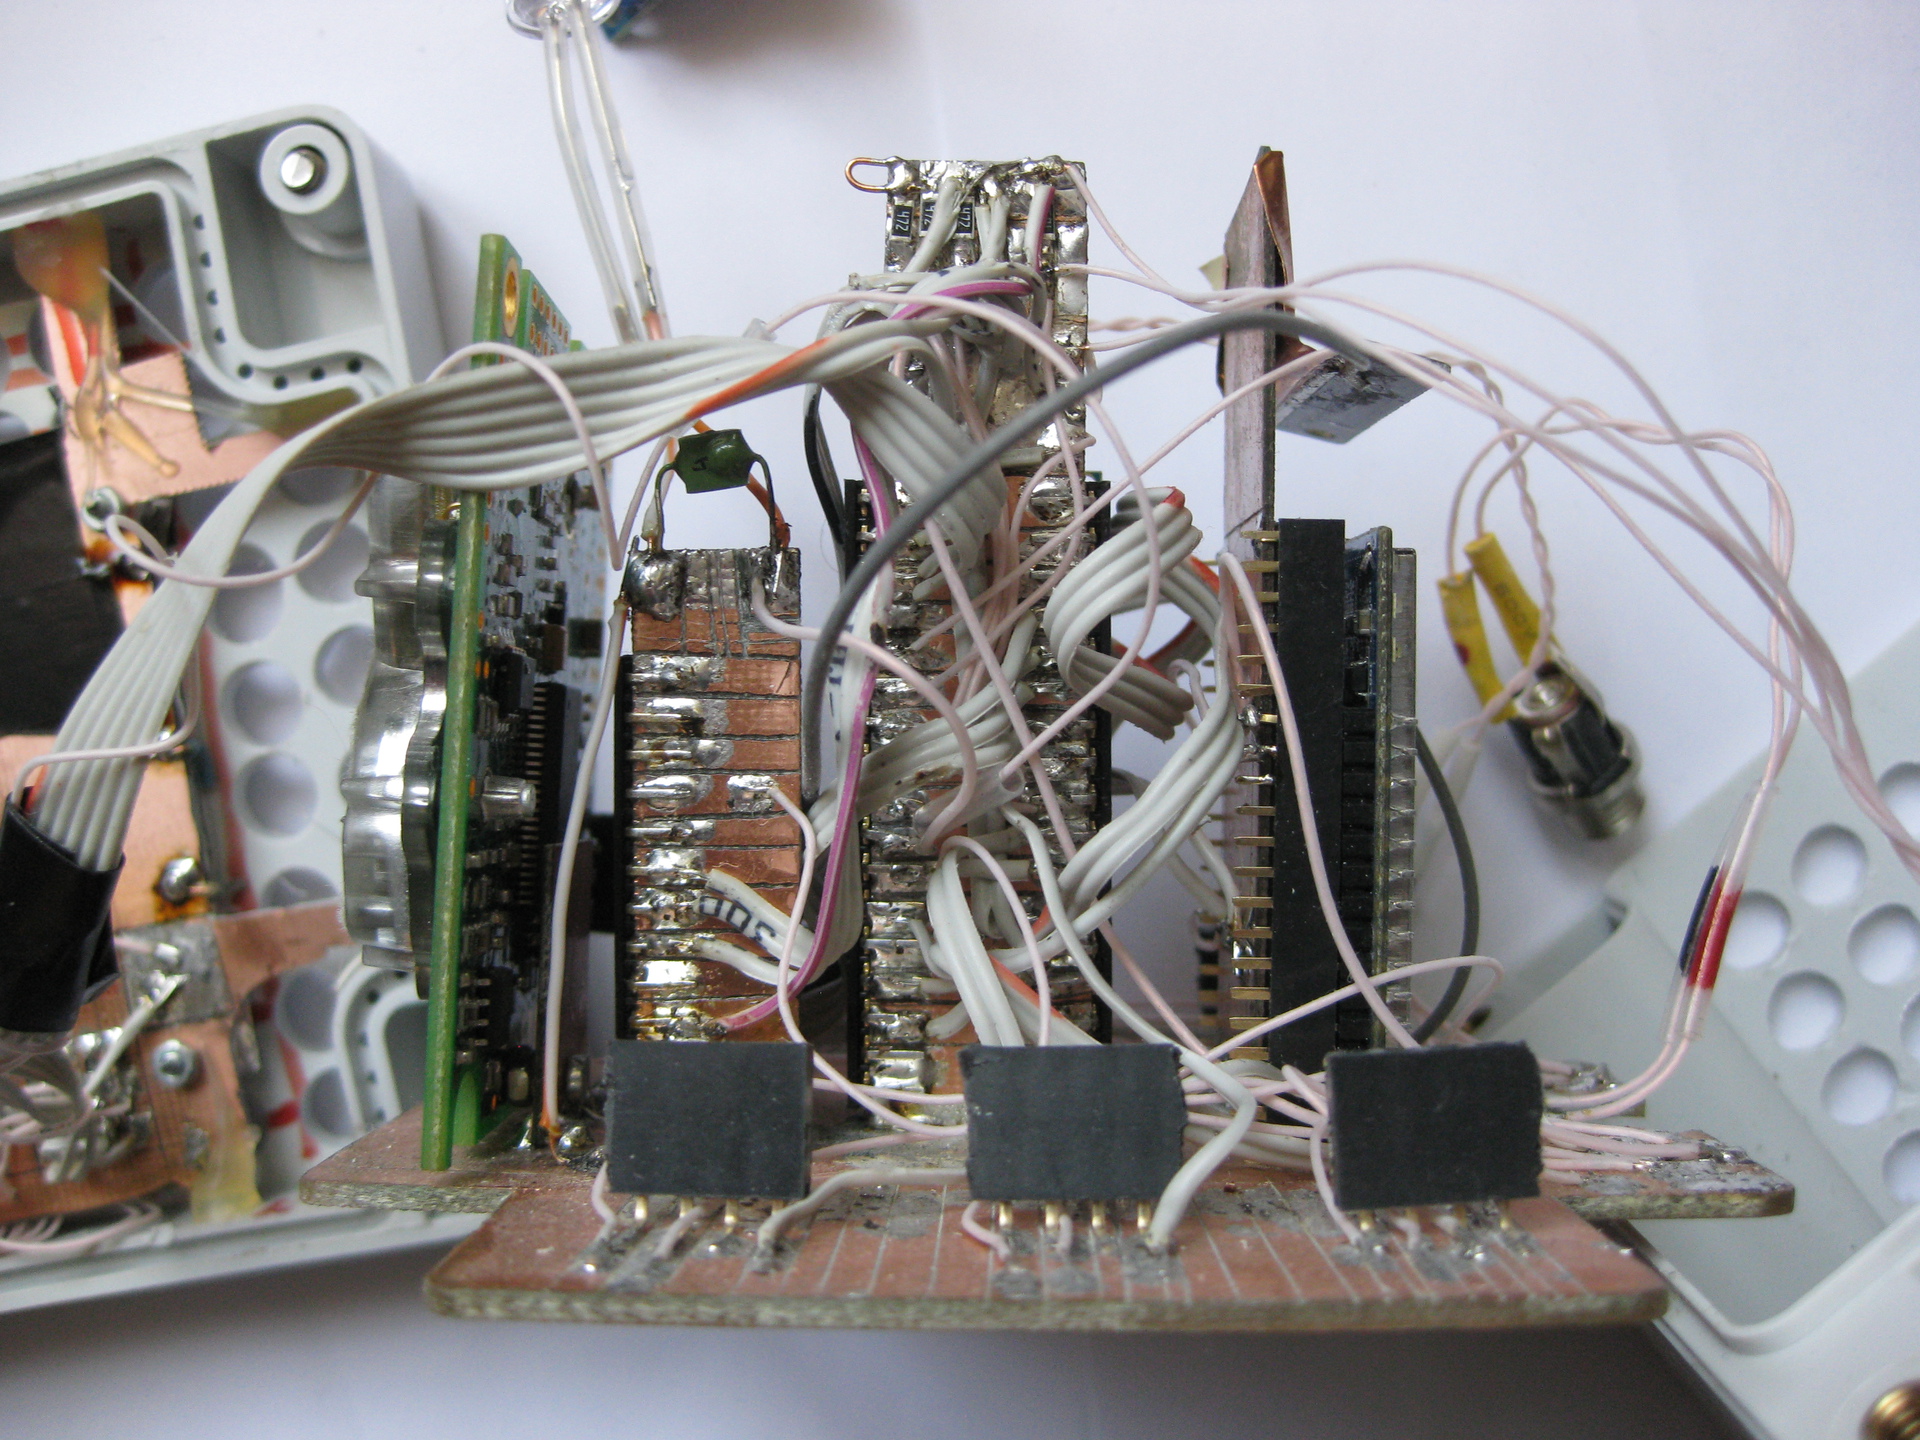
Arduino Nano, Wi-Fi module and a module with pressure sensors, etc., are mounted on vertically mounted slats. The pads are made contact pads by erupting the foil, the connectors are soldered from the sides. Connectors purchased in Brown Bear. The Wi-Fi module has a connector with a pitch of 2 mm, rather than the standard 2.54. The height of the bar is made larger than the height of the modules, the remaining space is used to accommodate discrete elements (the CO sensor heating control transistor, I2C and 1Wire pull-up resistors, etc. The picture also shows a loop of a wire, I used to debug the system for connecting earth pin of the oscilloscope probe and the probe tester.
The slats are installed at the place of soldering to the base. To reliably melt the solder, you need to use a powerful soldering iron, I have a 100 watt thick copper tip made in USSR.
The power supply of the BC is provided from an external power source of 5V to 2 A. I used a source from a faulty DLINK router. BC consumes slightly less than 2 A and the power supply has a current margin. Built-in stabilizer Arduino is not used. When debugging, you can power the BC from the computer, but the analog gas sensors must be removed from the connectors, otherwise the current from the USB is not enough. Simultaneous connection of external power supply and USB is not recommended. My USB port in the Lenovo X200 laptop did not burn, but it did not work either. There are no guarantees that you will not burn, I strongly advise against doing so.
On the case of BC fixed two identical round connectors. One is for power supply, the other is for connecting a loop with 18B20 temperature sensors. Not quite the right decision in terms of fool resistance (you can confuse the connectors), perhaps in the future I will replace the sensor connector with another type.
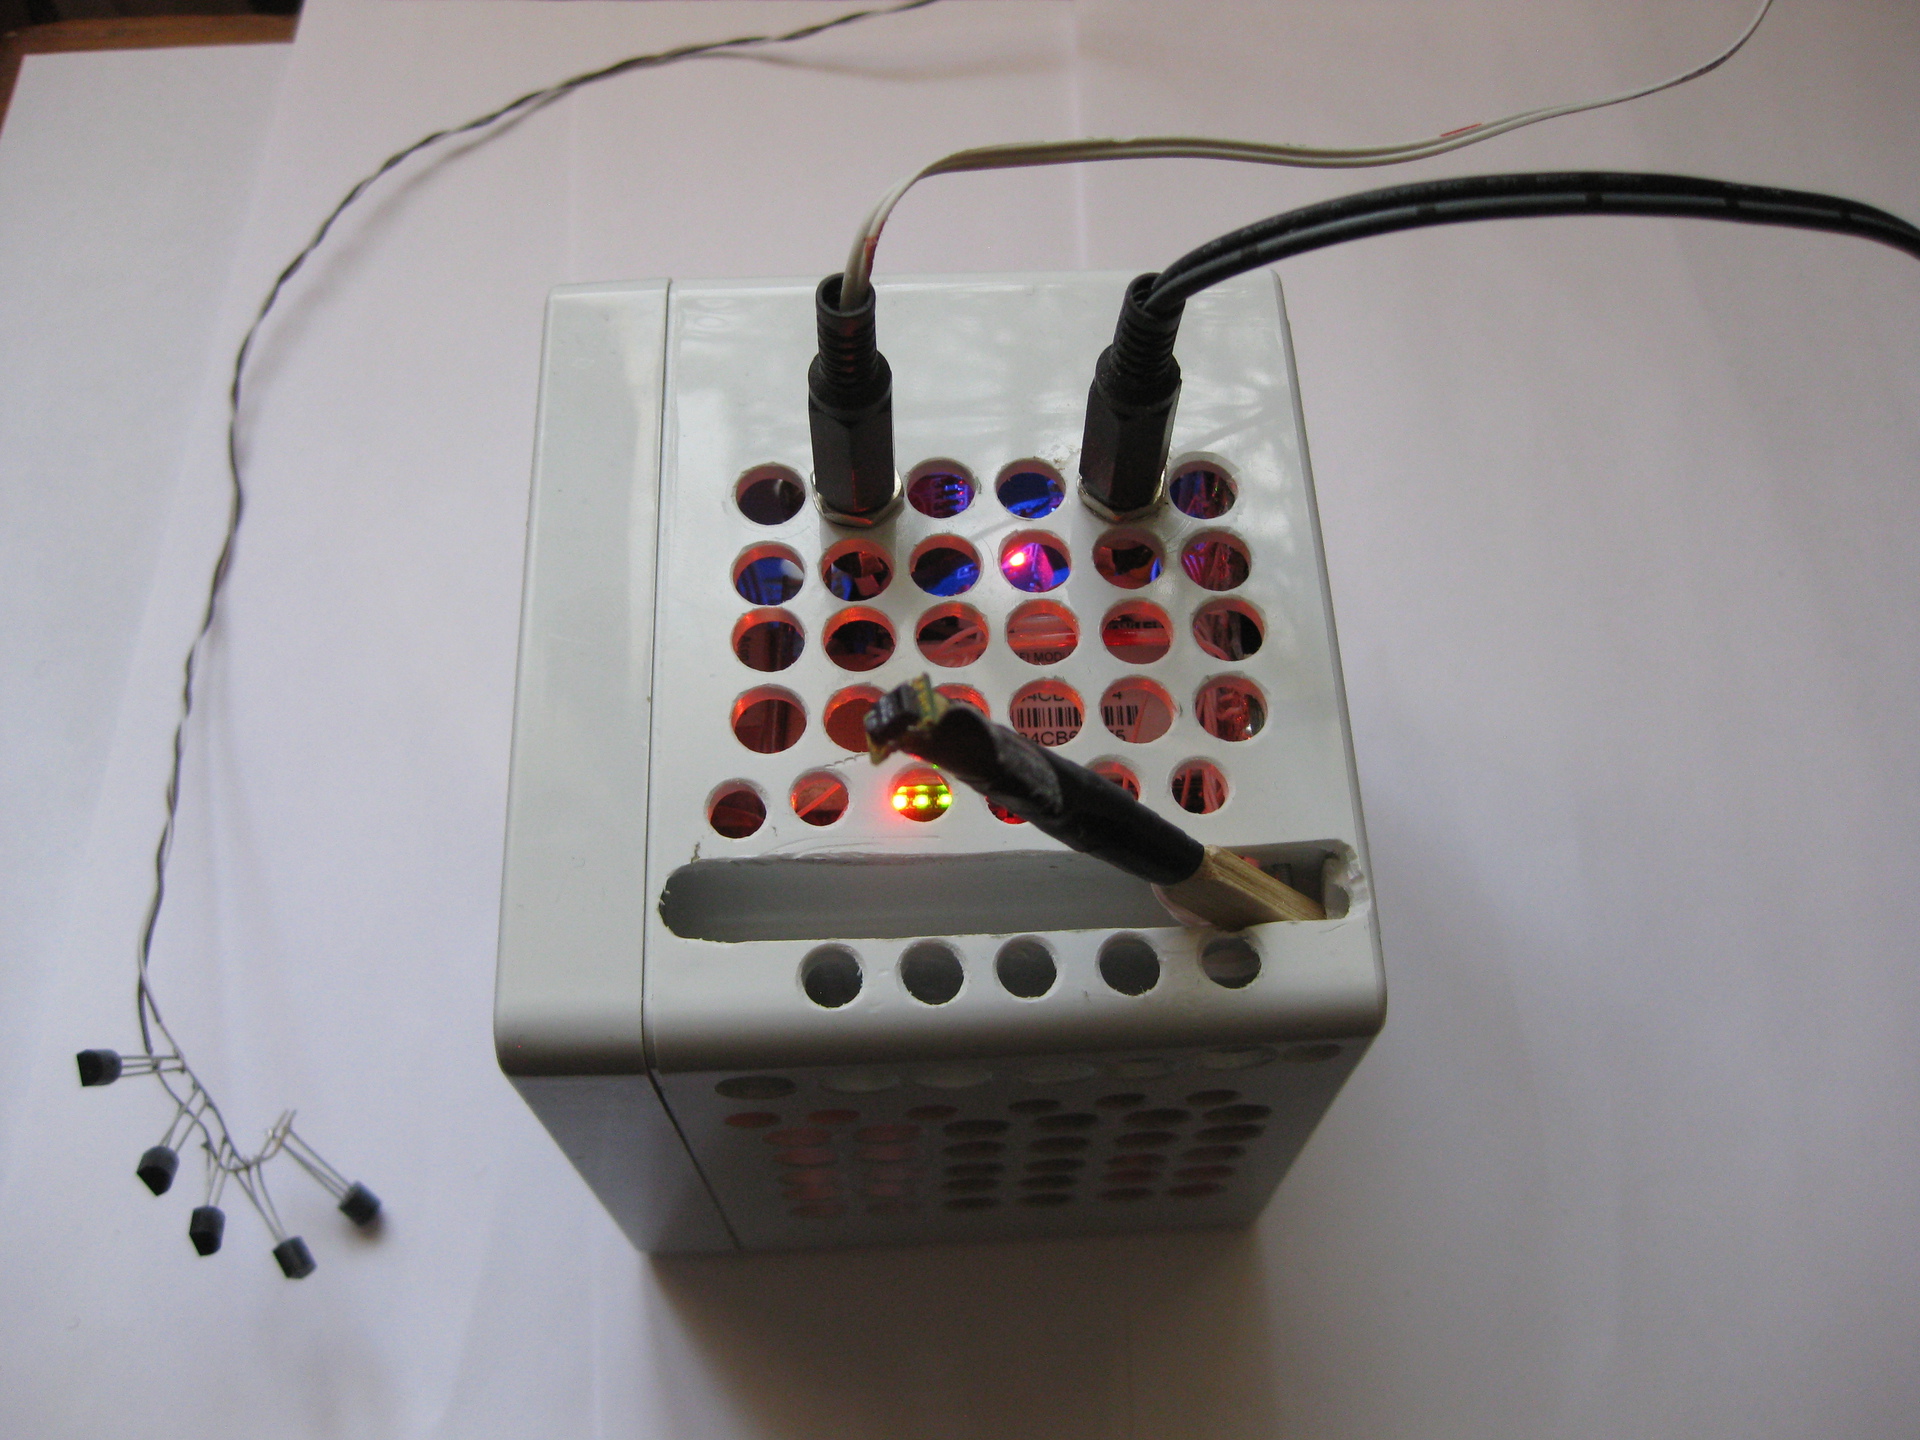
Holes 8 mm in diameter are drilled for cooling and exchange with the external environment. Since the applied gas sensors require heating of the measuring surface, quite a lot of heat is released inside the White Cuba. At a voltage of 5 volts, the current consumption is about 2 A, which gives about 10 watts of heat. Inside, the White Cube is heated to a temperature of about 40 degrees, according to the temperature sensor readings from BMP085. Such a high internal temperature led to the need to make the humidity sensor and the ambient temperature outside of Cuba, otherwise the readings of the humidity sensor are noticeably distorted.
After a series of experiments in an attempt to make the thermal insulation of the sensor from the body without moving parts, I stopped at a rotary heat insulating bracket. The bracket is made of standard wooden chopsticks :) The SHT10 sensor is fixed on the end.
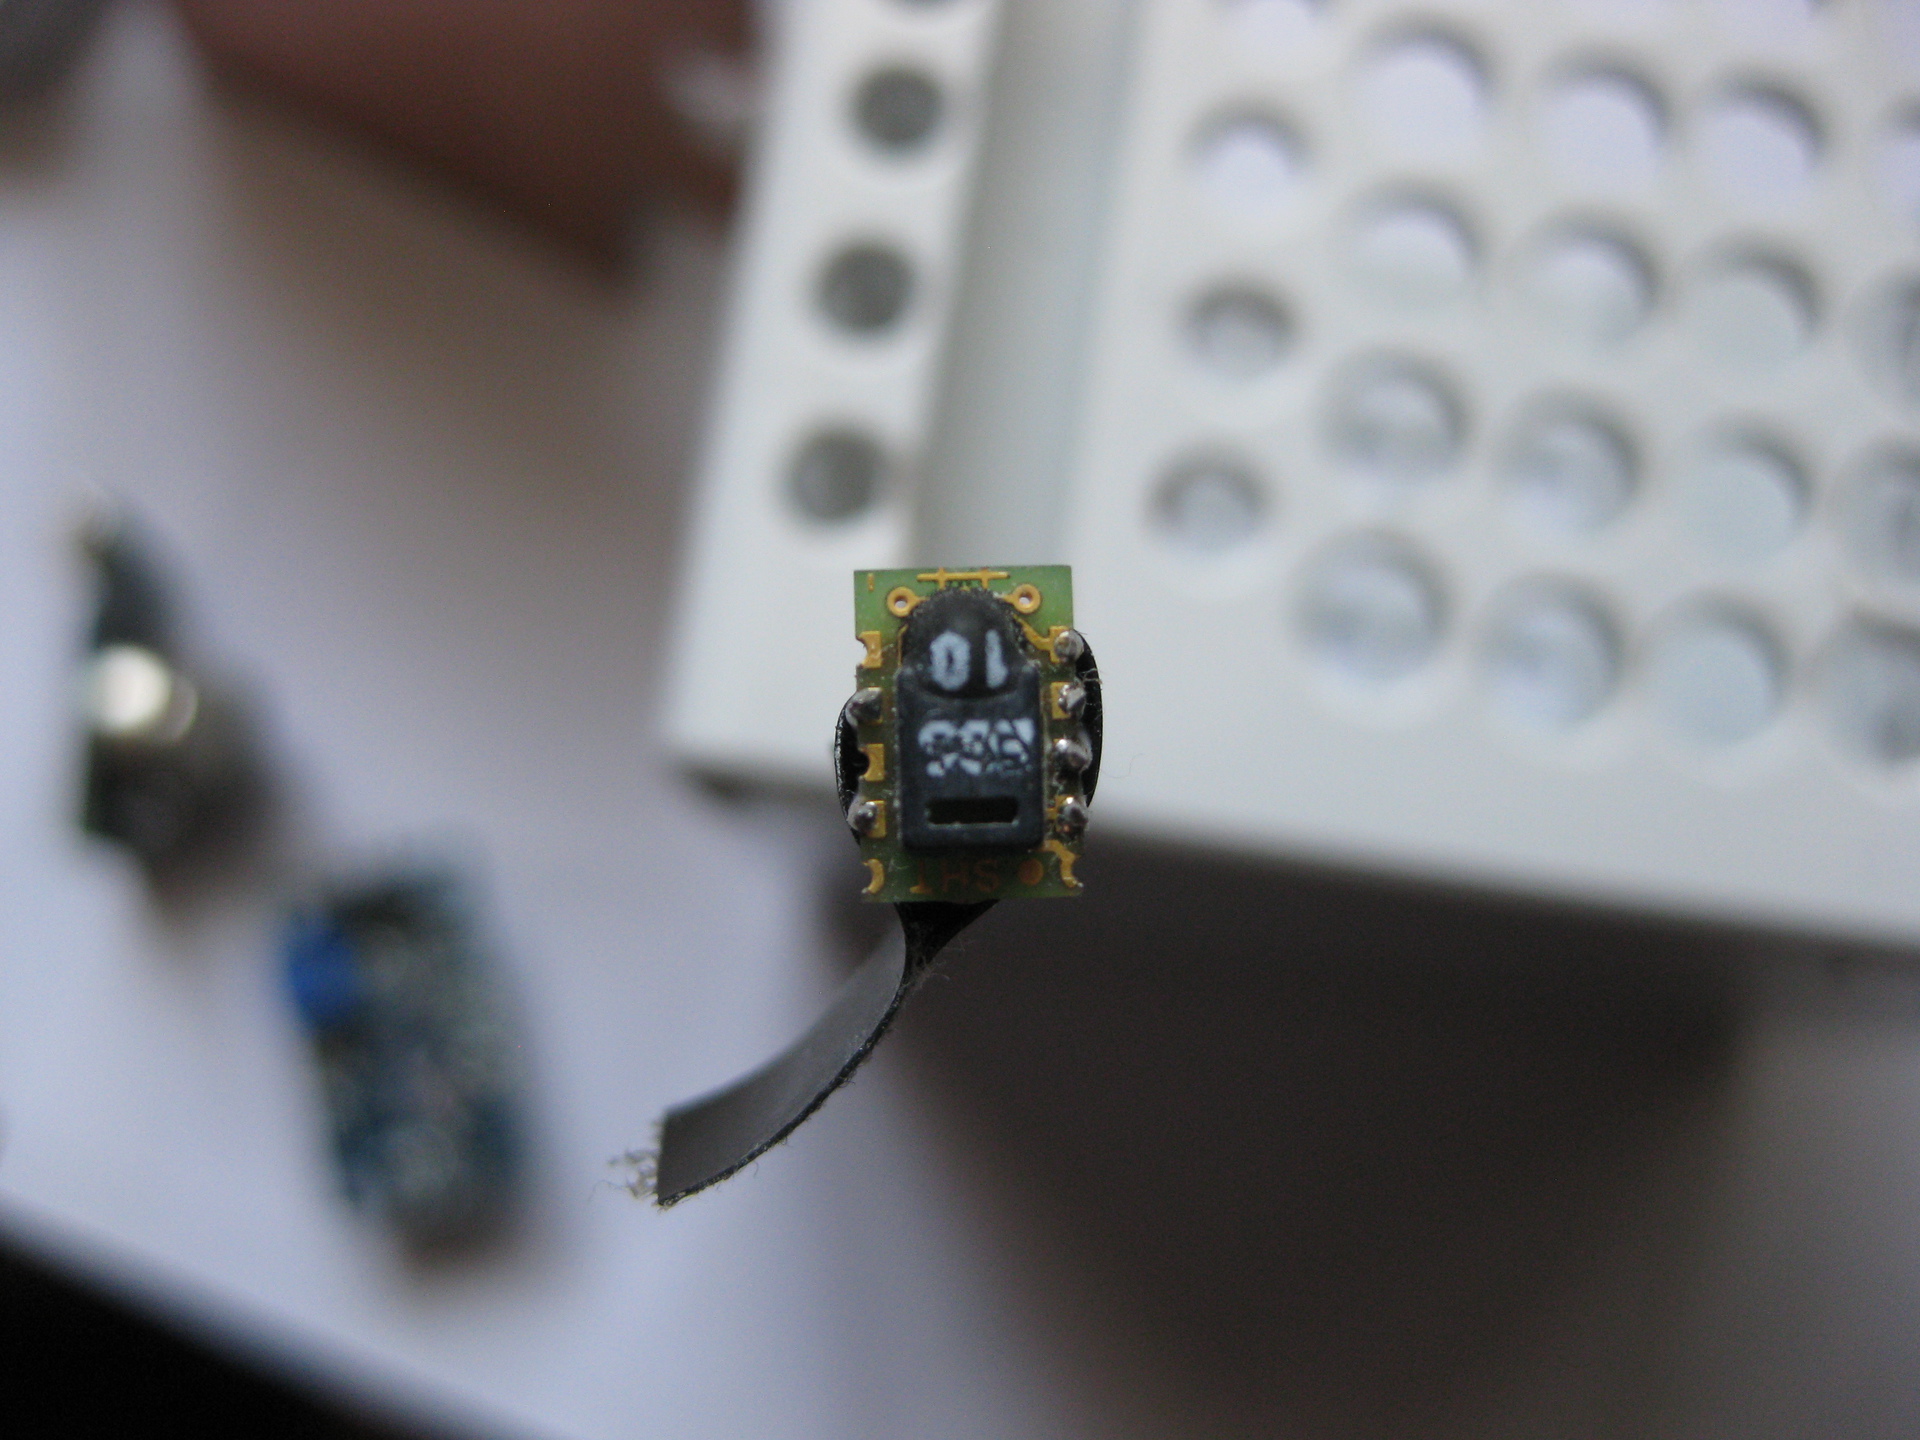
The sensor has soldering points on both sides, although only one side points are used for the exchange. The points from the second side are used for fastening - a pair of short, unwired wires are soldered to them. This made it possible to securely attach the sensor to the end of the bracket.
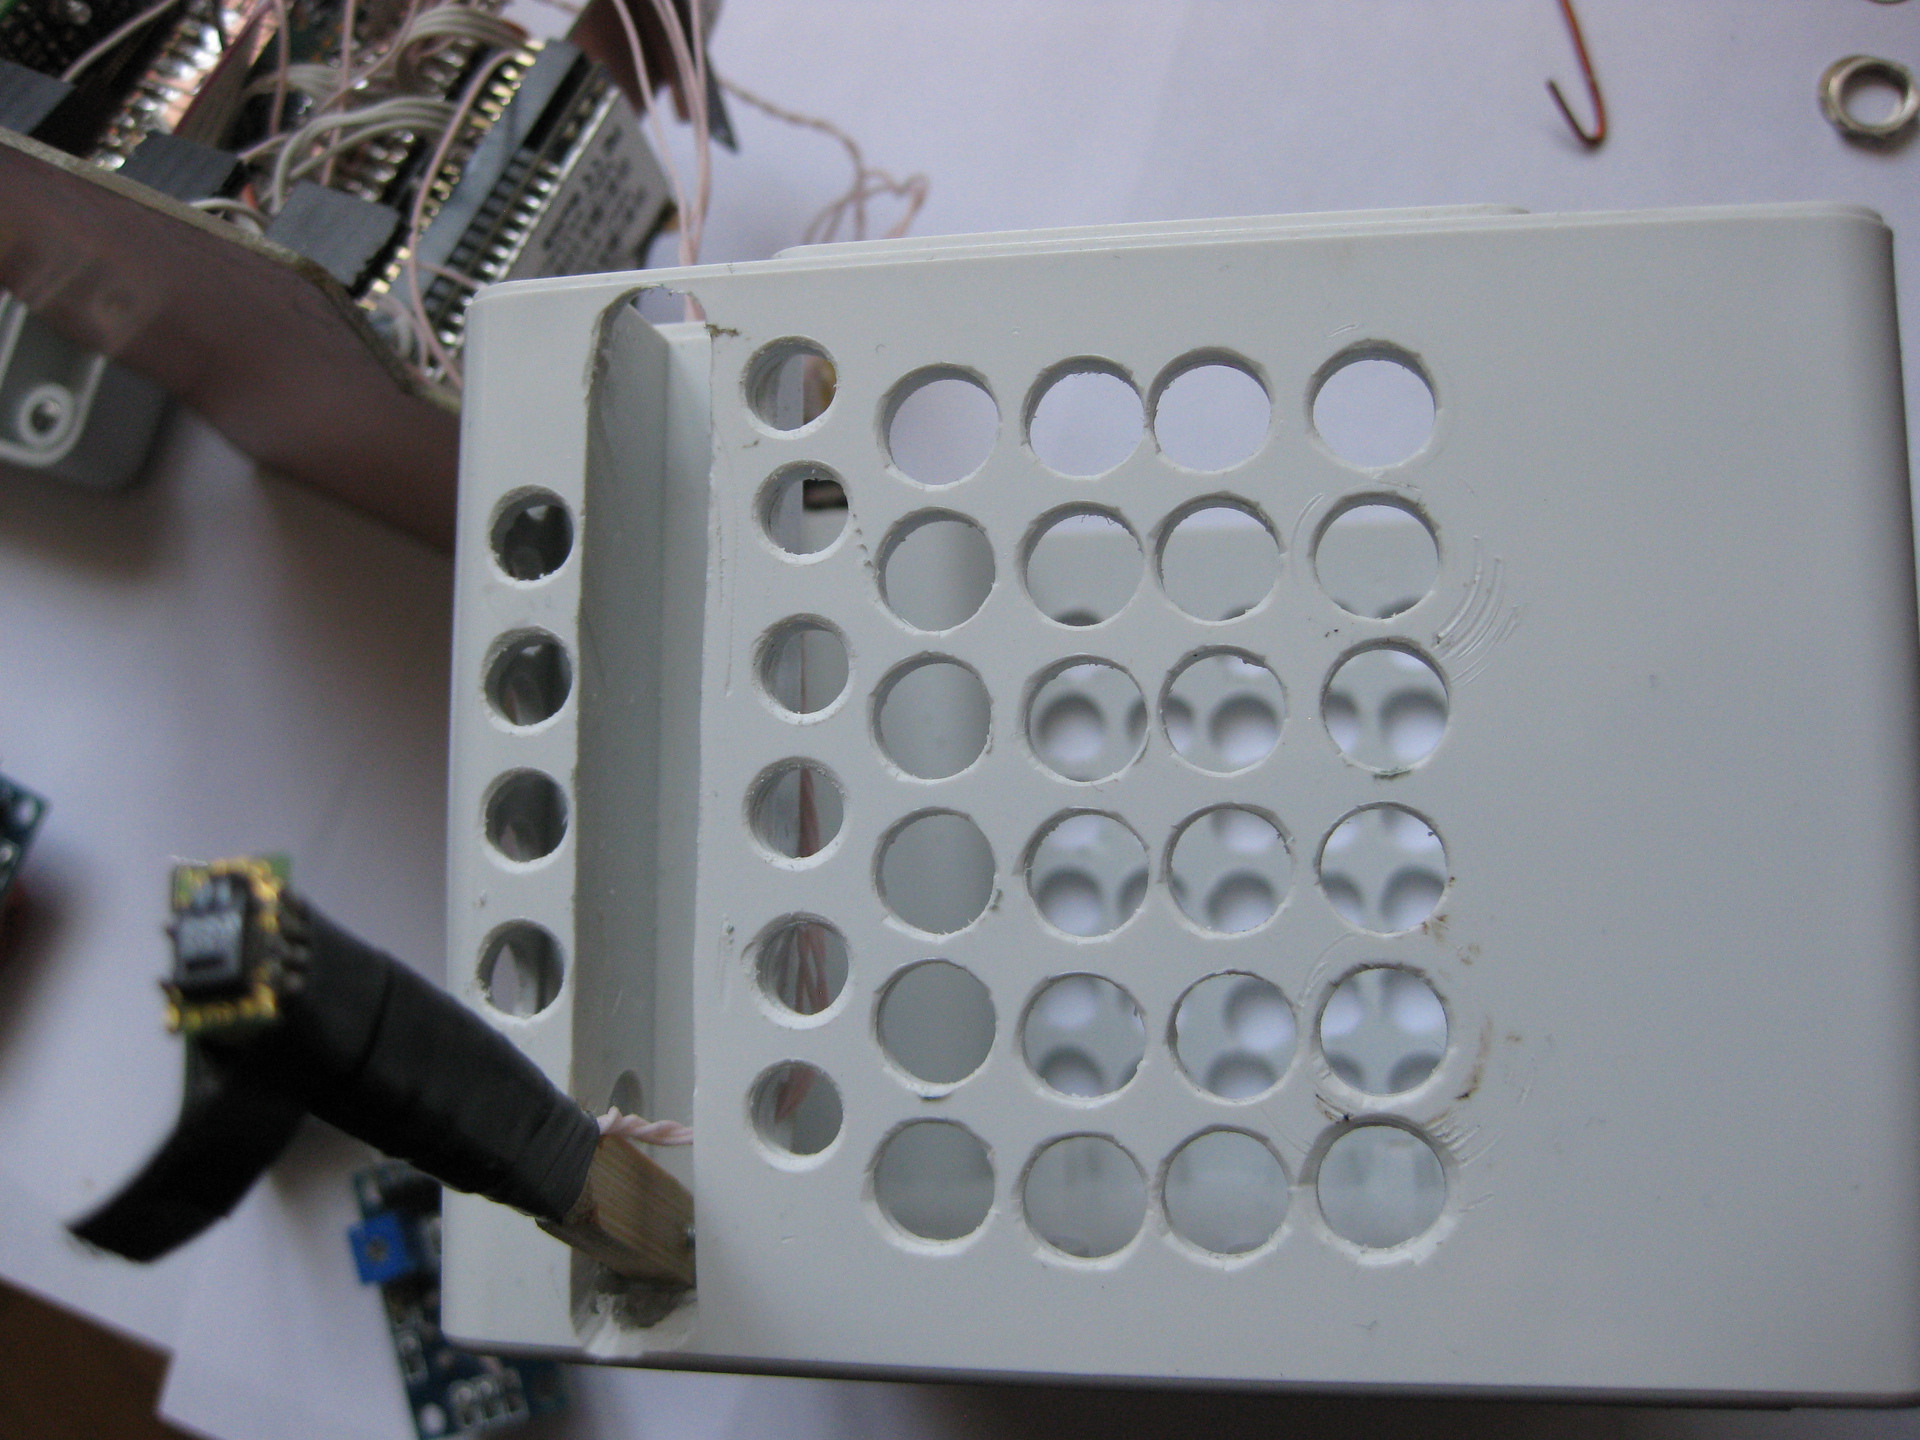
A high rectangular hole is made in the side surface of the cube. The bracket with the SHT10 sensor moves into this groove. This is done to protect against damage to the bracket and the sensor when carrying it; otherwise, it is easy to break the protruding 10 cm bracket. For easy removal of the bracket, a petal is made of black insulating tape. The mechanism allows you to remove the sensitive sensor in the case when carrying the Cube and easily get the sensor by turning the bracket when the system is in a stationary position.
The diameter of the holes in Cuba for cooling, their number and location is determined from the engineering-intuitive reflections and memories of the subject "Rags", they are also the "course of the property of electrical radio materials", in which they talked about the design of passive REA cooling systems. The main thing that matters is the diameter of the holes, which should not be small for the air to pass through them.
The Wi-Fi module came from China without an internal antenna, only with an external U-FL type connector. I was forced to buy additional antennas in DESSY.RU for mounting inside the case (ANT 2.4 ESG-2400-12 UFL-F, the price is about 150 r). I would have known in advance - I would have ordered the exact same antennas along with the modules. Unfortunately, on the seller’s website (DX.COM) a photo of the module with an internal antenna and the description both the presence of an internal and external antenna is mentioned. However, I opened the ticket and returned the money for the antennas. As I already mentioned, this module is a truncated version of the router, to which you can connect up to four additional RJ45 connectors. Inside there is a Linux. By default, after switching on the module is configured for the access point mode with the password “12345678” (and not “0000000”, as erroneously stated in its description). To start the module, you need to connect an antenna and power 5 volts to pin 1 and ground to pin 2.
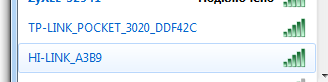
After about a minute, a device of the HI-LINK_A3B8 type will appear in the Wi-Fi environment, where the last characters correspond to the MAC address of the module written on the panel.
Connect, enter the password (12345678), configure the TCP \ IP protocol of the machine in the network 192.168.16.. The default module address is 192.168.16.254, the login password is admin \ admin. I changed the mode of the module to WiFi Client Serial. This is the mode in which the module connects to the home access point and provides a transparent transfer of serial data:

The first serial port is configured for 38400 speed and is set to server mode. The remaining settings are unchanged.

The second serial port is also set to server mode, the rest is unchanged. With test targets, the Tx signal (pin 22) is fed to the Rx input (pin 26).
As a result, when contacting 192.168.1.155:8080, the first serial port is available, at 192.168.1.155:8081 - the second one, and the router itself - at 192.168.1.155:80.
The module also can show the signal level. You can compare the work of two external antennas in the same conditions. According to my data, it turned out that the purchased flat antennas work better than the whip antennas from the old WiFi PCI card.

You can check the operation of the module using the PUTTY program in the telnet connection mode.
The first serial port operates at speeds up to 115200, the second - up to 57600. In the White Cuba, the second serial port is not used.
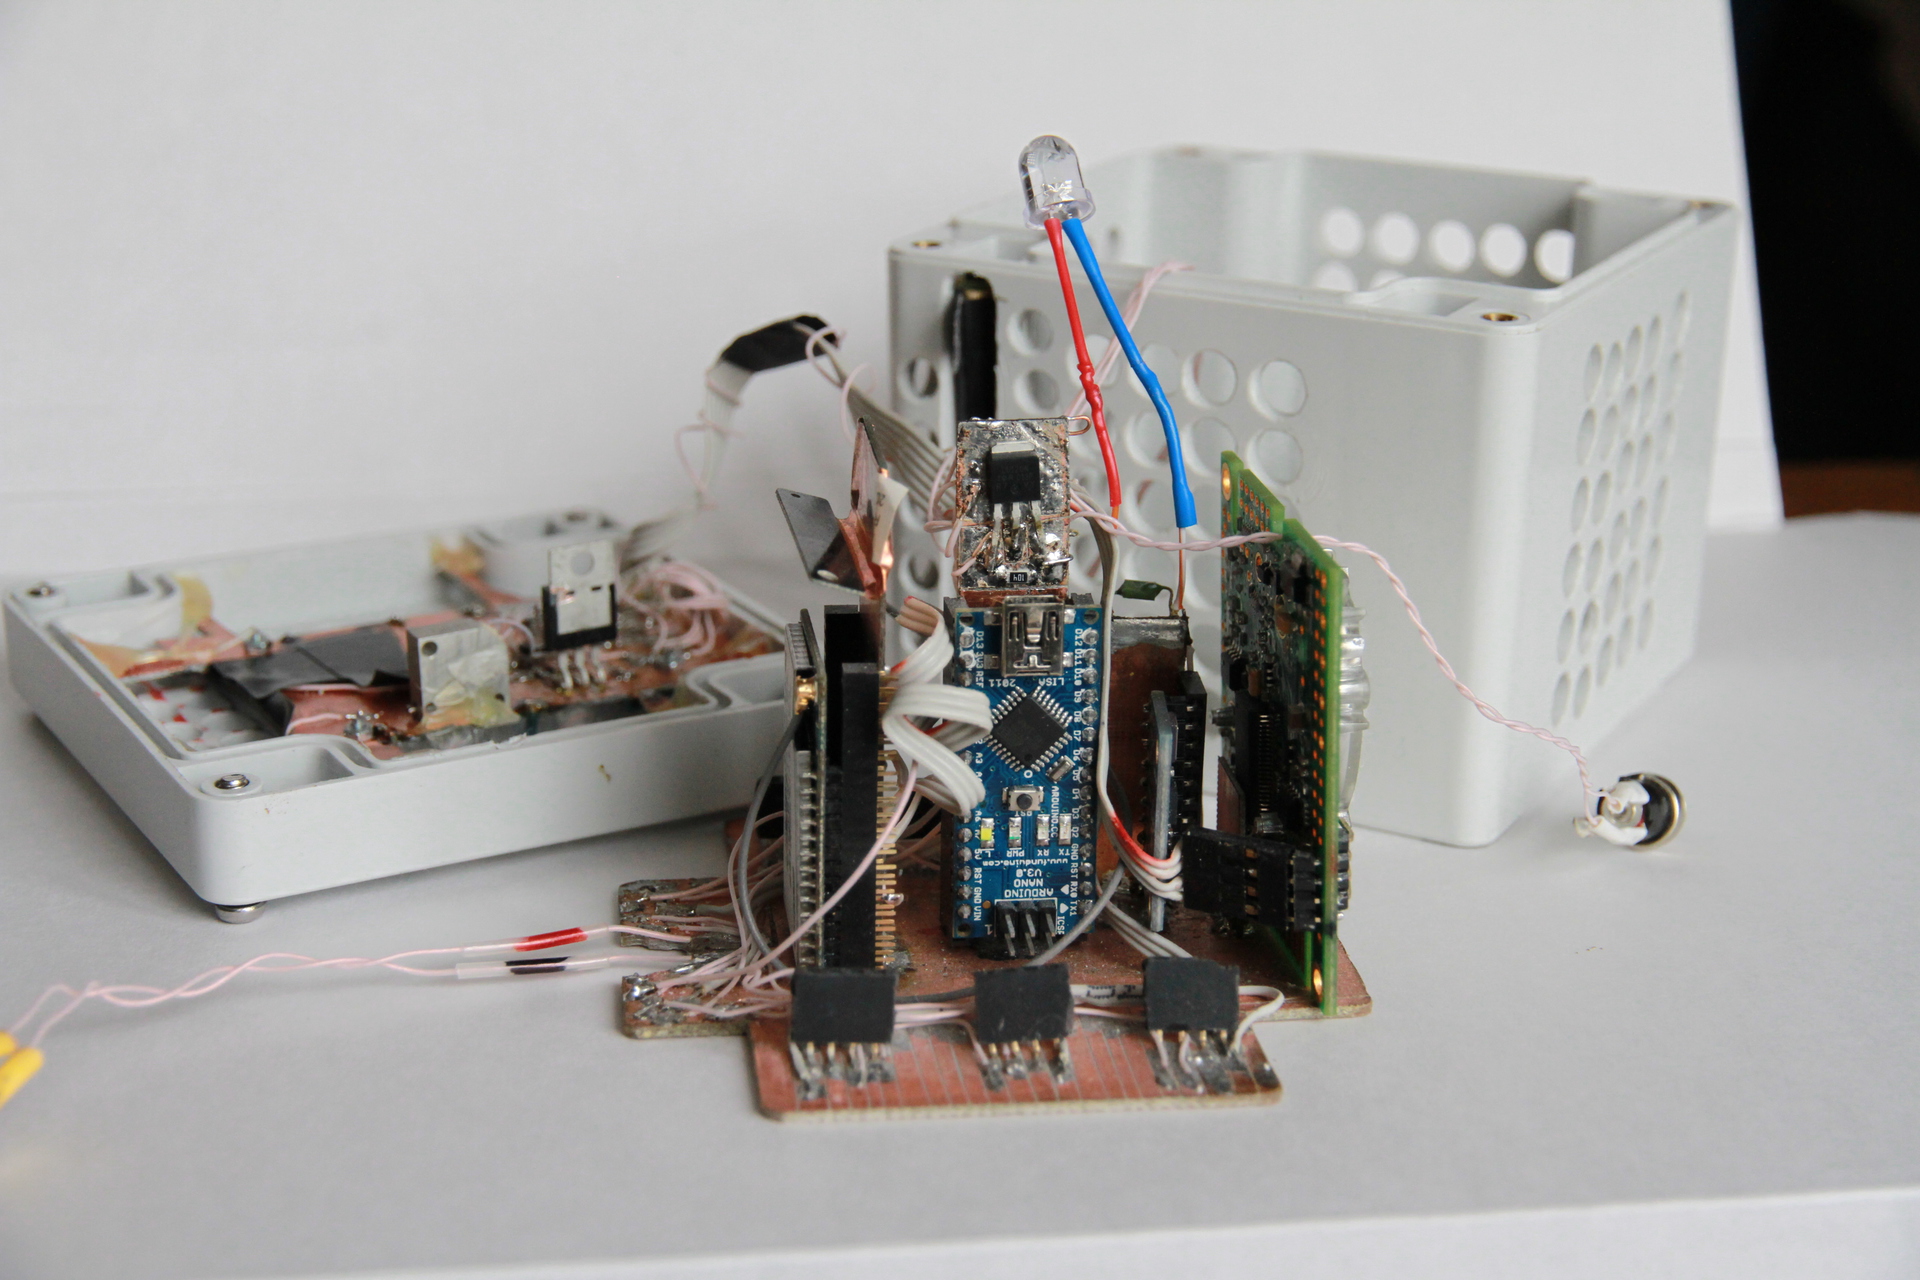
A few more photos of the internal arrangement of BC:

Recalculation of the readings of analog gas sensors into a digital value in ppm (parts per million, parts per million).
From the medical literature, I extracted the following data:
Acute effects of carbon monoxide poisoning
in relation to the environmental concentration in parts per million (concentration, ppm):
35 ppm (0.0035%) - headache and dizziness within six to eight hours of continuous exposure
100 ppm (0.01%) - a slight headache after two to three hours of exposure
200 ppm (0.02%) - slight headache after two to three hours of exposure, loss of criticism
400 ppm (0.04%) - frontal headache after one to two hours of exposure
800 ppm (0.08%) - dizziness, nausea, and cramps after 45 minutes of exposure; loss of feeling after 2 hours
1600 ppm (0.16%) - headache, tachycardia, dizziness, nausea after 20 minutes of exposure; death in less than 2 hours
3200 ppm (0.32%) - headache, dizziness, nausea after 5-10 minutes of exposure; death in 30 minutes
6400 ppm (0.64%) - headache, dizziness after 1-2 minutes of exposure; convulsions, respiratory arrest and death in 20 minutes
12800 ppm (1.28%) - unconscious after 2-3 breaths, death in less than three minutes
Concentration
0.1 ppm - natural atmosphere level (MOPITT)
0.5 - 5 ppm - the average level in homes
5 - 15 ppm - next to a properly adjusted gas stove in the house
100 - 200 ppm - from car exhaust
5000 ppm - in the smoke from the wood stove
7000 ppm - in warm exhaust gases of cars without a catalyst
From these data it follows that it makes sense to measure the values of the CO level in the range from ppm to 100 ppm, and all values above this level are considered deadly. This is also confirmed by the fact that the first threshold in industrial sensors is set at 20 ppm, the second - 100 ppm.
The manufacturer of the MQ7 sensor provides in its manual all the necessary data for creating an algorithm for converting the readings of an analog voltmeter into ppm numbers. A careful examination of this document provides the following background data:
The resistance of the sensor in clean air can be in the range of 2–20 kΩ.
The load resistance is recommended in the region of 10 k. Examination of the details on the sensor printed circuit board showed that a 1 kΩ resistor is installed in the finished module. As will be shown later, such a load resistor gives the output voltage of the sensor in the range from about 400 mV in clean air to 5 volts with a CO value of about 1000 ppm. This range covers an order of magnitude CO measurement. A hazardous CO value of 100 ppm gives approximately 3.6 volts at the sensor output.
Graph of the ratio of the sensor resistance to the level of gas in the mixture:

Fat black lines are added by me to check the formal correctness of the data. I checked whether three lines converge at point 0 — the vertical axis y, the horizontal straight line of the sensor resistance in clean air, and the line of sensor resistance versus the impurity level of the detected gas in the mixture. As you can see - there is a practical hit in one point, taking into account the errors.
Using this graph, you can make a table of the dependence of the ratio of the resistance of the sensor in the measured mixture and clean air to the amount of impurity of the detected gas. I applied a technical technique - I wrote down the readings of the cursor position on the plate in Excel, pointing it to the necessary points on the graph. The values I need fall between the measured values. I applied the linear approximation method to calculate intermediate values. Thus, I obtained the ratio values for ppm values in the range of 10, 20, 30 ... 100, 200, 300, ... 1000
I recalculated these values of resistance into voltage values and further into ADC readings in the range of 0 - 1023. Having built a graph and an approximating curve, I used this data to derive a formula for converting ADC values to ppm values for CO.
Here is the table:
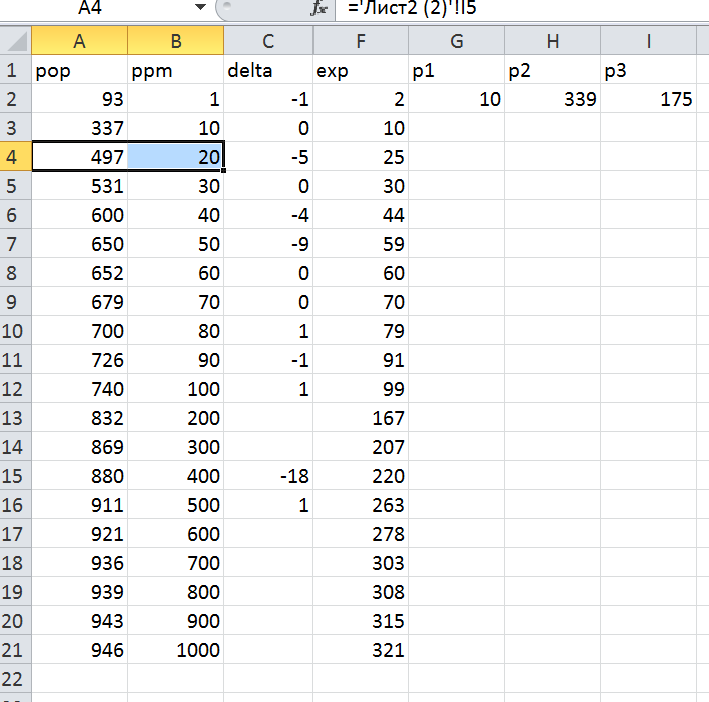
The pop column is the ADC value from the word "parrots". Exp - calculated ppm values according to the formula = ROUND (10 * EXP ((pop-339) / 175); 0)
Formulas should be derived two, one for the range of 0-100 ppm and the second for the range of 100-1000 ppm. I brought the first one and decided everything above 100 ppm (more than 3.6V) to be considered deadly.
In principle, it is possible to calibrate the sensors using standard gas mixtures. Such mixtures can even be bought. A cursory examination of the issue showed that, firstly, the price level for such mixtures is not at all encouraging, secondly, you need to buy a cylinder of at least five liters and at least a minimum set of gas fittings to ensure a constant flow of the mixture. Looking at the prices, I found this idea unreasonable in relation to the budget of the White Cuba.
Sketch can be downloaded here.
The WhiteBox program for receiving data from the PC, logging and graphing data is written in Visual Basic in the environment of Visual Studio Express 2012.
Archive with the project can be downloaded here.
The program has a mechanism for reconnecting in case of a signal failure. If the channel has fallen and there is no data after the specified timeout has expired, the program will close the channel, clean the “tails” and open the channel again. And it will do so until the connection is restored. In the case of the whitebox, the timeout is set to 10 seconds with a normal interval between sending 3 seconds. The program correctly performs and disconnects - switching on the transmitting module, Wi-Fi access point or any connected equipment along the data flow path.
The channel opening and closing events are written to the log. Also marked the event start and stop the program.
Data and events are separately written to two separate text files.
Once the timer is triggered, the program for recording statistics to a log file is executed once a minute.
After launching, the program opens a reception channel from White Cuba and waits for data in the background channel.
Upon the arrival of data from the channel, they are placed in a buffer and, when certain conditions are reached, this buffer is sent to the input data processing program. In this program, the condition is that the last bytes of the string are equal to vbCrLf (i.e., Hex (0D0A), they are also the characters "carriage return", "return string").
The processing routine checks the input string for formal validity using a regular expression mechanism. If the line has an invalid format - this is left a mark in the log file. If the string has a valid format, the program splits the string into elements using a regular expression mechanism, resulting in an array of elements.
Further processing consists in entering the necessary elements into arrays of the “FIFO queue” type (QUEUE).
I chose two types of data display - conditionally Low and Fast. Points on the Fast charts go in 3 seconds, and on the Low in a minute.
The length of the queue for Fast data is chosen to be 1200 elements, which, with a data arrival interval of three seconds, is approximately 1 hour ago.
The queue length for Low data is chosen to be 1440 elements, which, given the one-minute data arrival interval, gives a picture 1 day ago.
In this program, a calculated expression is used to convert CO measurement data from ADC units to values in ppm.
Charts:

The response of the sensors to the use of hairspray. It is seen that all the sensors responded, unfortunately the selectivity of the sensors is small.
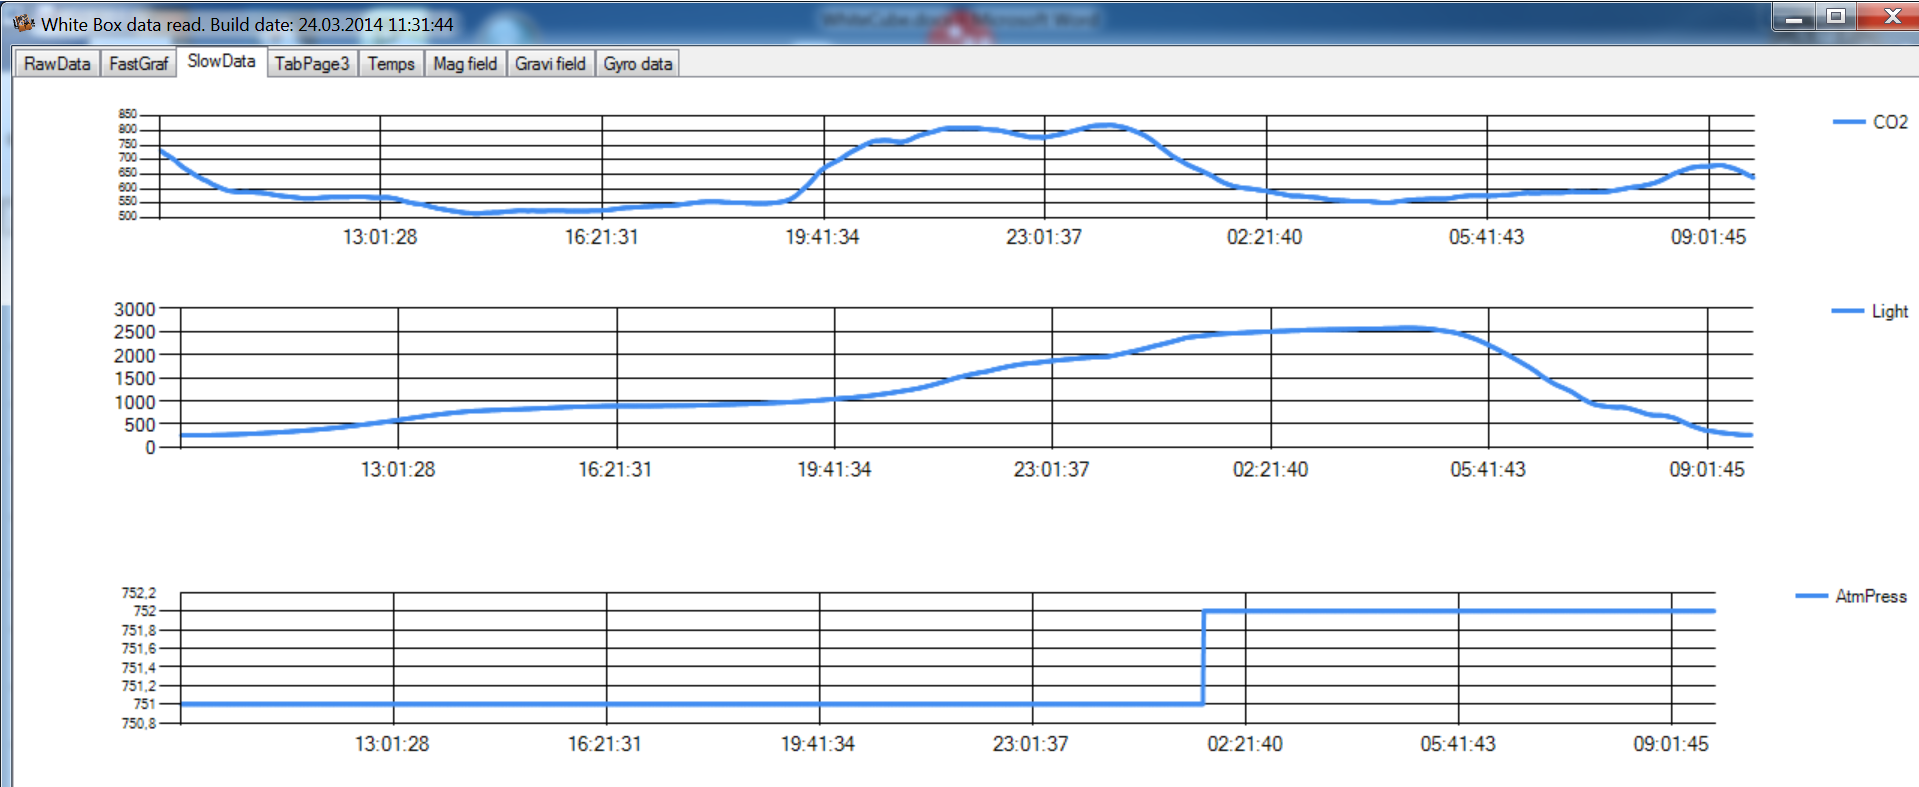
The top chart is the CO2 level in the apartment per day. The highs in the morning and in the evening, each person gives about +200 ppm to the background level of 450 ppm. A very high level of CO2 gives a gas stove. When the gas stove operates, the CO2 level jumps to 2000 - 2500 ppm. These values are already outside of hygienic standards and require active ventilation of the room.
A curious effect is the measurement of CO2 in the student's room. When the child is engaged - the level of CO2 is about 1200 ppm. And when a child plays a walker / shooter - it reaches up to 2000 ppm. The result was an indirect method of measuring diligence in the classroom. The level of CO2 correlates with the activity of the brain and allows us to draw certain conclusions about the student’s diligence :)
Here is a screenshot of another program that communicates with the CO2 sensor connected to the host computer via the USB-Serial converter:
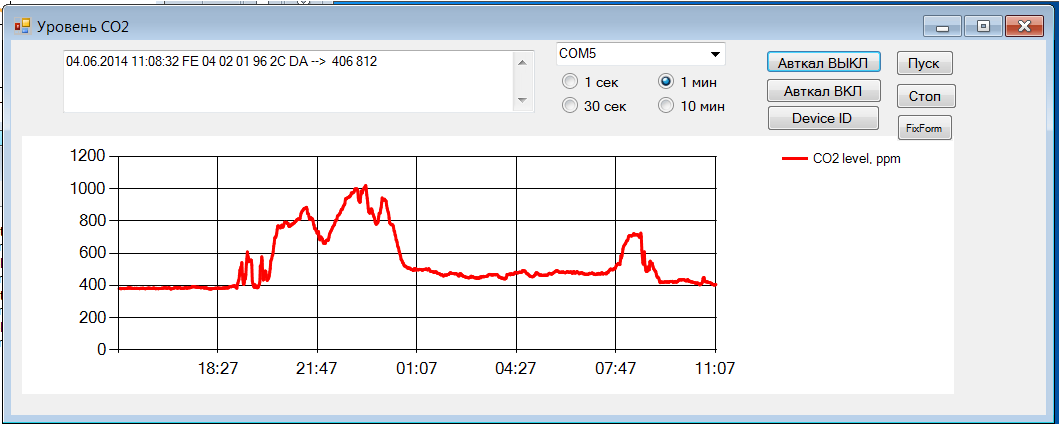
Peak CO2 around 19 o'clock - coming home and entertainment. Morning peak around 8 o'clock. The background value during the day is about 400 ppm, at night 450 ppm.
It is obvious that the level of CO2 directly correlates with the intensity of the brain. It turns out that the level of CO2 can objectively judge the intensity of training. And the opportunity arises to argue on the phrase "I taught!" :)
Another interesting effect (not open to me, used in advanced security systems) - the CO2 level indicates the number of people in the room. Well, or even about the presence of people. When I just launched this system and it was interesting for me to analyze the data, one evening I look at the graph - the CO2 level falls only after one o'clock. And the son says he went to college to the 2nd couple. He does not agree :))) showed the son a chart and the child said sadly: “Well, now you don’t skip, I can’t breathe!”
This is of course a joke and an unexpected secondary effect; the system was not created for child control.
Although the son adapted the system for his needs - I made a conclusion about the level of CO2 on his laptop and added a voice alert about the excess of the level of CO2 in his room.
In the first part , a homemade device for measuring environmental parameters was described. This is the second part of the publication.
White Cuba construction
')
The main module of the BC is mounted on the basis of double-sided foil fiberglass. The base is cut in the shape of the bottom of Cuba. On this plate, slits were made with a stationery knife for mounting connectors for gas sensors, power distribution.
Arduino Nano, Wi-Fi module and a module with pressure sensors, etc., are mounted on vertically mounted slats. The pads are made contact pads by erupting the foil, the connectors are soldered from the sides. Connectors purchased in Brown Bear. The Wi-Fi module has a connector with a pitch of 2 mm, rather than the standard 2.54. The height of the bar is made larger than the height of the modules, the remaining space is used to accommodate discrete elements (the CO sensor heating control transistor, I2C and 1Wire pull-up resistors, etc. The picture also shows a loop of a wire, I used to debug the system for connecting earth pin of the oscilloscope probe and the probe tester.
The slats are installed at the place of soldering to the base. To reliably melt the solder, you need to use a powerful soldering iron, I have a 100 watt thick copper tip made in USSR.
The power supply of the BC is provided from an external power source of 5V to 2 A. I used a source from a faulty DLINK router. BC consumes slightly less than 2 A and the power supply has a current margin. Built-in stabilizer Arduino is not used. When debugging, you can power the BC from the computer, but the analog gas sensors must be removed from the connectors, otherwise the current from the USB is not enough. Simultaneous connection of external power supply and USB is not recommended. My USB port in the Lenovo X200 laptop did not burn, but it did not work either. There are no guarantees that you will not burn, I strongly advise against doing so.
On the case of BC fixed two identical round connectors. One is for power supply, the other is for connecting a loop with 18B20 temperature sensors. Not quite the right decision in terms of fool resistance (you can confuse the connectors), perhaps in the future I will replace the sensor connector with another type.
Holes 8 mm in diameter are drilled for cooling and exchange with the external environment. Since the applied gas sensors require heating of the measuring surface, quite a lot of heat is released inside the White Cuba. At a voltage of 5 volts, the current consumption is about 2 A, which gives about 10 watts of heat. Inside, the White Cube is heated to a temperature of about 40 degrees, according to the temperature sensor readings from BMP085. Such a high internal temperature led to the need to make the humidity sensor and the ambient temperature outside of Cuba, otherwise the readings of the humidity sensor are noticeably distorted.
After a series of experiments in an attempt to make the thermal insulation of the sensor from the body without moving parts, I stopped at a rotary heat insulating bracket. The bracket is made of standard wooden chopsticks :) The SHT10 sensor is fixed on the end.
The sensor has soldering points on both sides, although only one side points are used for the exchange. The points from the second side are used for fastening - a pair of short, unwired wires are soldered to them. This made it possible to securely attach the sensor to the end of the bracket.
A high rectangular hole is made in the side surface of the cube. The bracket with the SHT10 sensor moves into this groove. This is done to protect against damage to the bracket and the sensor when carrying it; otherwise, it is easy to break the protruding 10 cm bracket. For easy removal of the bracket, a petal is made of black insulating tape. The mechanism allows you to remove the sensitive sensor in the case when carrying the Cube and easily get the sensor by turning the bracket when the system is in a stationary position.
The diameter of the holes in Cuba for cooling, their number and location is determined from the engineering-intuitive reflections and memories of the subject "Rags", they are also the "course of the property of electrical radio materials", in which they talked about the design of passive REA cooling systems. The main thing that matters is the diameter of the holes, which should not be small for the air to pass through them.
The Wi-Fi module came from China without an internal antenna, only with an external U-FL type connector. I was forced to buy additional antennas in DESSY.RU for mounting inside the case (ANT 2.4 ESG-2400-12 UFL-F, the price is about 150 r). I would have known in advance - I would have ordered the exact same antennas along with the modules. Unfortunately, on the seller’s website (DX.COM) a photo of the module with an internal antenna and the description both the presence of an internal and external antenna is mentioned. However, I opened the ticket and returned the money for the antennas. As I already mentioned, this module is a truncated version of the router, to which you can connect up to four additional RJ45 connectors. Inside there is a Linux. By default, after switching on the module is configured for the access point mode with the password “12345678” (and not “0000000”, as erroneously stated in its description). To start the module, you need to connect an antenna and power 5 volts to pin 1 and ground to pin 2.
After about a minute, a device of the HI-LINK_A3B8 type will appear in the Wi-Fi environment, where the last characters correspond to the MAC address of the module written on the panel.
Connect, enter the password (12345678), configure the TCP \ IP protocol of the machine in the network 192.168.16.. The default module address is 192.168.16.254, the login password is admin \ admin. I changed the mode of the module to WiFi Client Serial. This is the mode in which the module connects to the home access point and provides a transparent transfer of serial data:
The first serial port is configured for 38400 speed and is set to server mode. The remaining settings are unchanged.
The second serial port is also set to server mode, the rest is unchanged. With test targets, the Tx signal (pin 22) is fed to the Rx input (pin 26).
As a result, when contacting 192.168.1.155:8080, the first serial port is available, at 192.168.1.155:8081 - the second one, and the router itself - at 192.168.1.155:80.
The module also can show the signal level. You can compare the work of two external antennas in the same conditions. According to my data, it turned out that the purchased flat antennas work better than the whip antennas from the old WiFi PCI card.
You can check the operation of the module using the PUTTY program in the telnet connection mode.
The first serial port operates at speeds up to 115200, the second - up to 57600. In the White Cuba, the second serial port is not used.
A few more photos of the internal arrangement of BC:
Recalculation of the readings of analog gas sensors into a digital value in ppm (parts per million, parts per million).
From the medical literature, I extracted the following data:
Acute effects of carbon monoxide poisoning
in relation to the environmental concentration in parts per million (concentration, ppm):
35 ppm (0.0035%) - headache and dizziness within six to eight hours of continuous exposure
100 ppm (0.01%) - a slight headache after two to three hours of exposure
200 ppm (0.02%) - slight headache after two to three hours of exposure, loss of criticism
400 ppm (0.04%) - frontal headache after one to two hours of exposure
800 ppm (0.08%) - dizziness, nausea, and cramps after 45 minutes of exposure; loss of feeling after 2 hours
1600 ppm (0.16%) - headache, tachycardia, dizziness, nausea after 20 minutes of exposure; death in less than 2 hours
3200 ppm (0.32%) - headache, dizziness, nausea after 5-10 minutes of exposure; death in 30 minutes
6400 ppm (0.64%) - headache, dizziness after 1-2 minutes of exposure; convulsions, respiratory arrest and death in 20 minutes
12800 ppm (1.28%) - unconscious after 2-3 breaths, death in less than three minutes
Concentration
0.1 ppm - natural atmosphere level (MOPITT)
0.5 - 5 ppm - the average level in homes
5 - 15 ppm - next to a properly adjusted gas stove in the house
100 - 200 ppm - from car exhaust
5000 ppm - in the smoke from the wood stove
7000 ppm - in warm exhaust gases of cars without a catalyst
From these data it follows that it makes sense to measure the values of the CO level in the range from ppm to 100 ppm, and all values above this level are considered deadly. This is also confirmed by the fact that the first threshold in industrial sensors is set at 20 ppm, the second - 100 ppm.
The manufacturer of the MQ7 sensor provides in its manual all the necessary data for creating an algorithm for converting the readings of an analog voltmeter into ppm numbers. A careful examination of this document provides the following background data:
The resistance of the sensor in clean air can be in the range of 2–20 kΩ.
The load resistance is recommended in the region of 10 k. Examination of the details on the sensor printed circuit board showed that a 1 kΩ resistor is installed in the finished module. As will be shown later, such a load resistor gives the output voltage of the sensor in the range from about 400 mV in clean air to 5 volts with a CO value of about 1000 ppm. This range covers an order of magnitude CO measurement. A hazardous CO value of 100 ppm gives approximately 3.6 volts at the sensor output.
Graph of the ratio of the sensor resistance to the level of gas in the mixture:
Fat black lines are added by me to check the formal correctness of the data. I checked whether three lines converge at point 0 — the vertical axis y, the horizontal straight line of the sensor resistance in clean air, and the line of sensor resistance versus the impurity level of the detected gas in the mixture. As you can see - there is a practical hit in one point, taking into account the errors.
Using this graph, you can make a table of the dependence of the ratio of the resistance of the sensor in the measured mixture and clean air to the amount of impurity of the detected gas. I applied a technical technique - I wrote down the readings of the cursor position on the plate in Excel, pointing it to the necessary points on the graph. The values I need fall between the measured values. I applied the linear approximation method to calculate intermediate values. Thus, I obtained the ratio values for ppm values in the range of 10, 20, 30 ... 100, 200, 300, ... 1000
I recalculated these values of resistance into voltage values and further into ADC readings in the range of 0 - 1023. Having built a graph and an approximating curve, I used this data to derive a formula for converting ADC values to ppm values for CO.
Here is the table:
The pop column is the ADC value from the word "parrots". Exp - calculated ppm values according to the formula = ROUND (10 * EXP ((pop-339) / 175); 0)
Formulas should be derived two, one for the range of 0-100 ppm and the second for the range of 100-1000 ppm. I brought the first one and decided everything above 100 ppm (more than 3.6V) to be considered deadly.
In principle, it is possible to calibrate the sensors using standard gas mixtures. Such mixtures can even be bought. A cursory examination of the issue showed that, firstly, the price level for such mixtures is not at all encouraging, secondly, you need to buy a cylinder of at least five liters and at least a minimum set of gas fittings to ensure a constant flow of the mixture. Looking at the prices, I found this idea unreasonable in relation to the budget of the White Cuba.
Sketch can be downloaded here.
The WhiteBox program for receiving data from the PC, logging and graphing data is written in Visual Basic in the environment of Visual Studio Express 2012.
Archive with the project can be downloaded here.
The program has a mechanism for reconnecting in case of a signal failure. If the channel has fallen and there is no data after the specified timeout has expired, the program will close the channel, clean the “tails” and open the channel again. And it will do so until the connection is restored. In the case of the whitebox, the timeout is set to 10 seconds with a normal interval between sending 3 seconds. The program correctly performs and disconnects - switching on the transmitting module, Wi-Fi access point or any connected equipment along the data flow path.
The channel opening and closing events are written to the log. Also marked the event start and stop the program.
Data and events are separately written to two separate text files.
Once the timer is triggered, the program for recording statistics to a log file is executed once a minute.
After launching, the program opens a reception channel from White Cuba and waits for data in the background channel.
Upon the arrival of data from the channel, they are placed in a buffer and, when certain conditions are reached, this buffer is sent to the input data processing program. In this program, the condition is that the last bytes of the string are equal to vbCrLf (i.e., Hex (0D0A), they are also the characters "carriage return", "return string").
The processing routine checks the input string for formal validity using a regular expression mechanism. If the line has an invalid format - this is left a mark in the log file. If the string has a valid format, the program splits the string into elements using a regular expression mechanism, resulting in an array of elements.
Further processing consists in entering the necessary elements into arrays of the “FIFO queue” type (QUEUE).
I chose two types of data display - conditionally Low and Fast. Points on the Fast charts go in 3 seconds, and on the Low in a minute.
The length of the queue for Fast data is chosen to be 1200 elements, which, with a data arrival interval of three seconds, is approximately 1 hour ago.
The queue length for Low data is chosen to be 1440 elements, which, given the one-minute data arrival interval, gives a picture 1 day ago.
In this program, a calculated expression is used to convert CO measurement data from ADC units to values in ppm.
Charts:
The response of the sensors to the use of hairspray. It is seen that all the sensors responded, unfortunately the selectivity of the sensors is small.
The top chart is the CO2 level in the apartment per day. The highs in the morning and in the evening, each person gives about +200 ppm to the background level of 450 ppm. A very high level of CO2 gives a gas stove. When the gas stove operates, the CO2 level jumps to 2000 - 2500 ppm. These values are already outside of hygienic standards and require active ventilation of the room.
A curious effect is the measurement of CO2 in the student's room. When the child is engaged - the level of CO2 is about 1200 ppm. And when a child plays a walker / shooter - it reaches up to 2000 ppm. The result was an indirect method of measuring diligence in the classroom. The level of CO2 correlates with the activity of the brain and allows us to draw certain conclusions about the student’s diligence :)
Here is a screenshot of another program that communicates with the CO2 sensor connected to the host computer via the USB-Serial converter:
Peak CO2 around 19 o'clock - coming home and entertainment. Morning peak around 8 o'clock. The background value during the day is about 400 ppm, at night 450 ppm.
It is obvious that the level of CO2 directly correlates with the intensity of the brain. It turns out that the level of CO2 can objectively judge the intensity of training. And the opportunity arises to argue on the phrase "I taught!" :)
Another interesting effect (not open to me, used in advanced security systems) - the CO2 level indicates the number of people in the room. Well, or even about the presence of people. When I just launched this system and it was interesting for me to analyze the data, one evening I look at the graph - the CO2 level falls only after one o'clock. And the son says he went to college to the 2nd couple. He does not agree :))) showed the son a chart and the child said sadly: “Well, now you don’t skip, I can’t breathe!”
This is of course a joke and an unexpected secondary effect; the system was not created for child control.
Although the son adapted the system for his needs - I made a conclusion about the level of CO2 on his laptop and added a voice alert about the excess of the level of CO2 in his room.
Source: https://habr.com/ru/post/243691/
All Articles