ObjectManager in the Yandex.Maps API. How to quickly draw 10,000 marks on the map and not slow down everything around
Developers who use the Yandex.Maps API often have the task of displaying many objects on the map. Indeed, there are a lot - about 10,000. And this task is relevant for us too - try to look for pharmacies on Yandex. At first glance it seems: “What is the actual problem? Take it and show it. ” But until you start doing this, you will not understand that the problems are in fact a whole car.
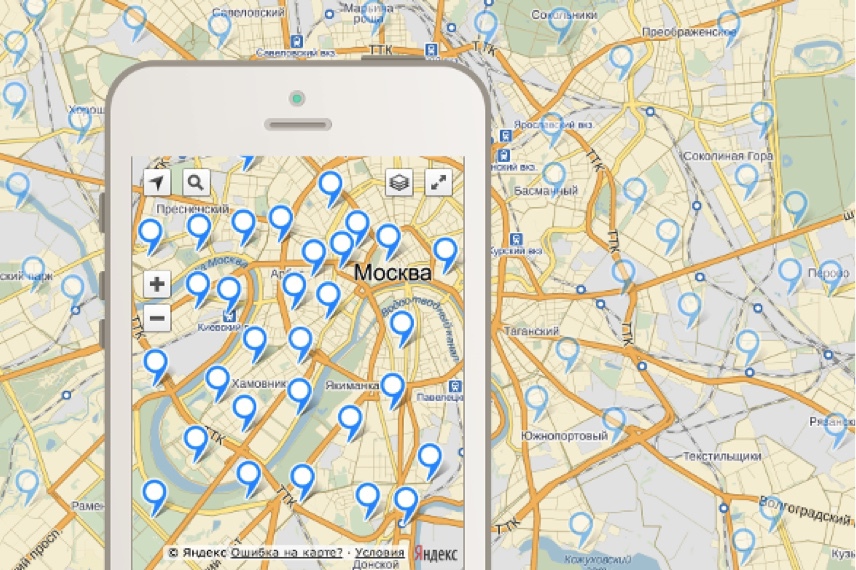
Questions on a large number of tags with enviable regularity come to our club and technical support. Who are all these people? Who might be interested to show more than 10 tags on the map? In this post I will examine in detail the entire car of problems and tell you how tools appeared in the API that help developers optimally show a large number of objects on the map.
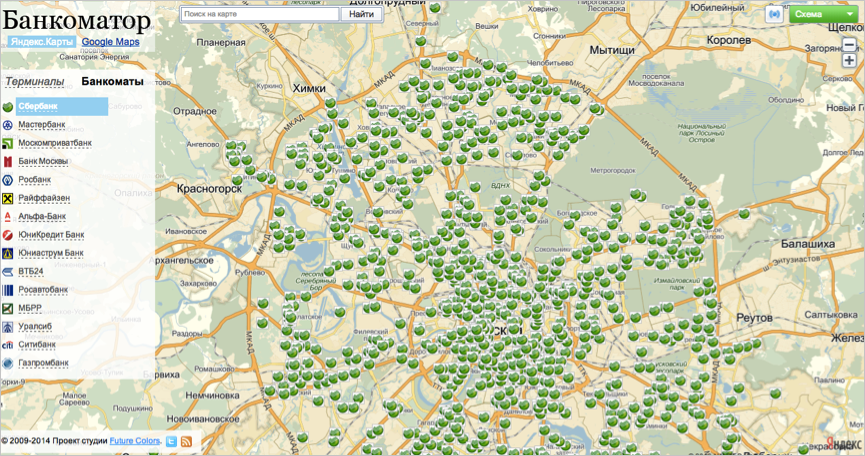
Basically, the problem faced by information services that want to bind the data to the map. For example, the site bankomator.ru tells users where to find the ATM of the desired bank.
')
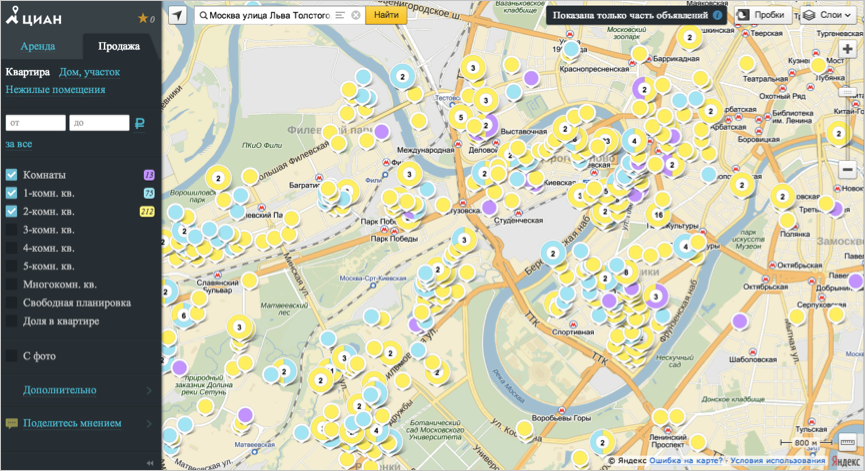
Real estate resources also suffer from a large amount of data. A striking example is Cian.ru.
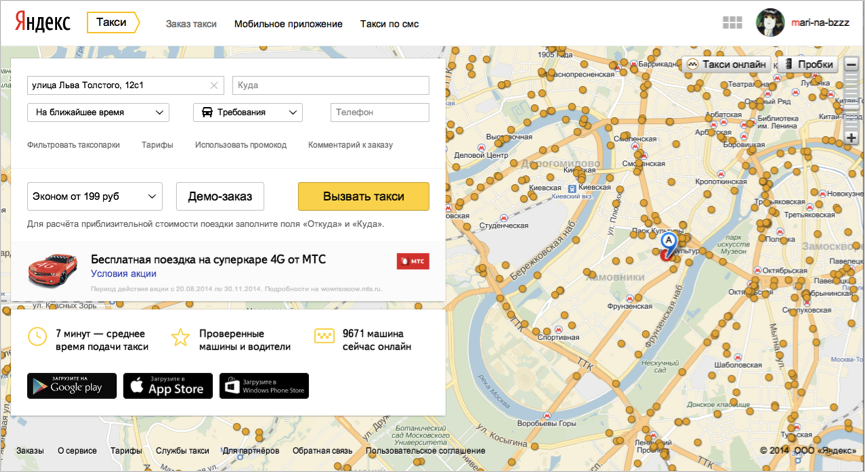
Until recently, we ourselves inside Yandex advised adjacent teams various “hacks” and techniques for displaying a multitude of points through the API. Vivid examples are Yandex.Real estate and Yandex.Taxi.
In order to feel the full brunt of the task, you need to try to solve it. First, let's understand how to show the map on the page of your service. Consider a simple scheme:

A client (for example, Safari on iPhone) requests the index.html page from the server. A page is a document with this code:
Now we complicate the task. We have a database that stores the addresses of Zenit fans. And we want to show on the map the addresses of these fans.
Solving the problem "in the forehead":
If you are a project manager, and your developer demonstrates such a solution, you will most likely turn gray. You tell him your value judgment. If you remove obscene language, you can select the following theses:
Thought gets two directions:
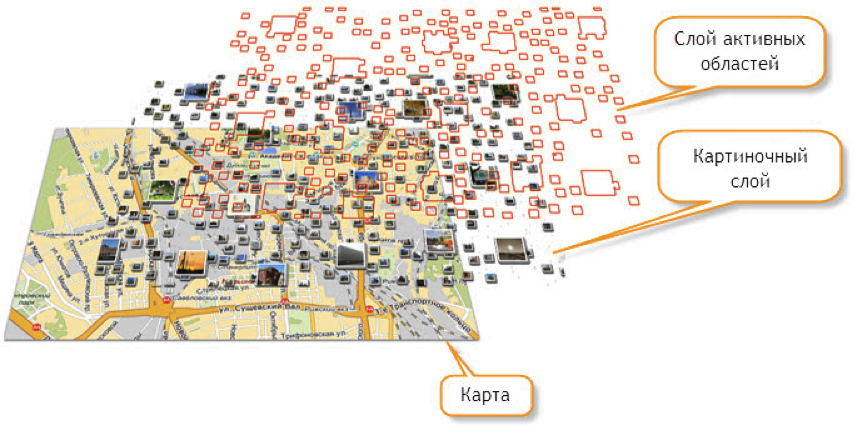
A hundred years ago, a tool for solving these tasks was made in the Yandex.Maps API - technology of active areas. Who cares in detail, read the developer's guide .
In short, you generate transparent images on the server with tags, plus a text description of the tags. The client can monitor the visible area of the map and request data that is needed for the current visible area of the map.
With the help of hotspots, for example, traffic jams are drawn on maps.yandex.ru. On the same technology made site bankomator.ru.
This technology has several significant drawbacks.
1. Very difficult server part. Try at your leisure to write a module that generates such images and their geometric descriptions, and you will understand everything.
2. Absolute inflexibility. It is impossible to "lift" the label when you hover over it. It is not possible to quickly change the appearance of tags on the client. In short - for any sneeze you need to ask the server to regenerate the image.
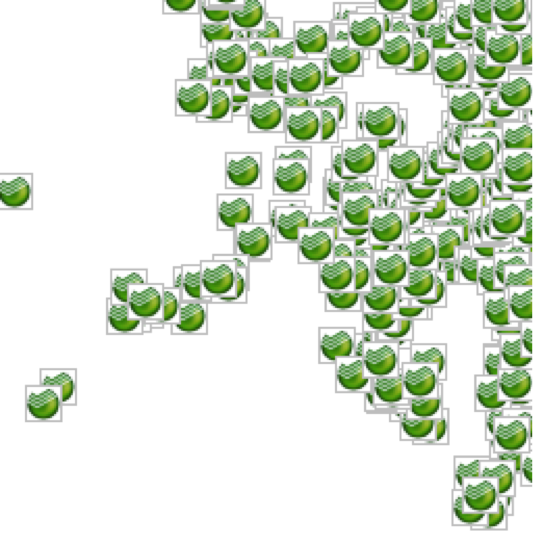
Therefore, users were spinning as they could, without hotspots — they transferred sets of single objects to the client in batches, through a timeout. At the same time on the client they were waiting for problems again. If you transferred 1000 points to a client, how do you draw them?
From each point it was necessary to generate the object

Summing up all these cases, we decided to write a module that would allow:
And we did it.We seals.
To learn how to draw labels quickly, it was necessary to understand what problems lie in the current, already existing solution. Let's see what the
In addition, the label dynamically reacts to any change in the external environment - changing options, data, map projections, changing the scale of the map, changing the center of the map, and much, much more. Such here we have powerful placemarks.

Do you need all this software power for the case when the developer just needs to show a lot of similar labels on the map? Correct, not needed.
Therefore, the first insight was as follows: let's move out all the auxiliary modules of tags into one common component and for each individual object we will create only a program entity that is directly responsible for drawing.

The second insight came when we thought about the problem of unnecessary software initialization. We recall the story above, somewhere in the area of such a picture.
We wanted to get rid of unnecessary software initialization, and we came up with a brilliant. Sit back, now there will be a revelation: if unnecessary program initializations prevent you, do not do them.
We decided that we would store user data about objects (in fact in JSON), and program entities for objects will be created only when an object needs to be drawn on the map.
After a combination of these ideas and some development, a new API module was born to display a large number of point objects - ymaps.ObjectManager .
A JSON description of the objects is fed to the input of this manager.
The manager analyzes which labels fall into the visible area of the map and either draws labels or clusters these labels and shows the result on the map.
For drawing labels and clusters on the map, we took only part of the
These techniques allowed us to make good progress in the matter of drawing a large number of labels on the client. Here are the speed gains we received:
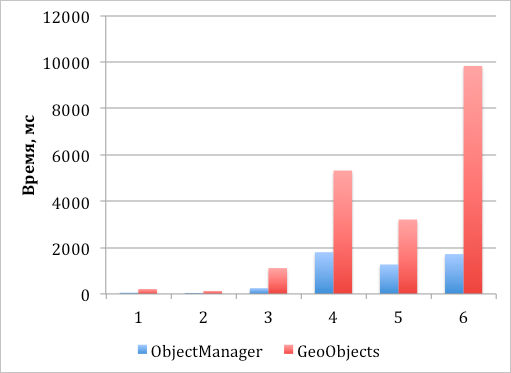
Chart 1. The speed of creating and adding objects to the map, followed by asynchronous drawing of their visible part

Chart 2. The speed of creating and adding objects to the map, followed by synchronous drawing of their visible part
Important note. All these statistics are valid for modern browsers. IE8 is not one of these browsers. Therefore, for him the numbers will be much worse, but I think for most it does not matter.
We managed to speed up the creation and rendering of objects directly, in addition to this, we optimized the initialization of program entities as much as possible. Now you can, for example, otklasterizovat 50 000 points on the client, and it will be comfortable to work with the card.
You can read more about the module in our developer’s guide , and see the live examples of how the module works in the sandbox .
So, we learned to quickly draw and cluster points on the client. What's next?
Remember an example about Zenit fans? We solved the problem of drawing data on the client, but did not solve the problem associated with the optimal loading of this data. We began to collect typical tasks for users of the API. According to the results of the research, we received two model cases:
To solve these cases, the LoadingObjectManager and RemoteObjectManager modules, respectively, were written. Both modules are essentially based on the ObjectManager implementation, but have a number of differences in the loading and caching algorithm of the loaded data.
As a result, as the user works with the card, he will receive data from your database. At some point, all or the necessary part of the data will be loaded and requests to the server will generally cease to be sent.
The data is stored on the client in the pr-tree, so even for a large amount of data, samples are made quite quickly.
Now let's discuss option number two — displaying server clustering results on the client. Suppose you have written server clustering labels. You also wrote a script that, upon request from a client, can give clusters and single tags that are not included in the cluster.
You just have to create an instance of RemoteObjectManager and set the path to this wonderful script in it. RemoteObjectManager will work in much the same way as LoadingObjectManager . The difference will only be that we will re-request data from the server every time the zoom is changed.
Since the data is clustered on the server, the server and only the server can know what data is needed and which one does not need to be shown at the moment on the map. Therefore, information about objects is stored on the client only until the first change of the zoom, and then everything is requested again.
If the description of the cluster label is transmitted from the server, then on the client these labels will pick up the entire infrastructure from the API - special icons will be drawn for the clusters, all standard behaviors will work for them, and so on and so forth.
In this section, we want to list the concepts of data storage and processing on the server, which we assumed when designing the client part. Let's go from simple to complex.
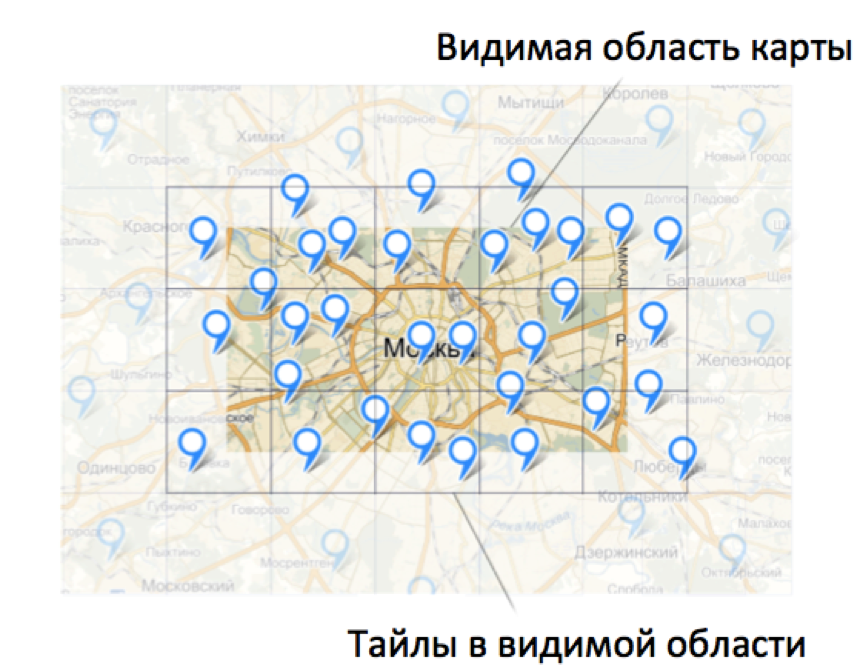
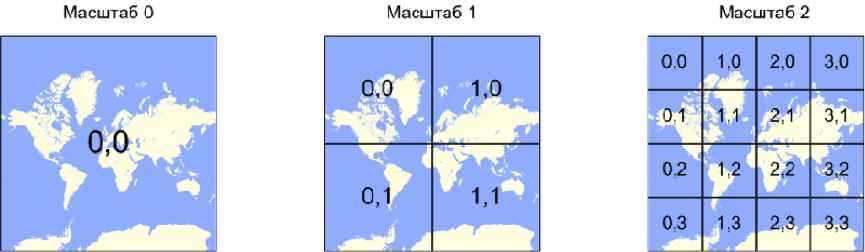
The client code operates on data exclusively by the secret. A tile is some numbered area on a map. More information about the numbering of tiles can be found in our documentation.
When a certain area of the map is shown on the page, the client module calculates which tiles fall into this visible area, checks for the availability of the required data and sends requests for data as needed.
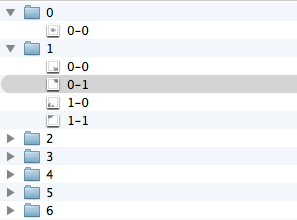
The client module has settings that make it necessary to send requests for each new tile separately. How is this valuable? Yes, the fact that we get a finite number of client request options to the server.
zoom = 0, tile = [0, 0]
zoom = 1, tile = [0, 0]
zoom = 1, tile = [0, 1]
zoom = 1, tile = [1, 0]
zoom = 1, tile = [1, 1]
zoom = 2, tile = [0, 0]
...
Since requests are known in advance, responses to requests can also be generated in advance. We organize some kind of file structure on the server.
The files will contain the following code:
When loading such a file on the client, JSONP-callback will be called, written in the file. The data will fall into the bowels of LoadingObjectManager, cached and drawn in the desired form.
As a result, just static files with data sets can be stored on the server, and the client part itself decides what to ask and when to show it.
A significant disadvantage of the above solution is a large number of requests for data from the client to the server. It is much more expedient to send a request for several tiles at once than to request data for each tile separately. But in order to process requests for groups of tiles, you will have to write some server code.
In this case, the data can continue to be stored in separate files. When the client receives a request for data in a certain rectangular area, it will suffice to glue the contents of several files into one answer and send it back to the client.
The most correct, in our opinion, way is to implement the server part using any database that can index geolocated data. For any database that does not support spatial indexes, you can create a similar index yourself using the concept of spatial keys .
In general, storing georeferenced data on a server and clustering them is a topic for a separate conversation. So we will discuss another time.
In this repository lives an example of the implementation of the server-side with server-based clustering, written in node.js + mongo.db. can someone come in handy ( Demo ).
Comparative table of new modules.
At the moment we support the work only with point objects. Support for polygons, polylines and other beautiful shapes is in our plans and will appear in future releases.
When should you think about using these modules? Almost in any situation when you need to draw a lot of point objects on the map.
Useful links:
Questions on a large number of tags with enviable regularity come to our club and technical support. Who are all these people? Who might be interested to show more than 10 tags on the map? In this post I will examine in detail the entire car of problems and tell you how tools appeared in the API that help developers optimally show a large number of objects on the map.
Basically, the problem faced by information services that want to bind the data to the map. For example, the site bankomator.ru tells users where to find the ATM of the desired bank.
')
Real estate resources also suffer from a large amount of data. A striking example is Cian.ru.
Until recently, we ourselves inside Yandex advised adjacent teams various “hacks” and techniques for displaying a multitude of points through the API. Vivid examples are Yandex.Real estate and Yandex.Taxi.
Item 1. What is the problem?
In order to feel the full brunt of the task, you need to try to solve it. First, let's understand how to show the map on the page of your service. Consider a simple scheme:
A client (for example, Safari on iPhone) requests the index.html page from the server. A page is a document with this code:
<head> <meta http-equiv="Content-Type" content="text/html; charset=utf-8" /> <script src="//api-maps.yandex.ru/2.1/?lang=ru_RU" type="text/javascript"></script> <script type="text/javascript"> ymaps.ready(init); function init () { var myMap = new ymaps.Map('map', { center: [55.76, 37.64], zoom: 10 }); } </script> </head> <body> <div id="map"></div> </body> Now we complicate the task. We have a database that stores the addresses of Zenit fans. And we want to show on the map the addresses of these fans.
Solving the problem "in the forehead":
- We make a sample from the database, we get 1 billion addresses.
- We add in the file index.html an array containing all one billion addresses.
- We transfer this file to the client.
- On the client, we loop through the array data and draw a label on the map for each element.
If you are a project manager, and your developer demonstrates such a solution, you will most likely turn gray. You tell him your value judgment. If you remove obscene language, you can select the following theses:
- The weight of the index.html file will increase to several MB and the page will open in seconds for a user.
- Why transfer an entire database to a client if you only need to show tags for Moscow?
- Why draw ALL tags on a map if a person sees only a tenth of them?
- If the map draw about 100-200 labels in the usual way, the map will slow down.
- Can I load tags gradually, in batches, so that the channel does not clog and the browser has time to draw these tags?
Thought gets two directions:
- You need to be able to determine what data the user sees and only request what they need.
- When this necessary came, it must be optimally drawn.
A hundred years ago, a tool for solving these tasks was made in the Yandex.Maps API - technology of active areas. Who cares in detail, read the developer's guide .
In short, you generate transparent images on the server with tags, plus a text description of the tags. The client can monitor the visible area of the map and request data that is needed for the current visible area of the map.
With the help of hotspots, for example, traffic jams are drawn on maps.yandex.ru. On the same technology made site bankomator.ru.
This technology has several significant drawbacks.
1. Very difficult server part. Try at your leisure to write a module that generates such images and their geometric descriptions, and you will understand everything.
2. Absolute inflexibility. It is impossible to "lift" the label when you hover over it. It is not possible to quickly change the appearance of tags on the client. In short - for any sneeze you need to ask the server to regenerate the image.
Therefore, users were spinning as they could, without hotspots — they transferred sets of single objects to the client in batches, through a timeout. At the same time on the client they were waiting for problems again. If you transferred 1000 points to a client, how do you draw them?
From each point it was necessary to generate the object
ymaps.Placemark and add it to the map. You could add labels to the clusteriser ( ymaps.Clusterer ) and add unclustered labels to the map. Here you need to note that when clustering 10,000 points, you must first instantiate these 10,000 points, and then transfer them to the clustering unit. That is, the label may not appear on the map, since it will be included in the cluster, but we will still spend time on its initialization.Summing up all these cases, we decided to write a module that would allow:
- Quickly and easily draw a large number of points on the client.
- Avoid unnecessary initialization when working with points on the client.
- Download data to the client strictly on demand.
And we did it.
Point 2. Draw tags quickly.
To learn how to draw labels quickly, it was necessary to understand what problems lie in the current, already existing solution. Let's see what the
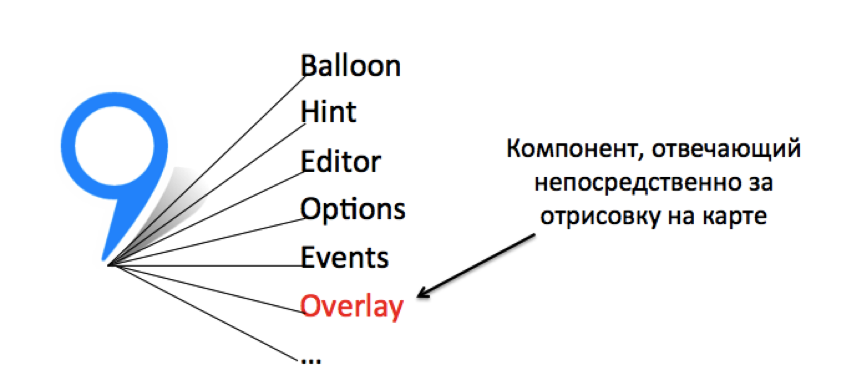
ymaps.Placemark object can do:- He knows how to draw on the map.
- He has his own balloon manager,
placemark.balloon. - He has his hint manager
placemark.hint. - He has an editor that allows you to drag a tag and fix its coordinates
placemark.editor.
In addition, the label dynamically reacts to any change in the external environment - changing options, data, map projections, changing the scale of the map, changing the center of the map, and much, much more. Such here we have powerful placemarks.
Do you need all this software power for the case when the developer just needs to show a lot of similar labels on the map? Correct, not needed.
Therefore, the first insight was as follows: let's move out all the auxiliary modules of tags into one common component and for each individual object we will create only a program entity that is directly responsible for drawing.
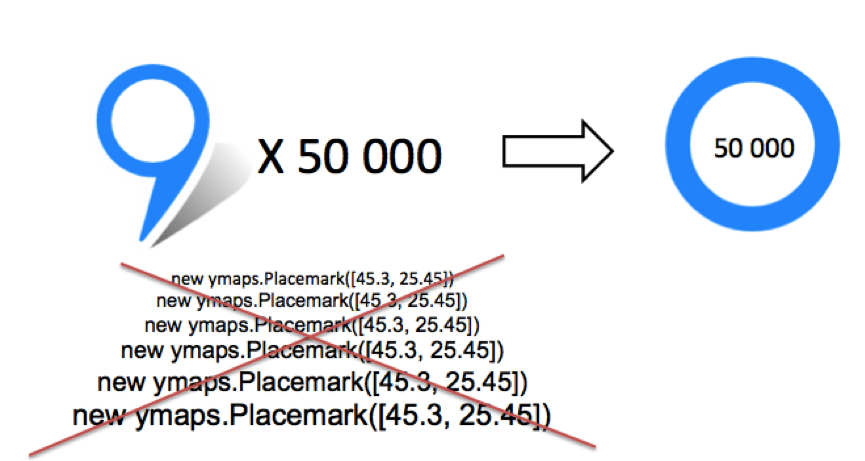
The second insight came when we thought about the problem of unnecessary software initialization. We recall the story above, somewhere in the area of such a picture.
We wanted to get rid of unnecessary software initialization, and we came up with a brilliant. Sit back, now there will be a revelation: if unnecessary program initializations prevent you, do not do them.
We decided that we would store user data about objects (in fact in JSON), and program entities for objects will be created only when an object needs to be drawn on the map.
After a combination of these ideas and some development, a new API module was born to display a large number of point objects - ymaps.ObjectManager .
A JSON description of the objects is fed to the input of this manager.
The manager analyzes which labels fall into the visible area of the map and either draws labels or clusters these labels and shows the result on the map.
For drawing labels and clusters on the map, we took only part of the
ymaps.Placemark object (namely, ymaps.overlay. *), Which was responsible only for displaying the label on the map. We carried the entire infrastructure like baluns and hints into a single common component.These techniques allowed us to make good progress in the matter of drawing a large number of labels on the client. Here are the speed gains we received:
Chart 1. The speed of creating and adding objects to the map, followed by asynchronous drawing of their visible part
- Create 1000 tags and add them to the map, all tags are visible.
- Creating 1000 tags and adding them to the map with clustering, all tags are visible.
- Create 10,000 labels and add them to the map with clustering, all labels are visible.
- Creating 50,000 tags and adding them to the map with clustering, all tags are visible.
- Creating 50,000 labels and adding them to the map with clustering, 500 objects are visible.
- Creating 50,000 tags and adding them to the map without clustering, 10,000 are visible.
Chart 2. The speed of creating and adding objects to the map, followed by synchronous drawing of their visible part
- Create 1000 tags and add them to the map, all tags are visible.
- Creating 1000 tags and adding them to the map with clustering, all tags are visible.
- Create 10,000 labels and add them to the map with clustering, all labels are visible.
- Creating 50,000 tags and adding them to the map with clustering, all tags are visible.
- Creating 50,000 labels and adding them to the map with clustering, 500 objects are visible.
- Creating 10,000 tags and adding them to the map without clustering, 2000 are visible.
- Creating 5000 tags and adding them to the map without clustering, 1000 are visible.
Important note. All these statistics are valid for modern browsers. IE8 is not one of these browsers. Therefore, for him the numbers will be much worse, but I think for most it does not matter.
We managed to speed up the creation and rendering of objects directly, in addition to this, we optimized the initialization of program entities as much as possible. Now you can, for example, otklasterizovat 50 000 points on the client, and it will be comfortable to work with the card.
You can read more about the module in our developer’s guide , and see the live examples of how the module works in the sandbox .
So, we learned to quickly draw and cluster points on the client. What's next?
Point 3. Optimally load the data.
Remember an example about Zenit fans? We solved the problem of drawing data on the client, but did not solve the problem associated with the optimal loading of this data. We began to collect typical tasks for users of the API. According to the results of the research, we received two model cases:
- A person on the server has a lot of data, he wants to show it on the client, but load the data as needed.
- The developer prepares data on the server (for example, implements server clustering) and wants to show the results of this processing on the client.
To solve these cases, the LoadingObjectManager and RemoteObjectManager modules, respectively, were written. Both modules are essentially based on the ObjectManager implementation, but have a number of differences in the loading and caching algorithm of the loaded data.
As a result, as the user works with the card, he will receive data from your database. At some point, all or the necessary part of the data will be loaded and requests to the server will generally cease to be sent.
The data is stored on the client in the pr-tree, so even for a large amount of data, samples are made quite quickly.
Now let's discuss option number two — displaying server clustering results on the client. Suppose you have written server clustering labels. You also wrote a script that, upon request from a client, can give clusters and single tags that are not included in the cluster.
You just have to create an instance of RemoteObjectManager and set the path to this wonderful script in it. RemoteObjectManager will work in much the same way as LoadingObjectManager . The difference will only be that we will re-request data from the server every time the zoom is changed.
Since the data is clustered on the server, the server and only the server can know what data is needed and which one does not need to be shown at the moment on the map. Therefore, information about objects is stored on the client only until the first change of the zoom, and then everything is requested again.
If the description of the cluster label is transmitted from the server, then on the client these labels will pick up the entire infrastructure from the API - special icons will be drawn for the clusters, all standard behaviors will work for them, and so on and so forth.
Item 4. Reflections on server implementation
In this section, we want to list the concepts of data storage and processing on the server, which we assumed when designing the client part. Let's go from simple to complex.
1. Storing information about objects on the server in static files
The client code operates on data exclusively by the secret. A tile is some numbered area on a map. More information about the numbering of tiles can be found in our documentation.
When a certain area of the map is shown on the page, the client module calculates which tiles fall into this visible area, checks for the availability of the required data and sends requests for data as needed.
The client module has settings that make it necessary to send requests for each new tile separately. How is this valuable? Yes, the fact that we get a finite number of client request options to the server.
zoom = 0, tile = [0, 0]
zoom = 1, tile = [0, 0]
zoom = 1, tile = [0, 1]
zoom = 1, tile = [1, 0]
zoom = 1, tile = [1, 1]
zoom = 2, tile = [0, 0]
...
Since requests are known in advance, responses to requests can also be generated in advance. We organize some kind of file structure on the server.
The files will contain the following code:
myCallback_x_1_y_2_z_5({ "type": "FeatureCollection", "features": [ { "type": "Feature", "id": 0, "geometry": { "type": "Point", "coordinates": [55.831903, 37.411961] }, "properties": { "balloonContent": " ", "clusterCaption": " 1", "hintContent": " " } }, ... ] } When loading such a file on the client, JSONP-callback will be called, written in the file. The data will fall into the bowels of LoadingObjectManager, cached and drawn in the desired form.
As a result, just static files with data sets can be stored on the server, and the client part itself decides what to ask and when to show it.
2. Dynamic formation of a response from static files
A significant disadvantage of the above solution is a large number of requests for data from the client to the server. It is much more expedient to send a request for several tiles at once than to request data for each tile separately. But in order to process requests for groups of tiles, you will have to write some server code.
In this case, the data can continue to be stored in separate files. When the client receives a request for data in a certain rectangular area, it will suffice to glue the contents of several files into one answer and send it back to the client.
3. Dynamic response generation using a database
The most correct, in our opinion, way is to implement the server part using any database that can index geolocated data. For any database that does not support spatial indexes, you can create a similar index yourself using the concept of spatial keys .
In general, storing georeferenced data on a server and clustering them is a topic for a separate conversation. So we will discuss another time.
In this repository lives an example of the implementation of the server-side with server-based clustering, written in node.js + mongo.db. can someone come in handy ( Demo ).
Conclusion
Comparative table of new modules.
| Module | Benefits | disadvantages |
|---|---|---|
| Objectmanager | Allows clustering of objects on the client. Rendering is performed only for those objects that fall into the visible area of the map. Allows you to filter objects when they are displayed. There is no need to implement the server part, since all data processing is done on the client side. | Supports work only with tags. Data is loaded for all objects at once (even for those that do not fall into the visible area of the map). Object clustering is performed on the client side. |
| LoadingObjectManager | Allows clustering of objects on the client. Loads data only for the visible area of the map. Saves the downloaded data. For each object, the data is loaded only once. Allows you to filter objects when they are displayed. | Supports work only with tags. Object clustering is performed on the client side. It is necessary to implement the server part. |
| RemoteObjectManager | Uses server data clustering. Object data is stored on the server. Each time the data is loaded only for those objects that fall into the visible area of the map. | Supports work only with tags. When the zoom factor is changed, the data is reloaded (even for those objects for which data has already been loaded). You must implement your own clustering. It is necessary to implement the server part. |
At the moment we support the work only with point objects. Support for polygons, polylines and other beautiful shapes is in our plans and will appear in future releases.
When should you think about using these modules? Almost in any situation when you need to draw a lot of point objects on the map.
Useful links:
- Detailed developer's guide with images - tech.yandex.ru/maps/doc/jsapi/2.1/dg/concepts/many-objects-docpage .
- Sandbox examples - tech.yandex.ru/maps/jsbox/2.1/object_manager
- The github project with an example of the implementation of the server part for RemoteObjectManager - github.com/dimik/geohosting-server .
- Yandex.Maps API Developer Club where you need to come with questions - clubs.ya.ru/mapsapi .
Source: https://habr.com/ru/post/243665/
All Articles