Tester's verdict or system quantification by test results
In this article, I would like to share a great method for quantifying test results. Quantitatively, this means that the result of testing is a number that reflects the average indicator of compliance of a system with a set of requirements (or functionalities).
I got the idea to start searching for something similar - to reduce the description of the test result to the very minimum. That is, in the testing report, in the section on the results, I usually indicate a certain conclusion about how the system or functionality meets the requirements. But the analysis of the result itself and its description often takes a sufficient amount of time, both from me to compile it, and to read and assimilate from the interested persons (manager, team, management, etc.).
Then one day I came across a similar report, which I reconfigured “for myself” and successfully use, and about which I would like to share.
All that is needed is MS Excel and a pre-made checklist, and a plan or set of cases.
Next to each scenario, we put down the scores based on the results of the passage, according to the principle:
1 point - the script is passed without comments
0 points - the script is passed, but there are non-critical comments
-1 - the script is considered not passed
After making such estimates, you will need to calculate the average value from our range of cells (or scenarios).
')
So we end up with a number that reflects the average system’s compliance with the set of requirements, and if multiplied by 100, the number becomes a percentage indicator.
For clarity and clarity, it is correct to enter some more description of the obtained value, which can also be specified in the form of a formula in a cell. For each company, the interpretation of the indicator may be different, so everything depends on the level of requirements. For example:
> = 0.90 - Good
> = 0.60 - Acceptable
<0.60 - Poor
or by the formula: = IF (<cell number where the result is counted >> = 0.9; “Good!”; IF (<cell number where the result is counted >> = 0.6; “Acceptable!”; “Everything is bad! "))
And here is a small example of how it all looks to clearly understand what it is about:
In general, for convenience, the test results themselves are formatted as follows:
1. In the * .xlsx document I make out the scripts and the document template.
2. I spend testing with all marks in the document
3. I create a page in Confluence , where I indicate only the most important information and result. I attach a document with detailed results.
4. I send by letter the results with reference to the page.
Thus, it is not interesting for anyone to know which scenarios are passed, and which are not - just sees the number, the description and everything. And who already wants to delve into the details - downloads the document and reads it in detail.
Also, this method is still remarkable in that it can be implemented as soon as you like with the most minimal set of tools and time costs!
Thanks for attention!
I got the idea to start searching for something similar - to reduce the description of the test result to the very minimum. That is, in the testing report, in the section on the results, I usually indicate a certain conclusion about how the system or functionality meets the requirements. But the analysis of the result itself and its description often takes a sufficient amount of time, both from me to compile it, and to read and assimilate from the interested persons (manager, team, management, etc.).
Then one day I came across a similar report, which I reconfigured “for myself” and successfully use, and about which I would like to share.
All that is needed is MS Excel and a pre-made checklist, and a plan or set of cases.
Next to each scenario, we put down the scores based on the results of the passage, according to the principle:
1 point - the script is passed without comments
0 points - the script is passed, but there are non-critical comments
-1 - the script is considered not passed
After making such estimates, you will need to calculate the average value from our range of cells (or scenarios).
')
So we end up with a number that reflects the average system’s compliance with the set of requirements, and if multiplied by 100, the number becomes a percentage indicator.
For clarity and clarity, it is correct to enter some more description of the obtained value, which can also be specified in the form of a formula in a cell. For each company, the interpretation of the indicator may be different, so everything depends on the level of requirements. For example:
> = 0.90 - Good
> = 0.60 - Acceptable
<0.60 - Poor
or by the formula: = IF (<cell number where the result is counted >> = 0.9; “Good!”; IF (<cell number where the result is counted >> = 0.6; “Acceptable!”; “Everything is bad! "))
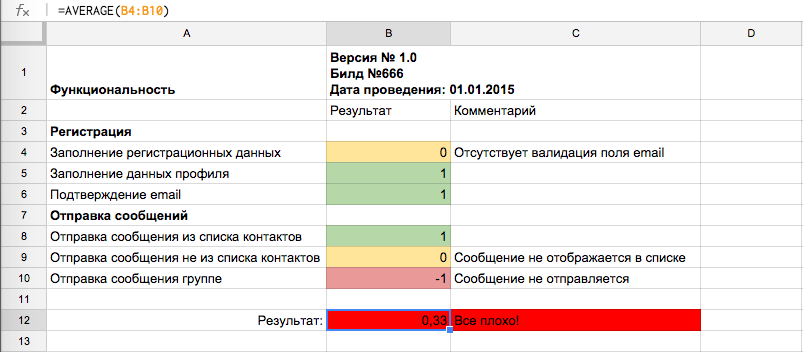
And here is a small example of how it all looks to clearly understand what it is about:
In general, for convenience, the test results themselves are formatted as follows:
1. In the * .xlsx document I make out the scripts and the document template.
2. I spend testing with all marks in the document
3. I create a page in Confluence , where I indicate only the most important information and result. I attach a document with detailed results.
4. I send by letter the results with reference to the page.
Thus, it is not interesting for anyone to know which scenarios are passed, and which are not - just sees the number, the description and everything. And who already wants to delve into the details - downloads the document and reads it in detail.
Also, this method is still remarkable in that it can be implemented as soon as you like with the most minimal set of tools and time costs!
Thanks for attention!
Source: https://habr.com/ru/post/243597/
All Articles