Analytical report on Microsoft SQL Server
Formulation of the problem
Identify bottlenecks when working with databases. Make a report on the performance of sql queries, analyze errors and deadlocks, make comparative reports, calculate the degree of coverage of the stored procedures with tests, build charts.
Testing is carried out regularly. Therefore, reports should be generated automatically, be standardized, easily compared with each other.
')
Used technologies:
- Microsoft SQL Server ;
- Microsoft Office Excel ;
- Complex sql queries organized in the project SQLProfilerReportHelper ;
- Load testing tool with the ability to execute sql query ( JMeter , Visual Studio Ultimate , ...);
Level 300 (for professionals).
In short, the procedure for generating reports on a finished trail is:
- run SQLProfilerReportHelper , click on the buttons;
- perform a selection of records from the table-reports, copy the results to the clipboard;
- run Microsoft Office Excel , insert records from the buffer into an automatically formatted table and save the document report.
The tool and report template are available for download SQLProfilerReportHelper .
If you are interested in reading the description of the tool and reports and the order in which they are compiled, read on.
I'll tell you about two main reports:
- statistics of stored procedures (Draft report);
- statistics of all requests (Detail report).
1. Tracing
The process cannot be understood by stopping it. Understanding must move with the process, merge with its flow and flow with it.
- from the novel “Dune” by Frank Herbert

Tracing, the results of which are analyzed automatically, implies the presence of specific events and columns. Convenient software start at the start of the load test. This is the way I use, other options are possible.
When profiling a loaded OLTP system, it is better to save traces to files. By downloading trace files to a table, the database is already after testing. This creates a lesser additional load on SQL Server than when writing a trace to the database (how much less it did not measure). And less space is consumed (trace files are 3.9-4 times smaller than a similar trace table). Further it is assumed that OLTP and load testing are being tested.
When profiling an OLAP system, when the load is low, you can write traces directly to the database.
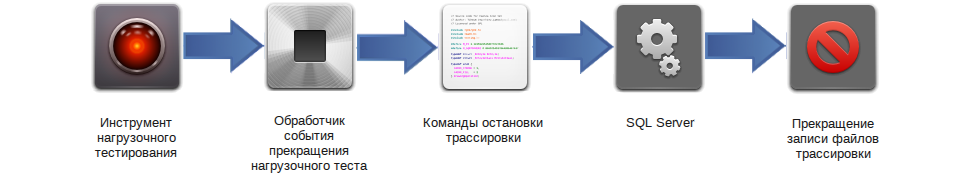
1.1. Auto start

It is convenient to start profiling in the event of the beginning of the load test. In the context of a load test, determine the parameters whose values are conveniently changed without changing the code of the load test:
- useSQLProfiling (true / false) - use tracing when running a test (for example, true)
- pathSQLPrifiling - path to the directory on the server with Microsoft SQL Server for saving trace files (for example, D: \ Traces \ Synerdocs \)
- database names (four parameters) - I use to filter profiling events ( tempdb and three databases of the system under test)
From the context of the load test, the name of the load profile is also extracted, which is reflected in the name of the trace files. And the load profile is extracted test duration, to calculate the moment of completion of the trace.
A parameterized Script.01.Start trace.sql request is executed (see the scripts \ start trace \ directory in the project folder or in the box below).
Script.01.Start trace.sql
-- Script.01.Start trace.sql -- : -- @traceDuration, Int, " ( )" -- , . -- @fileName, nvarchar(256), " " -- , . -- D:\Traces\Synerdocs\ServiceLoadTestBigFiles.2014.01.21 08.30.10 -- @db1, nvarchar(256), -- @db2, nvarchar(256), -- @db3, nvarchar(256), -- @db4, nvarchar(256), -- Create a Queue declare @rc int declare @TraceID int declare @maxfilesize bigint declare @stopTraceTime datetime declare @traceFileName nvarchar(256) declare @traceOptions int -- Create 100 MBytes files set @maxfilesize = 100 -- Duration of trace set @stopTraceTime = DATEADD(second, @traceDuration, SYSDATETIME()) -- Trace filename set @traceFileName = @fileName -- TRACE_FILE_ROLLOVER set @traceOptions = 2 exec @rc = sp_trace_create @TraceID output, @traceOptions, @traceFileName, @maxfilesize, @stopTraceTime if (@rc != 0) goto error -- Set the events declare @on bit set @on = 1 -- 162. User Error Message. Displays error messages that users see in the case of an error or exception. exec sp_trace_setevent @TraceID, 162, 1, @on -- TextData. ntext. exec sp_trace_setevent @TraceID, 162, 4, @on -- TransactionID. bigint. exec sp_trace_setevent @TraceID, 162, 9, @on -- ClientProcessID. int. exec sp_trace_setevent @TraceID, 162, 10, @on -- ApplicationName. nvarchar. exec sp_trace_setevent @TraceID, 162, 11, @on -- LoginName. nvarchar. exec sp_trace_setevent @TraceID, 162, 12, @on -- SPID. int. exec sp_trace_setevent @TraceID, 162, 20, @on -- Severity. exec sp_trace_setevent @TraceID, 162, 14, @on -- StartTime. datetime. exec sp_trace_setevent @TraceID, 162, 31, @on -- Error. int. exec sp_trace_setevent @TraceID, 162, 35, @on -- DatabaseName. nvarchar. exec sp_trace_setevent @TraceID, 162, 49, @on -- RequestID. int. exec sp_trace_setevent @TraceID, 162, 50, @on -- XactSequence. bigint. -- 148. Deadlock Graph. Occurs when an attempt to acquire a lock is canceled because the attempt was part of a deadlock and was chosen as the deadlock victim. Provides an XML description of a deadlock. exec sp_trace_setevent @TraceID, 148, 1, @on -- TextData. ntext. exec sp_trace_setevent @TraceID, 148, 4, @on -- TransactionID. bigint. Not used. exec sp_trace_setevent @TraceID, 148, 11, @on -- LoginName. nvarchar. exec sp_trace_setevent @TraceID, 148, 12, @on -- SPID. int. exec sp_trace_setevent @TraceID, 148, 14, @on -- StartTime. datetime. -- 10. RPC:Completed. Occurs when a remote procedure call (RPC) has completed. exec sp_trace_setevent @TraceID, 10, 1, @on -- TextData. ntext. exec sp_trace_setevent @TraceID, 10, 4, @on -- TransactionID. bigint. exec sp_trace_setevent @TraceID, 10, 9, @on -- ClientProcessID. int. exec sp_trace_setevent @TraceID, 10, 10, @on -- ApplicationName. nvarchar. exec sp_trace_setevent @TraceID, 10, 11, @on -- LoginName. nvarchar. exec sp_trace_setevent @TraceID, 10, 12, @on -- SPID. int. exec sp_trace_setevent @TraceID, 10, 13, @on -- Duration. bigint. exec sp_trace_setevent @TraceID, 10, 14, @on -- StartTime. datetime. exec sp_trace_setevent @TraceID, 10, 15, @on -- EndTime. datetime. exec sp_trace_setevent @TraceID, 10, 16, @on -- Reads. bigint. exec sp_trace_setevent @TraceID, 10, 17, @on -- Writes. bigint. exec sp_trace_setevent @TraceID, 10, 18, @on -- CPU. int. exec sp_trace_setevent @TraceID, 10, 31, @on -- Error. int. exec sp_trace_setevent @TraceID, 10, 34, @on -- ObjectName. nvarchar. exec sp_trace_setevent @TraceID, 10, 35, @on -- DatabaseName. nvarchar. exec sp_trace_setevent @TraceID, 10, 48, @on -- RowCounts. bigint. exec sp_trace_setevent @TraceID, 10, 49, @on -- RequestID. int. exec sp_trace_setevent @TraceID, 10, 50, @on -- XactSequence. bigint. -- 12. SQL:BatchCompleted. Occurs when a Transact-SQL batch has completed. exec sp_trace_setevent @TraceID, 12, 1, @on -- TextData. ntext. exec sp_trace_setevent @TraceID, 12, 4, @on -- TransactionID. bigint. exec sp_trace_setevent @TraceID, 12, 9, @on -- ClientProcessID. int. exec sp_trace_setevent @TraceID, 12, 11, @on -- LoginName. nvarchar. exec sp_trace_setevent @TraceID, 12, 10, @on -- ApplicationName. nvarchar. exec sp_trace_setevent @TraceID, 12, 12, @on -- SPID. int. exec sp_trace_setevent @TraceID, 12, 13, @on -- Duration. bigint. exec sp_trace_setevent @TraceID, 12, 14, @on -- StartTime. datetime. exec sp_trace_setevent @TraceID, 12, 15, @on -- EndTime. datetime. exec sp_trace_setevent @TraceID, 12, 16, @on -- Reads. bigint. exec sp_trace_setevent @TraceID, 12, 17, @on -- Writes. bigint. exec sp_trace_setevent @TraceID, 12, 18, @on -- CPU. int. exec sp_trace_setevent @TraceID, 12, 31, @on -- Error. int. exec sp_trace_setevent @TraceID, 12, 35, @on -- DatabaseName. nvarchar. exec sp_trace_setevent @TraceID, 12, 48, @on -- RowCounts. bigint. exec sp_trace_setevent @TraceID, 12, 49, @on -- RequestID. int. exec sp_trace_setevent @TraceID, 12, 50, @on -- XactSequence. bigint. -- Set the Filters exec sp_trace_setfilter @TraceID, 35, 0, 6, @db1 exec sp_trace_setfilter @TraceID, 35, 1, 6, @db2 exec sp_trace_setfilter @TraceID, 35, 1, 6, @db3 exec sp_trace_setfilter @TraceID, 35, 1, 6, @db4 -- Set the trace status to start exec sp_trace_setstatus @TraceID, 1 -- display trace id for future references select TraceID=@TraceID goto finish error: select ErrorCode=@rc finish: Return Values:
- TraceID, int, trace session identifier, useful to stop tracing later;
- ErrorCode, int, error code, if the trace has not started, see Return Code Values for sp_trace_create .
The way a query is executed in a load test event depends on the testing tool and development language. Both in Java and in C # it becomes simply. You can write a separate manual. Some features in two sentences:
- Events are executed on the load agent, when there are several load agents, in the parameters of the load test the name of the agent that will perform the start and early completion of profiling is set, the agent learns about its purpose by name.
- If the SQL Server is located behind the DMZ , then the agent working with SQL Server is placed on the Edge Server, and a zero load profile is assigned to the agent, but it is simpler not to use the DMZ on the load bench.
Experts familiar with stress testing will understand the previous two sentences. If you could not understand, then you do not have agents, DMZ, or it is easier for you to run the trace in semi-automatic and manual mode.
1.1.1. Tracing stop

Tracing runs on time. The moment of completion of the trace is determined by the duration of the test (the traceDuration parameter) and is calculated in the Script.01.Start trace.sql script. It is assumed that load testing also runs for a while, has a duration that can be obtained programmatically.
1.1.2. Early termination
When running Script.01.Start trace.sql, TraceId is returned. If testing stops early, in the test termination event, the TraceId value is passed to the script:
-- Stops the specified trace. EXEC sp_trace_setstatus @traceid = @traceid , @status = 0 -- Closes the specified trace and deletes its definition from the server. EXEC sp_trace_setstatus @traceid = @traceid , @status = 2 1.2. Semi-automatic start

If it is not possible to automatically execute the sql query at the start of the test, then the Script.01.Start trace.sql query can be executed manually from SQL Management Studio by defining the script parameters.
If the stop time cannot be calculated at the start of the trace, then the stopTraceTime parameter should not be passed to the sp_trace_create procedure (see Script.01.Start trace.sql: 29).
1.2.1. Tracing stop
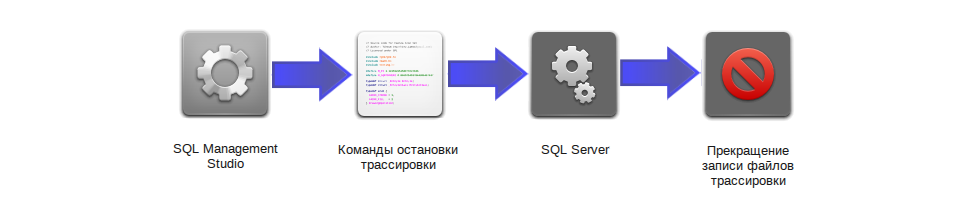
You can also stop profiling by a script by selecting the tracing session to be stopped, for example, by directory (D: \ Traces \ Synerdocs \):
-- Script.02.Stop trace.sql DECLARE @traceid INT SET @traceid = (SELECT TOP 1 [id] FROM sys.traces WHERE [path] LIKE 'D:\Traces\Synerdocs\%') IF @traceid IS NOT NULL BEGIN -- Stops the specified trace. EXEC sp_trace_setstatus @traceid = @traceid , @status = 0 -- Closes the specified trace and deletes its definition from the server. EXEC sp_trace_setstatus @traceid = @traceid , @status = 2 END SELECT * FROM sys.traces
-- Script.02.Stop trace.sql DECLARE @traceid INT SET @traceid = (SELECT TOP 1 [id] FROM sys.traces WHERE [path] LIKE 'D:\Traces\Synerdocs\%') IF @traceid IS NOT NULL BEGIN -- Stops the specified trace. EXEC sp_trace_setstatus @traceid = @traceid , @status = 0 -- Closes the specified trace and deletes its definition from the server. EXEC sp_trace_setstatus @traceid = @traceid , @status = 2 END SELECT * FROM sys.traces 1.3. Manual start
Microsoft SQL Server Profiler allows you to collect a large number of events.
See sp_trace_setevent ( http://msdn.microsoft.com/ru-ru/library/ms186265.aspx ).
As the most interesting events, I will highlight errors, blocking, execution of procedures and queries:
| ID (EventID) | Event (Event Name) | Description (Event description) |
|---|---|---|
| 162 | User Error Message | Error message exception |
| 148 | Deadlock graph | It is canceled when it comes to deadlock. |
| ten | RPC: Completed | Occurs when a remote procedure call (RPC) has completed. |
| 12 | SQL: BatchCompleted | Occurs when a Transact-SQL batch has completed. |
Selected events have the most interesting columns:
| Columnid | ColumnName | Type | Errors | Locks | Procedures | Requests |
|---|---|---|---|---|---|---|
| one | Textdata | ntext | + | + | + | + |
| 13 | Duration | bigint | + | + | ||
| 14 | Starttime | datetime | + | + | + | + |
| sixteen | Reads | bigint | + | + | ||
| 17 | Writes | bigint | + | + | ||
| 18 | CPU | int | + | + | ||
| 31 | Error | int | + | + | + | |
| 34 | ObjectName | nvarchar | + | |||
| 35 | Databasename | nvarchar | + | + | + |
I include additional columns in the trace, they are not used in the reports, but they come in handy with manual analysis:
| Columnid | ColumnName | Type | Errors | Locks | Procedures | Requests |
|---|---|---|---|---|---|---|
| four | TransactionID | bigint | + | + | + | + |
| 9 | ClientProcessID | int | + | + | + | |
| ten | Applicationname | nvarchar | + | + | + | |
| eleven | LoginName | nvarchar | + | + | + | + |
| 12 | SPID | int | + | + | + | + |
| 15 | Endtime | datetime | + | + | ||
| 48 | Rowcounts | bigint | + | + | ||
| 49 | RequestID | int | + | + | + | |
| 50 | XactSequence | bigint | + | + | + |
Tracing filtered by DatabaseName ( ColumnID 35) is performed only for selected SQL Server databases (on test servers, often there are many databases, you only need to select the ones you need):
- tempdb ;
- database of the application under test.
Filtering and grouping is also convenient to do by LoginName .
If you are comfortable with the manual start of tracing, then Microsoft SQL Server Profiler will allow you to view the results of profiling immediately.
1.3.1. Converting customized parameters to a script for automation
If you have another set of events, columns and filters. And you want to automate the launch of tracing with such a set of parameters, then SQL Server Profiler will help here.

Configure automatic tracing:
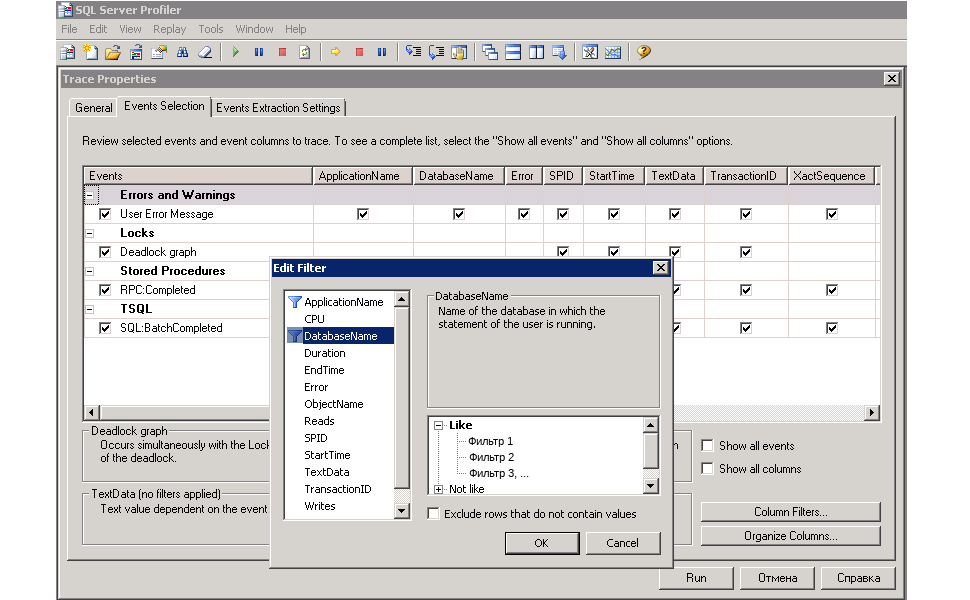
- Launch Microsoft SQL Server Profiler .
- Select the events to be profiled, select the attributes of the events to be profiled.
- Set filtering parameters (by DatabaseName or by LoginName ), parameters are opened by pressing the Column Filters ... button.
- Save the trace settings specified in the Events Selection tab of the “Trace Properties” window using the menu item “ File / Export / Script Trace Definition / For SQL Server 2005 - 2008 R2 ... ”.
The result is a script. Similar to the script text:
Generated script with profiling settings
/****************************************************/ /* Created by: SQL Server 2008 R2 Profiler */ /* Date: 21/01/2014 10:23:02 */ /****************************************************/ -- Create a Queue declare @rc int declare @TraceID int declare @maxfilesize bigint set @maxfilesize = 5 -- Please replace the text InsertFileNameHere, with an appropriate -- filename prefixed by a path, eg, c:\MyFolder\MyTrace. The .trc extension -- will be appended to the filename automatically. If you are writing from -- remote server to local drive, please use UNC path and make sure server has -- write access to your network share exec @rc = sp_trace_create @TraceID output, 0, N'InsertFileNameHere', @maxfilesize, NULL if (@rc != 0) goto error -- Client side File and Table cannot be scripted -- Set the events declare @on bit set @on = 1 exec sp_trace_setevent @TraceID, 162, 31, @on exec sp_trace_setevent @TraceID, 162, 1, @on exec sp_trace_setevent @TraceID, 162, 9, @on exec sp_trace_setevent @TraceID, 162, 49, @on exec sp_trace_setevent @TraceID, 162, 10, @on exec sp_trace_setevent @TraceID, 162, 14, @on exec sp_trace_setevent @TraceID, 162, 50, @on exec sp_trace_setevent @TraceID, 162, 11, @on exec sp_trace_setevent @TraceID, 162, 35, @on exec sp_trace_setevent @TraceID, 162, 4, @on exec sp_trace_setevent @TraceID, 162, 12, @on exec sp_trace_setevent @TraceID, 162, 20, @on exec sp_trace_setevent @TraceID, 148, 11, @on exec sp_trace_setevent @TraceID, 148, 4, @on exec sp_trace_setevent @TraceID, 148, 12, @on exec sp_trace_setevent @TraceID, 148, 14, @on exec sp_trace_setevent @TraceID, 148, 1, @on exec sp_trace_setevent @TraceID, 10, 15, @on exec sp_trace_setevent @TraceID, 10, 31, @on exec sp_trace_setevent @TraceID, 10, 16, @on exec sp_trace_setevent @TraceID, 10, 48, @on exec sp_trace_setevent @TraceID, 10, 1, @on exec sp_trace_setevent @TraceID, 10, 9, @on exec sp_trace_setevent @TraceID, 10, 17, @on exec sp_trace_setevent @TraceID, 10, 49, @on exec sp_trace_setevent @TraceID, 10, 10, @on exec sp_trace_setevent @TraceID, 10, 18, @on exec sp_trace_setevent @TraceID, 10, 34, @on exec sp_trace_setevent @TraceID, 10, 50, @on exec sp_trace_setevent @TraceID, 10, 11, @on exec sp_trace_setevent @TraceID, 10, 35, @on exec sp_trace_setevent @TraceID, 10, 4, @on exec sp_trace_setevent @TraceID, 10, 12, @on exec sp_trace_setevent @TraceID, 10, 13, @on exec sp_trace_setevent @TraceID, 10, 14, @on exec sp_trace_setevent @TraceID, 12, 15, @on exec sp_trace_setevent @TraceID, 12, 31, @on exec sp_trace_setevent @TraceID, 12, 16, @on exec sp_trace_setevent @TraceID, 12, 48, @on exec sp_trace_setevent @TraceID, 12, 1, @on exec sp_trace_setevent @TraceID, 12, 9, @on exec sp_trace_setevent @TraceID, 12, 17, @on exec sp_trace_setevent @TraceID, 12, 49, @on exec sp_trace_setevent @TraceID, 12, 10, @on exec sp_trace_setevent @TraceID, 12, 14, @on exec sp_trace_setevent @TraceID, 12, 18, @on exec sp_trace_setevent @TraceID, 12, 50, @on exec sp_trace_setevent @TraceID, 12, 11, @on exec sp_trace_setevent @TraceID, 12, 35, @on exec sp_trace_setevent @TraceID, 12, 4, @on exec sp_trace_setevent @TraceID, 12, 12, @on exec sp_trace_setevent @TraceID, 12, 13, @on -- Set the Filters declare @intfilter int declare @bigintfilter bigint exec sp_trace_setfilter @TraceID, 35, 0, 6, N'ServiceDB' exec sp_trace_setfilter @TraceID, 35, 1, 6, N'ClientDB' exec sp_trace_setfilter @TraceID, 35, 1, 6, N'LogsDB' exec sp_trace_setfilter @TraceID, 35, 1, 6, N'Tempdb' -- Set the trace status to start exec sp_trace_setstatus @TraceID, 1 -- display trace id for future references select TraceID=@TraceID goto finish error: select ErrorCode=@rc finish: go The parameters from the General tab of the “Trace Properties” window do not fall into the preparation of the trace script. There are the necessary parameters that are added to the script manually:
- Save to file ;
- Set maximum file size (MB) ;
- Enable file rollover ;
- Enable trace stop time .
The file name and tracing stop time is set from the load test code, and the maximum file size and a sign that it will be necessary to create new files is conveniently set by a constant. This is exactly how Script.01.Start trace.sql , described above, was created.
Description of the parameters Set maximum file size (MB) and Enable file rollover : http://msdn.microsoft.com/en-us/library/ms191206.aspx .
Uploading trace files to the database
To generate reports, trace files are loaded into a database table.
A database is pre-created, traces will be loaded into the tables of this database, and tables with reports will be created in it. You can call the ProfilerResults database. The database name is convenient to reflect the name of the project, reports on which will be accumulated in it. The project I'm working on was once called Midway, so the database was called MidwayProfilerResults . To create a database, it is convenient to use SQL Management Studio , where there is a wizard for creating a database, a couple of clicks and you're done.
For loading the system function fn_trace_gettable is used.
use "ProfilerResults" SELECT "EventClass" , "TextData" , "Duration" , "StartTime" , "Reads" , "Writes" , "CPU" , "Error" , "ObjectName" , "DatabaseName" , "TransactionID" , "ClientProcessID" , "ApplicationName" , "LogiName" , "SPID" , "EndTime" , "RowCounts" , "RequestID" , "XactSequence" INTO "SOAP.v2.3.1.5577" FROM ::fn_trace_gettable(N'D:\Traces\Synerdocs\LoadTest.SOAP.Trace.StartOn 2013.01.21 08.30.00.trc', default) The fn_trace_gettable parameters specify the path to the first trace file, and the second default parameter means that all files from the same trace session will be loaded into the table (not just the specified file of 100 MB in size).

The name of the profiling table is set to reflect the version of the system under test and the load profile (in the example: "SOAP.v2.3.1.5577"). Created tables with reports will contain in the name the name of the profiling table according to which they are formed. And in order to further find the desired table with the report among many others, it is better to set a meaningful name to the table.
Download may take a long time, depending on the equipment. On the server used, the download speed is as follows: 160-190 MBytes / minute or 1.5 - 2 trace files per minute (one file - 100 MBytes). Measurements from two recent operations of loading trace files into the database (normal load profile and load profile with large files).
| Trace files size (MB) | Download duration (h: min: s) | Average download speed (MB / min) | Trace table size (MB) | Number of lines | The average size of the row table (KB) | The increase in size after loading the table |
|---|---|---|---|---|---|---|
| 7,598 | 00:45:17 | 168,8 | 29 478.3 | 766 370 | 39.4 | 3.9 |
| 67,062 | 05:46:32 | 193.8 | 268 875.7 | 2,861,599 | 96.2 | 4.0 |
2. Summary Report on Procedures (RPC: Completed) - “Draft Report”
Excessively careful analysis distorts the truth.
- an ancient Frimenian maxim from Frank Herbert's The Messiah of the Dunes
If work with the database is carried out mainly through the database API (a set of stored procedures and functions), then this report is the first thing worth building.
The report is a grouping of RPC: Completed events from the trace table by the database name ( DatabaseName ) and the name of the stored procedure or function ( ObjectName ) with statistics and texts of fast and slowest queries. Statistics for SQL: BatchCompleted is also in the report, but this is only one line - the string NULL, without detail. Therefore, this report is called “Draft Report”.
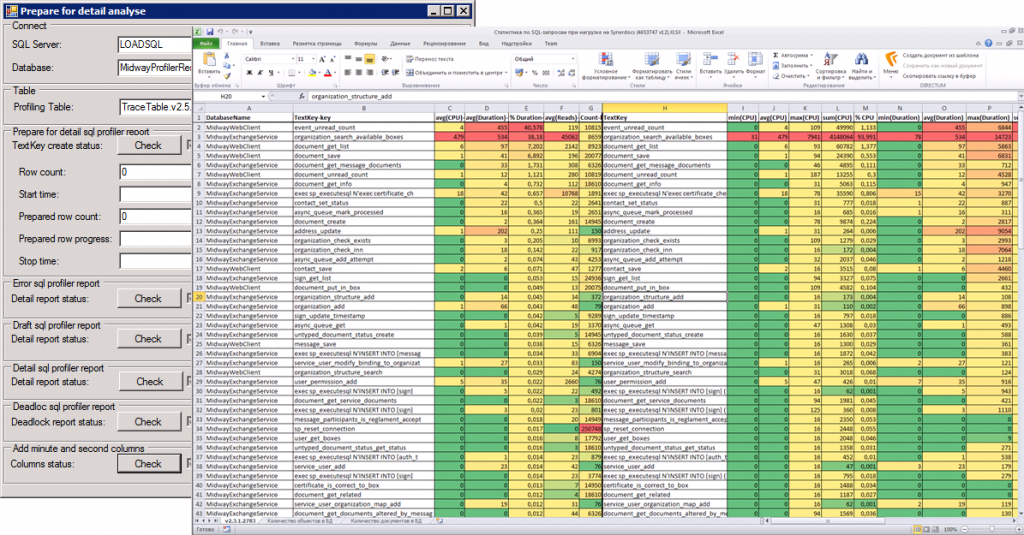
To automate the construction of the “Draft Report” report, an auxiliary tool Tools.SQLProfilerReportHelper is used .
2.1. Preparation for the formation of the report "Draft Report"
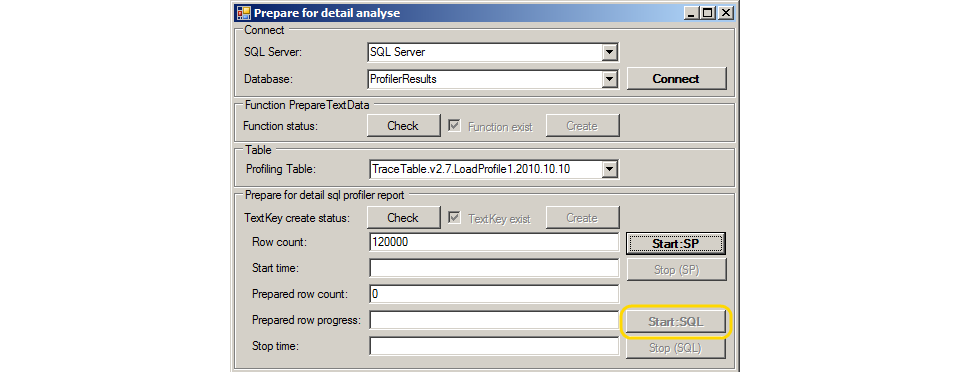
Preparation is reduced to pressing buttons on the form Tools.SQLProfilerReportHelper :
- Launch Tools.SQLProfilerReportHelper .
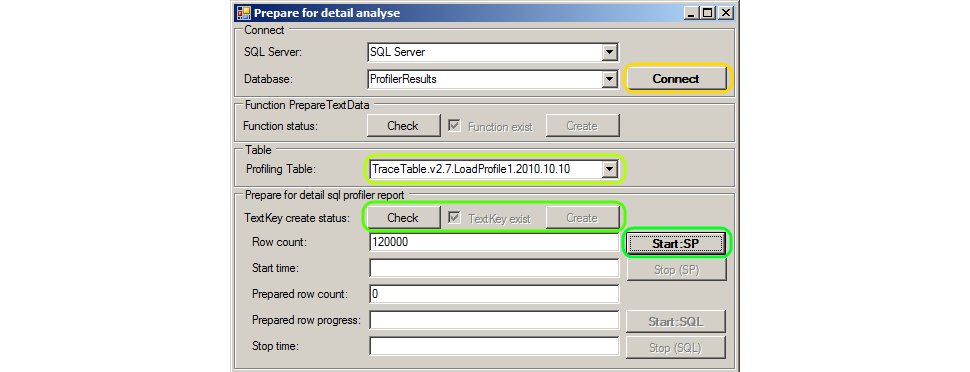
- Specify the SQL Server name and profiler in the SQL Server and Database fields. In the example, this is “SQL Server” and “ProfilerResults”. Click the Connect button. Windows authentication using SQL Server is used, the user must be the profiling database administrator.
- Select from the Profiling Table list a table with profiling results. In the example, this is “TraceTable.v2.7.LoadProfile1.2010.10.10”.
- Create a new TextKey column in the profiling table - check the presence / absence of a column in the table by clicking the Check button, and if the column does not exist (the Create button becomes available), click the Create button.
- Press the Start button : SP . Clicking will copy the values from the ObjectName column to the TextKey column.
While copying the ObjectName to the TextKey column, how many records are left to process. And the remaining duration of the operation is calculated. The process can be interrupted by pressing the Stop: SP button.
2.2. Formation of the report "Draft Report"

After copying is complete, create a draft report. To do this, click the Check button (check the presence / absence of a table with a report), and if there is no table with a report, then click the Create button. As a result, a table will be created with the ending “DraftStat” in the name, in our example, TraceTable.v2.7.LoadProfile1.2010.10.10.DraftStat . The size of the table is relatively small (10-30 MBytes). The table is intended for long-term storage of statistics on the performance of stored procedures and functions.
The contents of the table get a query:
USE "ProfilerResults" SELECT * FROM "dbo"."TraceTable.v2.7.LoadProfile1.2010.10.10.DraftStat" 
The query is convenient to execute in SQL Management Studio .
Copy to the clipboard all columns, except the text query columns TextData -....
The composition of the columns of the table DtaftStat (report Draft Report)
| Speaker | Type of | Description |
|---|---|---|
| Databasename | nvarchar (256) | Database (grouping key). |
| ObjectName -key | nvarchar (256) | The name of the stored procedure or function (grouping key). |
| avg (CPU) -key | int | CPU time (average) in milliseconds used by the event. |
| avg (Duration) -key | bigint | The duration of the event (average) in milliseconds. |
| % Duration-key | float | The proportion of the total duration of the event (sort key). |
| avg (Reads) -key | bigint | The number of logical disk reads (average) performed by the server for the event. |
| Count-key | int | The number of calls (pieces). |
| ObjectName | nvarchar (256) | The name of the stored procedure or function (grouping key). |
| avg (CPU) | int | The average value for the CPU column (average CPU time in milliseconds used by the event). |
| max (CPU) | int | Maximum CPU time in milliseconds used by the event. |
| sum (CPU) | int | Total CPU time in milliseconds used by the event. |
| % CPU | float | The proportion of the total CPU time of the event. |
| min (Duration) | bigint | The event duration (mini) in milliseconds. |
| avg (Duration) | bigint | Event duration (average) in milliseconds. |
| max (duration) | bigint | Event duration (maximum) in milliseconds. |
| sum (duration) | bigint | Event duration (total) in milliseconds. |
| % Duration | float | The proportion of the total duration of the event. |
| min (Reads) | bigint | The number of logical disk reads (minimum) performed by the server for the event. |
| avg (Reads) | bigint | The number of logical disk reads (average) performed by the server for the event. |
| max (Reads) | bigint | The number of logical disk reads (maximum) performed by the server for the event. |
| sum (Reads) | bigint | The number of logical disk reads (total) performed by the server for the event. |
| % Reads | float | The proportion of the number of logical disk reads performed by the server for an event. |
| min (Writes) | bigint | The number of physical disk writes to write (mini) made by the server for the event. |
| avg (Writes) | bigint | The number of physical disk accesses for writing (average) made by the server for the event. |
| max (Writes) | bigint | The number of physical disk writes to write (maximum) made by the server for the event. |
| sum (Writes) | bigint | The number of physical disk accesses for writing (total) performed by the server for the event. |
| % Writes | float | The proportion of the number of physical drives accessed by the server for the event. |
| Count | int | The number of events. |
| % Count | float | The proportion of the number of events. |
| TextData-min (Duration) | ntext | Query text for which the duration of the execution is minimal. |
| TextData-max (Duration) | ntext | Query text for which the execution time is maximum. |
| TextData-min (Reads) | ntext | Query text for which the number of logical disk reads performed by the server is minimal. |
| TextData-max (Reads) | ntext | Request text for which the maximum number of logical disk reads performed by the server is performed. |
| TextData-min (CPU) | ntext | Query text for which the CPU time is minimal. |
| TextData-max (CPU) | ntext | Query text for which the CPU time is maximum. |
| TextData-min (Writes) | ntext | The text of the request for which the number of physical disk accesses made by the server is minimal. |
| TextData-max (Writes) | ntext | The text of the request, for which the number of server physical disk accesses to write to the maximum. |
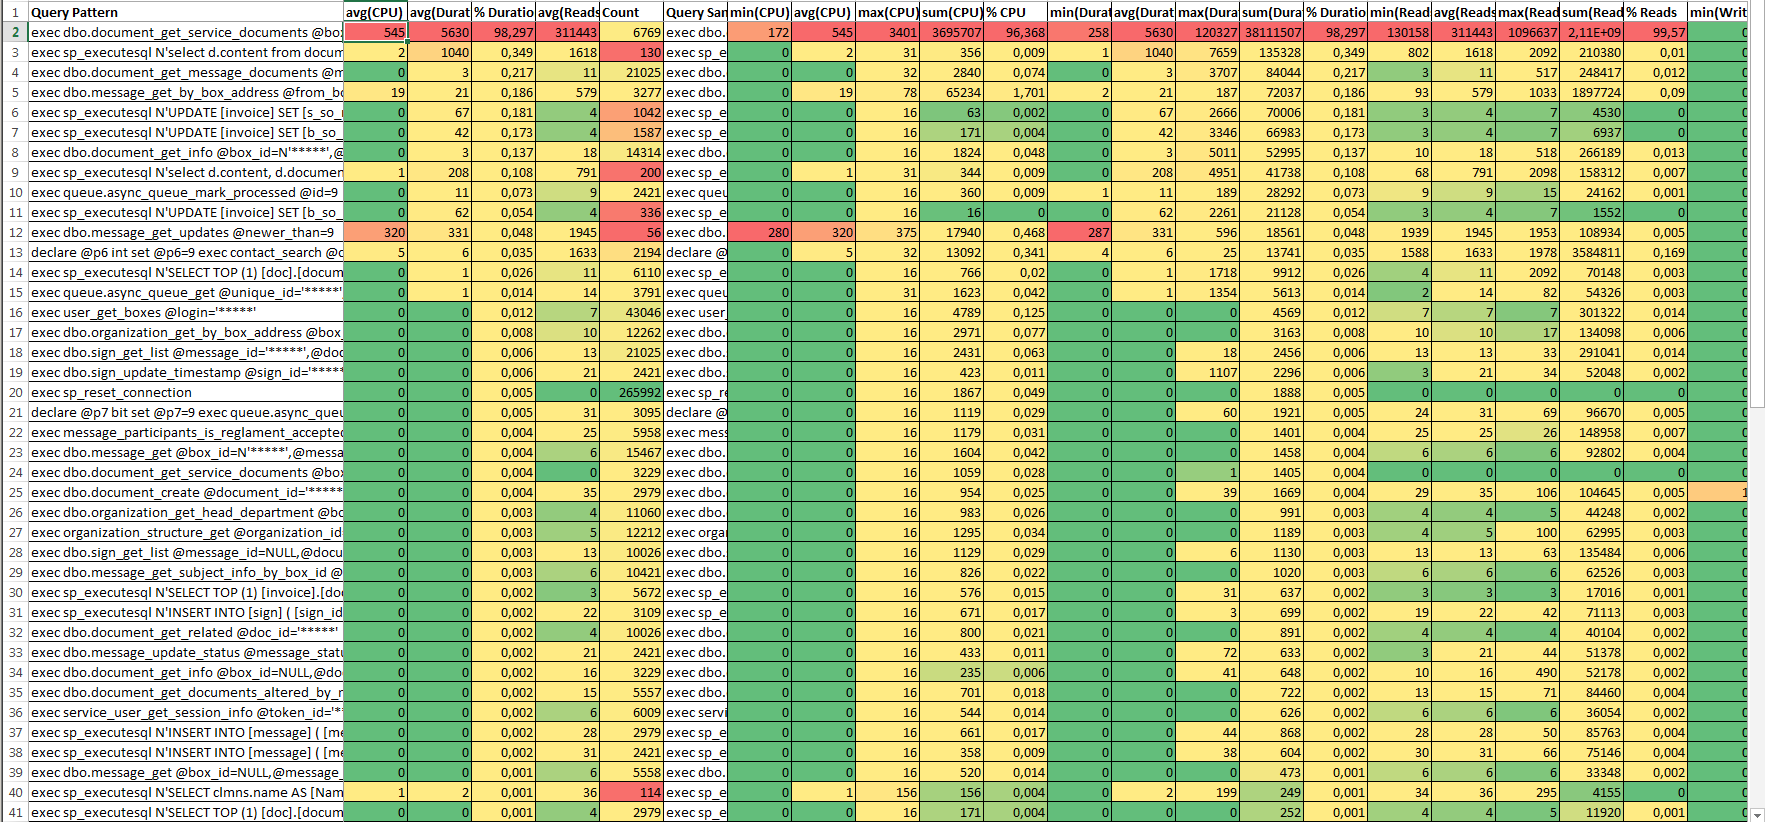
Open report template in Microsoft Office Excel (table with automatic formatting of cells - highlighting values from bad to good). Paste the contents of the clipboard into the document.
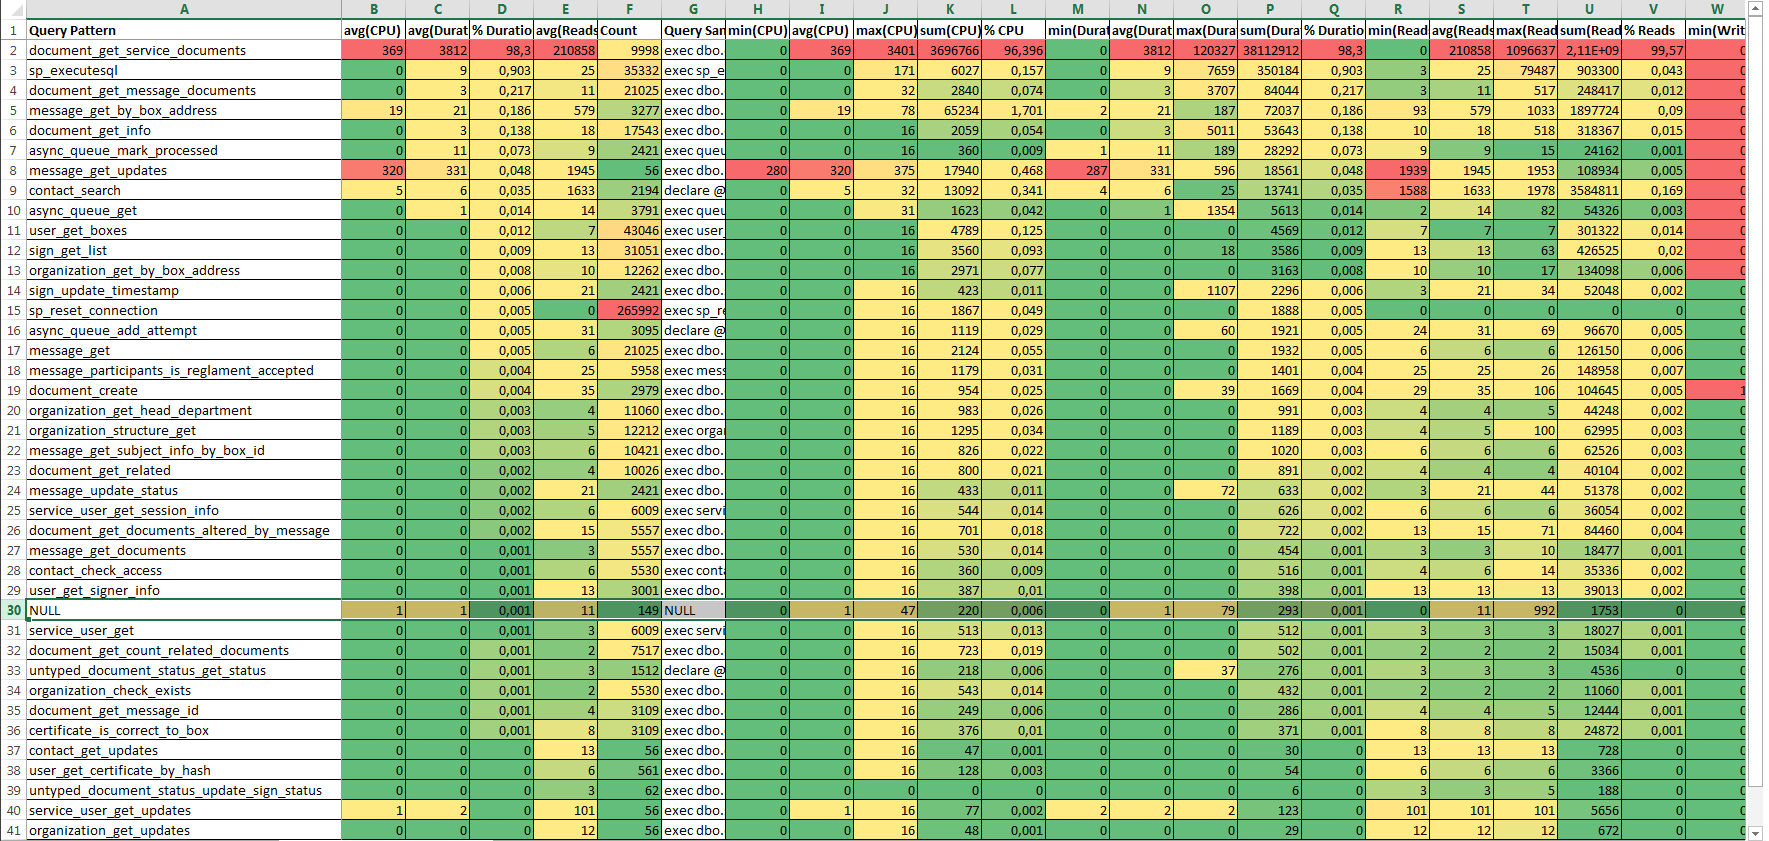
The document will look like a large colored table, sorted in descending order in the % Duration column.
The first six columns are separated from the rest (and duplicate them) are the main ones. These six main columns are conveniently copied from an Excel document to a Word document.
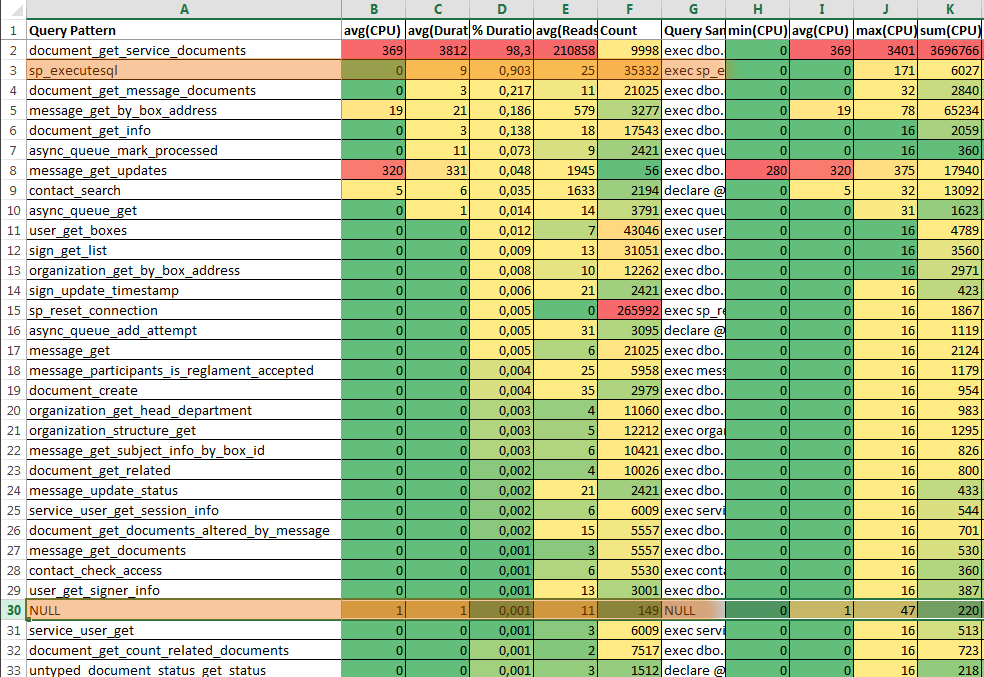
The strings with the “NULL” key and the “sp_executesql” key are statistics on query calls ( SQL: BatchCompleted ) and queries executed by calling the stored procedure sp_executesql . If there are few such requests (the Count column) and the proportion of the duration of their execution is small (the % Duration column), then a detailed report can be left unlimited by analyzing the draft report.
2.3. Analysis of the report "Draft Report"

Pay attention to stored procedures with a maximum value of % Duration and avg (Reads) .
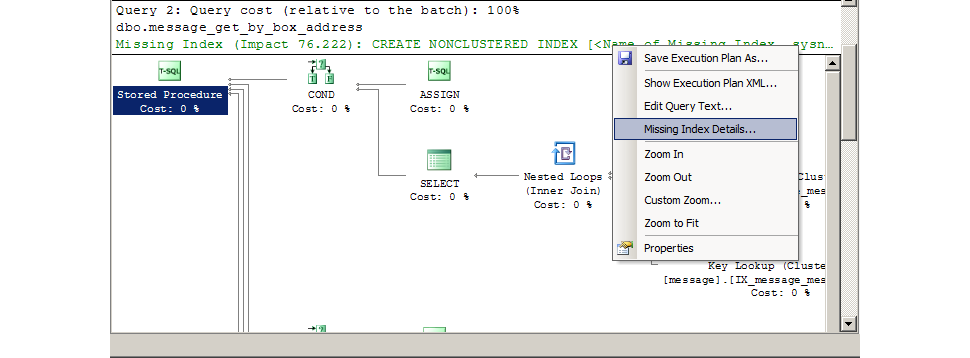
Often such calls can be sped up by adding missing indexes. SQL Management Studio will tell you exactly which indexes to add. The correctness of the advice is not absolute, but high.
There was a case that the query was optimal and the indices were in place, but in the text of the stored procedure all the records of a large table were selected (for debugging) - from this, the query was in the lead in the report on % Duration . Query execution in SQL Management Studio reveals such cases of huge samples. According to the report, such moments cannot be identified, I do not include statistics on the RowCount column in the report (it would be necessary to include it).

I suppose sometimes you can cache calls with a high value of % Duration and Count (you can sort the records in descending order of the “% Duration” x “Count”).
It is possible that in calls with a high value of % Duration and avg (CPU) there is non-optimal work with strings, mathematics, recursion.
Calls with a high value of % Duration and avg (Write) may not optimally use temporary tables. Or point to an insert in a table where there are too many indexes and complex triggers.
Query texts with minimum and maximum values of duration, number of logical reads, CPU time are extracted from the columns of the table-report (there are no these columns in the report document):
- TextData-min (Duration);
- TextData-max (Duration);
- TextData-min (Reads);
- TextData-max (Reads);
- TextData-min (CPU);
- TextData-max (CPU);
- TextData-min (Writes);
- TextData-max (Writes).
Texts are analyzed in SQL Management Studio .
3. Summary Report on Queries (RPC: Completed + SQL: BatchCompleted) - Detail Report
If in the Draft Report, the lines with the “NULL” and “sp_executesql” keys did not hide the execution details for many queries. Then in the Detail Report group will be executed as detailed as possible.
Report formation Detail Report assumes that the Draft Report has already been generated and the preparatory actions have been completed.
3.1. Preparing for the formation of the Detail Report
If the Draft Report is formed, then it is enough:
- Make sure that the PrepareTextData function is in the database by clicking the Check button in the Function PrepareTextData group (create a function if necessary by clicking the Create button ).
- Generate grouping keys by query text (for grouping SQL events : BatchCompleted by TextData column ) by clicking the Start: SQL button .
Otherwise, you need to do everything from the beginning: connect to the database with the profiling table, select the profiling table, create the TextKey column , press the Start: SP button to fill the grouping keys by stored procedures. Actions are performed by clicking on the available buttons on the tool form. Buttons that do not need to be pressed become inaccessible.
3.2. Report Formation

- Check the status of the existence of a detailed report by clicking the Check button in the Detail report status .
- Create a report if there is none (if the Create button is available for pressing, then click it).
As a result, a new table-report will be created, the name of which will end with “DetailStat”.
The description of the columns is the same as the description of the columns for Draft Report. But there are more rows in this table (more detailed report).
The data from the DetailStat table is also copied to the clipboard and inserted into the report template as for the Draft Report .
3.3. Report analysis
The analysis of the detailed report (Detail report) is similar to the analysis of the draft report (Draft Report). But there is an additional opportunity to view and download the texts of requests.
Clicking on the View button opens a window with the contents of a detailed report.
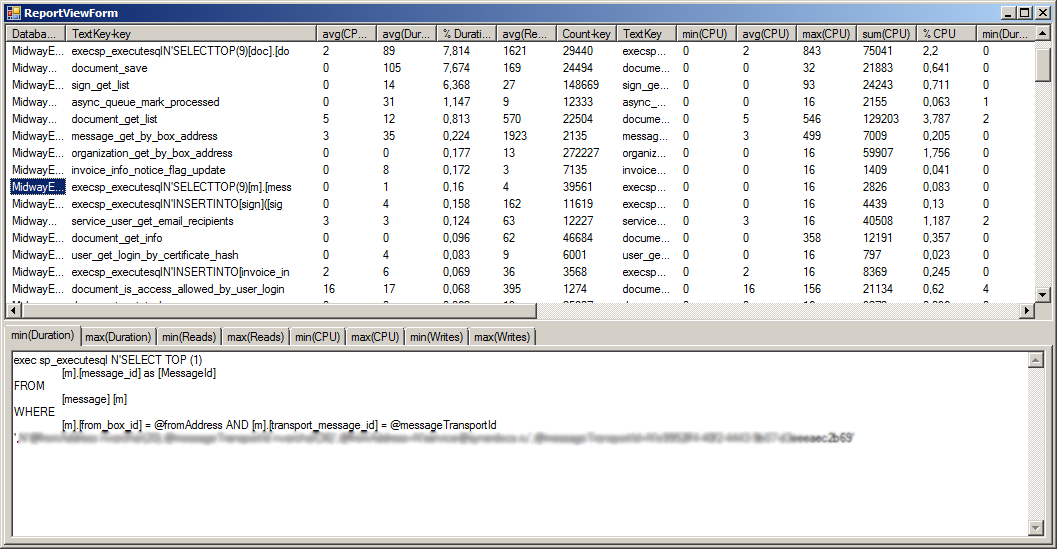 .
.In the "ReportViewForm" window, you can view the records, sort. Query texts that are clicked are saved as files in the program folder. And on the tabs you can see the query text, the first 10,000 characters of the query text.
This method of downloading query texts was made to enable the analysis of large queries. So if the operations of creating documents with a size of 100-700 MB, then the query texts for these operations are huge in tres. They are so huge that even the RAM may not be enough for the select * from ... DetailStat request. When working with the DetailStat report tablethrough such a special viewer, records are retrieved by separate requests, and not by one general. This allows you to upload texts of large queries. If there are no large queries in the report, then working from SQL Management Studio is more convenient.
Sequential unloading of query texts into files allows us to solve the problem of lack of memory when working with large query texts (downloaded query texts of 500 MBytes or more).
Industrial exploitation
The described method of collecting and analyzing Microsoft SQL Server traces was tested when testing two products. Both products are related to accounting.
OLTP system (Synerdocs)
Frequent sampling of small portions of data, frequent updates of individual records (incoming / outgoing, documents, signatures). Many users (1000-2000 test users). Many calls to stored procedures and functions (API databases). Few sql query calls that are not stored procedure calls. Requests during the load testing recruited several hundred thousand. Requests are collected in a hundred groups.
The collection of the trace starts for the duration of the load test (a couple of hours). Then dozens of gigabytes of traces are analyzed and turned into reports.
Testing is carried out regularly. At some point, finding obvious bottlenecks has become difficult. It took the tool for detailed analysis. And so that the reports are easily compared with each other (grouping keys must be short in order to be inserted into the Excel column ). So there were reports, which are described above.
OLAP system (Prestima)
Sampling and grouping large portions of data, updating individual records (budgeting, accounts, postings). Relatively few users during testing (the load is created by real people who run the formation of reports). Many dynamically formed queries (long query text, the differences between the two queries can only be on the 200th character in the section with JOINs or on the 250th in the WHERE section). Queries are analytical, to a set of tables, with different conditions. The distinct impact of the query criteria on the duration. The longest request from the fastest may differ not in the structure of the request, but in the values of the parameters.
The collection of the trace starts for the duration of the functional and volume testing (perhaps a couple of days). Periodically, traces are analyzed and turned into reports.
To statistics for complex queries do not fall into one group, the grouping keys must be accurate. In the PrepareTextData procedure, you can specify the length of the calculated key. And with a small amount of traces, the use of long grouping keys is quite normal (the speed of generating reports will remain high).
Authorship and links
The analytical reports presented in the article are descendants of the sql query written by Mikhail Izvekov (the developer of NPO Computer). The request is simple and beautiful:
-- REPLACE X. @Len , -- . , -- , , . -- 26 IContents "select distinct X as Ob", -- , , -- 4000, -- ( , ..). declare @Hours float; declare @CPUSumm int; declare @Len int = 26; select @CPUSumm = SUM(CPU) from Test -- , . select @Hours = CAST(MAX(StartTime) - MIN(StartTime) as float) * 24 from Test -- , . select SUBSTRING(REPLACE(REPLACE(REPLACE(REPLACE(REPLACE(REPLACE(REPLACE(REPLACE(REPLACE(REPLACE(REPLACE(REPLACE(REPLACE(CAST(TextData as nvarchar(4000)),'0','X'),'1','X'),'2','X'),'3','X'),'4','X'),'5','X'),'6','X'),'7','X'),'8','X'),'9','X'),'XX','X'),'XX','X'),'XX','X'), 1, @Len) as [Query Pattern], sum(CPU) / 1000 as CPU_sec_SUM, avg(CPU) as CPU_msec_AVG, max(CPU) as CPU_msec_MAX, min(CPU) as CPU_msec_MIN, avg(Duration) / 1000 as [AVG_Duration (msec)], avg(Reads) as [Avg Reads], avg(Writes) as [Avg Writes], count(1) as TotalQnt, round(count(1) / @Hours, 2) as Count_per_hour, round(cast(SUM(CPU) as float) / @CPUSumm * 100, 3) as ImpactCPUPerf from Test -- , . where EventClass in (10, 12) and ISNULL(ApplicationName, 'Unknown') in ('SBRSE', 'IS-Builder', 'Unknown') group by SUBSTRING(REPLACE(REPLACE(REPLACE(REPLACE(REPLACE(REPLACE(REPLACE(REPLACE(REPLACE(REPLACE(REPLACE(REPLACE(REPLACE(CAST(TextData as nvarchar(4000)),'0','X'),'1','X'),'2','X'),'3','X'),'4','X'),'5','X'),'6','X'),'7','X'),'8','X'),'9','X'),'XX','X'),'XX','X'),'XX','X'), 1, @Len) Request Michael, in its original form, could not be used. The analysis of the 30-40 GBytes trace takes a long time. And the texts of the requests in the trays were such that they did not want to be grouped. With a short key (10 characters), all select and update requests were mixed. And with a long key (30 characters or more), calls to stored procedures with GUID parameters created thousands of similar grouping keys:
exec [dbo].[getDoc] @id="128500FF-8B90-D060-B490-00CF4FC964FF" --exec [dbo].[getDoc] @id="XFF-X exec [dbo].[getDoc] @id="AABBCCDD-0E0E-1234-B491-0D43C5F6C0F6" --exec [dbo].[getDoc] @id="AABBC Began to try various options for calculating the grouping key. The results were recorded in the new column of the profiling table. And this column has already grouped the results. So it all began.
More recently, on Friday, sat with Misha talked about a difficult life, but his beard is thick. And I forgot to tell him that I will write an article.
From that, I don’t know yet what license for Michael’s script. And the license for the SQLProfilerReportHelper tool is BSD, free. Embed trace scripts in load tests, analyze traces, generate reports.
The tool is available on Github: https://github.com/polarnik/SQLProfilerReportHelper .
The report pictures presented in the article are old, and therefore not very secret. If you notice a discrepancy between the picture of the report and the composition of the columns in the table-report formed by the tools, treat with understanding.
Completion
The guide describes the process of generating grouping reports based on SQL Server profiling data . This is only one tenth of the performance testing. But bright and important.
In the next part of the article I will talk about other reports that are formed on the basis of traces.
Source: https://habr.com/ru/post/243587/
All Articles