Ethernet Weather Station 2 - Continued ...
Greetings to all! Debt time did not have the opportunity to tell the public about what my project has become.
Finally got around to writing another article.
In my first article, “Ethernet Weather Station,” I was told about a project to create a home weather station with a certain basis for expanding functionality in the future. At the current moment from the project this product has moved to the section of a full-fledged device. Working on a 24/7 basis and faithfully informing me and my family of the weather conditions. I must say that much has been changed.
Initially, the idea was to use a home server, but later, I still came to the conclusion that it would be more functional and accessible to use cloud services for displaying and storing data. And here I came across an article by Evgeny Boger, an Habr reader, evgeny_boger “Demonstration of the Wiren Board Smart Home” , which described the use of the wonderful Ninja Blocks service. On it, I decided to implement a data mapping.
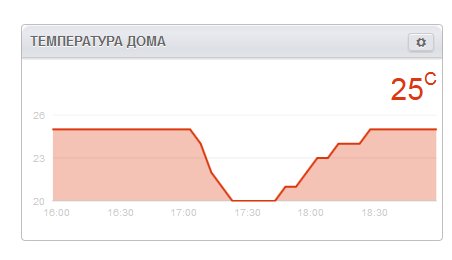
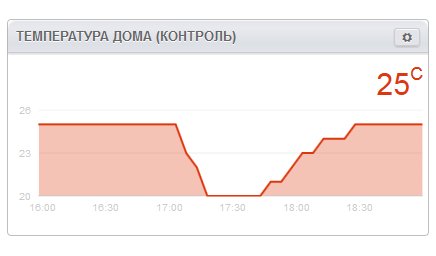
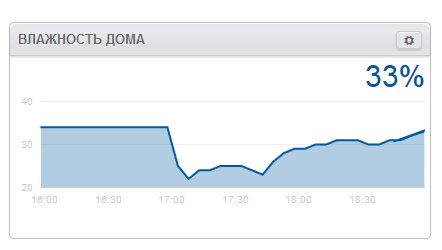
At the moment it looks like this:
')
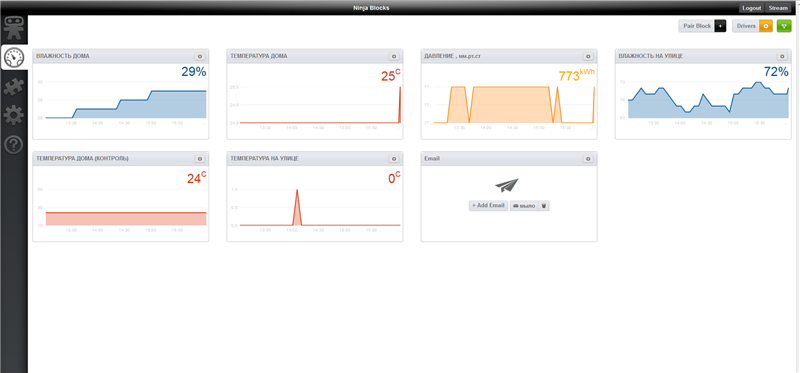
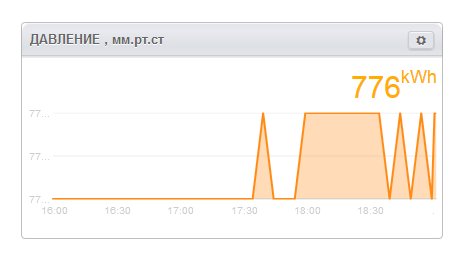
Immediately make a reservation, the graphs show a slight non-linearity of the data, something like a “bounce” . I haven’t been able to fix this problem yet, perhaps this is either because of the large interval of data logging ( every 60 seconds ). Or just a certain error of sensors. If someone prompts the decision, I will be grateful. And for those who are especially attentive, you can see that the pressure measurement goes to “KWh”, this is because, oddly enough, I didn’t find a graph in Ninja Blocks to display pressure data. Therefore, for the "color" differentiation and simply visual perception, I used a graph of the display of power consumption. You can also see two graphs of the internal temperature. This is because BMP085 also has the ability to measure temperature, and I used it as a control sensor.
Let's say a few words about the code itself:
Working with the Ninja Blocks service itself from a code point of view is very easy and convenient.
First you need to create an account on the cloud. To do this, go to the address: "Ninja Blocks"

Create an account.
We now have a unique code, a “token,” for use in the code itself to identify our device.

It is worth adding that we need for Arduino Virtual Block Token .
Now we are going to write the code.
Initially, we specify the desired library when writing a sketch:
Next, we register the connection with the server of the cloud Ninja Blocks :
And then we specify which data to send and which schedule to use to display it.
On the example of temperature, it looks like this:
A complete list of possible graphs and their description can be found here "List of graphs" . Alas, there is no graphic prompt. I personally, was looking for the required, brute force method.
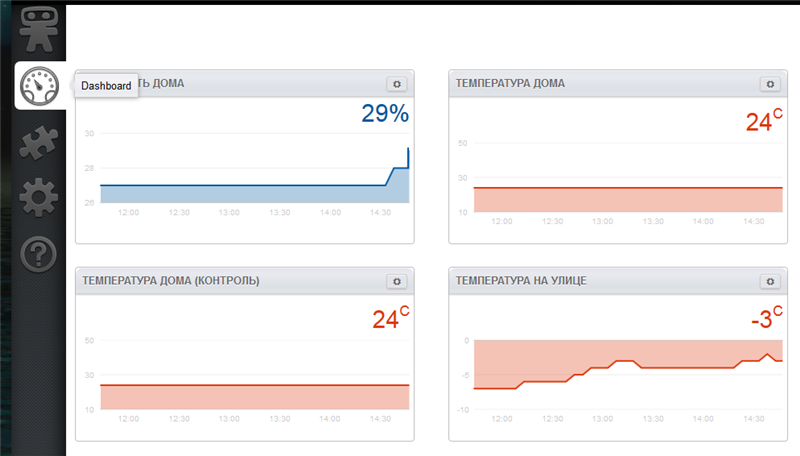
I must also say that the chart specified in the code appears automatically in the “Dashboard” section:
In short, how to work with this service.
I did not give the final code, since It is no different than the original. If anyone is interested, I will send it.
The very same product, at the moment, has the following form:
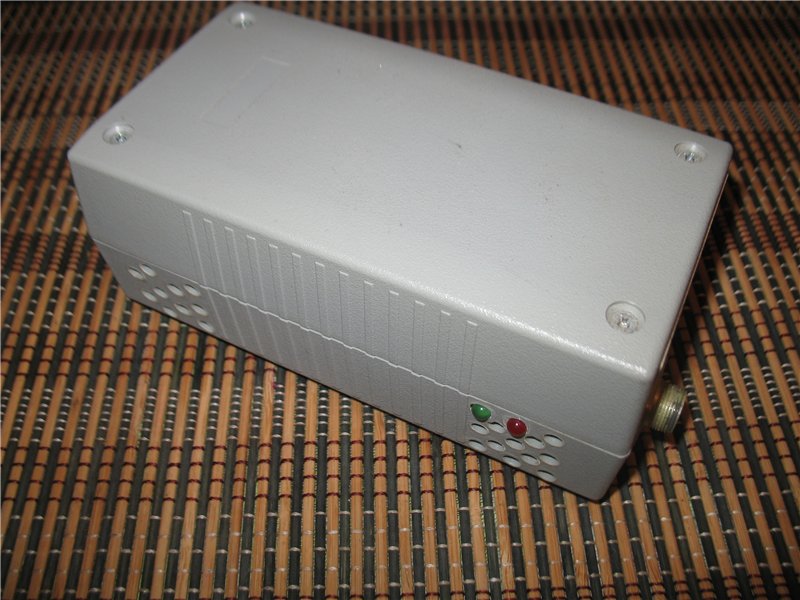
The station is framed in a full-fledged building, equipped with an external power supply in 5V. As you can see from the photo, there are two indicators for evaluating work, “green” - power , “red” - data transfer . At once I will say that everything was not going according to the principle of “factory” product, but according to the old Russian principle “I blinded you from what it was!” . But, however, there was still an attempt toblind from ... do "as it should . "
A little bit about the measurement parameters of the weather data itself
This is still a weather station and it would be wrong not to mention the ranges of its measured parameters.
Measurement of indoor parameters:
• Humidity measurement range 0% .. 100%
• Temperature measuring range -40 ~ + 80 ℃
Measurement of parameters outside the room:
• Humidity measurement range 0% .. 100%
• Temperature measuring range -40 ~ + 80 ℃
Measurement of air pressure parameters:
• Range of measured pressures, mbar 300 - 1100
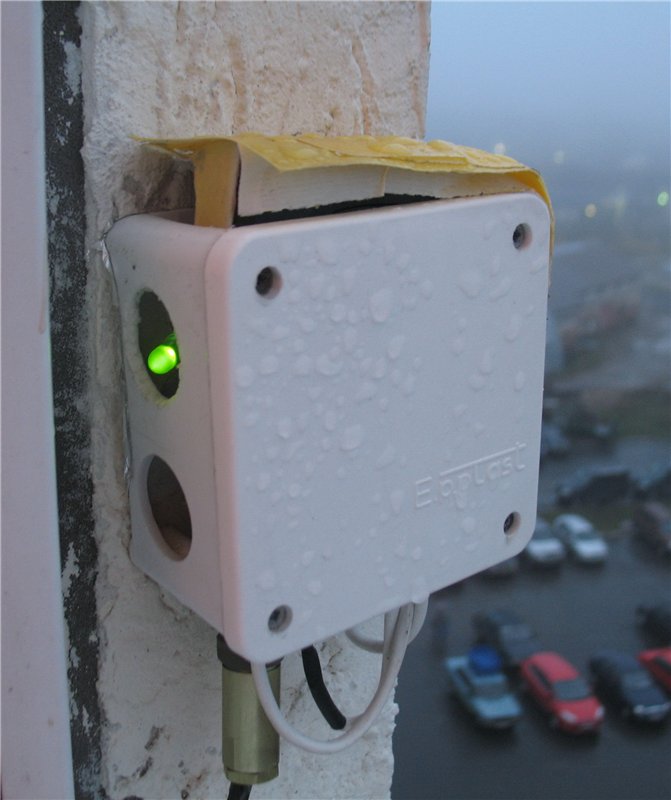
I want to say a single word about the placement of the external sensor. Over his placement, I thought for a long time. Initially, the sensor huddled in a conventional installation box, next to the sensor from the "factory" weather station:
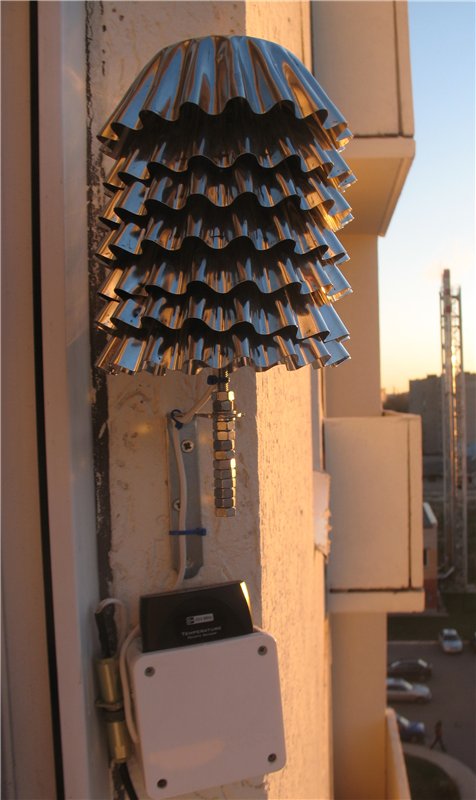
But it was temporary. Yes, and it looked pretty awful. As a result, a solution was found. And to accommodate the external sensor was created this "this" :
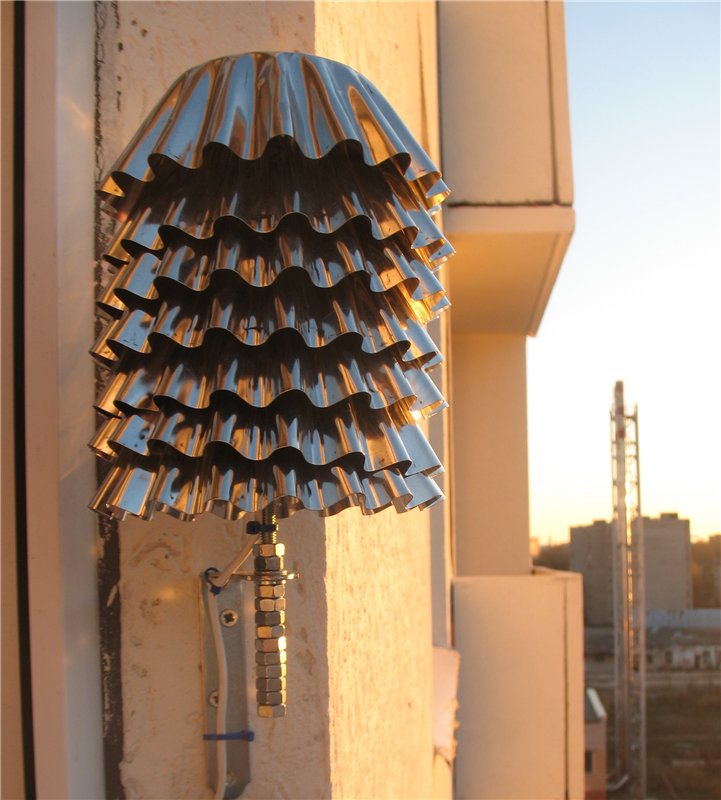
Yes, and why so many nuts 0_o? No, not as a counterweight, but just for the view))) Enough and one would be)
Now both sensors are adjacent in this way:
Who will be interested in the process of creating this miracle, home dubbed it just “herringbone” , then step by step photos in the archive in the application PHOTO ARCHIVE . Initially I apologize for the quality, the photo was taken in the process.
And yet, this “Christmas tree” at night has a rather aesthetic acid-green interior light! Which is perfectly visible from the ground. Well it is, more "lyrics" , for scaring away particularly impressionable neighbors)
In custody:
As a result, we have a full-fledged, not very expensive, fully functional weather station.
Which gives data on temperature and humidity inside and outside the room , as well as data on air pressure . Also, access to this data can be carried out from any device with Internet access thanks to the Ninja Blocks service.
What's next?!?
Now there are ideas to make the project more ambitious, to write a widget for the Android platform. Implement data accessibility not only for me, but for the rest of the residents of the district and the city as a whole. After all, the weather from a specific point is much more accurate than the weather from “gismeteo” or other resources that have global data.
Used materials:
"Ethernet weather station"
"Demonstration of the Wiren Board Smart Home"
PS
Anyone interested will be glad to answer all the questions. I can send the source code.
Finally got around to writing another article.
In my first article, “Ethernet Weather Station,” I was told about a project to create a home weather station with a certain basis for expanding functionality in the future. At the current moment from the project this product has moved to the section of a full-fledged device. Working on a 24/7 basis and faithfully informing me and my family of the weather conditions. I must say that much has been changed.
Initially, the idea was to use a home server, but later, I still came to the conclusion that it would be more functional and accessible to use cloud services for displaying and storing data. And here I came across an article by Evgeny Boger, an Habr reader, evgeny_boger “Demonstration of the Wiren Board Smart Home” , which described the use of the wonderful Ninja Blocks service. On it, I decided to implement a data mapping.
At the moment it looks like this:
')
More charts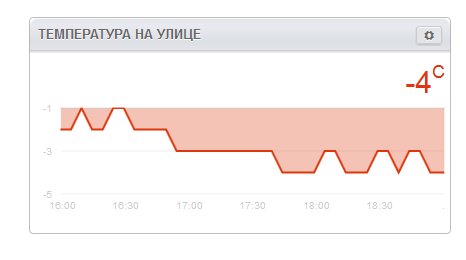

Immediately make a reservation, the graphs show a slight non-linearity of the data, something like a “bounce” . I haven’t been able to fix this problem yet, perhaps this is either because of the large interval of data logging ( every 60 seconds ). Or just a certain error of sensors. If someone prompts the decision, I will be grateful. And for those who are especially attentive, you can see that the pressure measurement goes to “KWh”, this is because, oddly enough, I didn’t find a graph in Ninja Blocks to display pressure data. Therefore, for the "color" differentiation and simply visual perception, I used a graph of the display of power consumption. You can also see two graphs of the internal temperature. This is because BMP085 also has the ability to measure temperature, and I used it as a control sensor.
Let's say a few words about the code itself:
Working with the Ninja Blocks service itself from a code point of view is very easy and convenient.
First you need to create an account on the cloud. To do this, go to the address: "Ninja Blocks"
Create an account.
We now have a unique code, a “token,” for use in the code itself to identify our device.
It is worth adding that we need for Arduino Virtual Block Token .
Now we are going to write the code.
Initially, we specify the desired library when writing a sketch:
#include <NinjaBlockEthernet.h> Next, we register the connection with the server of the cloud Ninja Blocks :
NinjaBlock.host = "api.ninja.is"; NinjaBlock.port = 80; NinjaBlock.nodeID = "ETHERSHIELDBLOCK"; // - ; NinjaBlock.token = " ";// - ; NinjaBlock.guid = "0"; And then we specify which data to send and which schedule to use to display it.
On the example of temperature, it looks like this:
void loop() { float t1 = dht.readTemperature(); { NinjaBlock.deviceID=(31); // - ; NinjaBlock.send(t1); } A complete list of possible graphs and their description can be found here "List of graphs" . Alas, there is no graphic prompt. I personally, was looking for the required, brute force method.
I must also say that the chart specified in the code appears automatically in the “Dashboard” section:
In short, how to work with this service.
I did not give the final code, since It is no different than the original. If anyone is interested, I will send it.
The very same product, at the moment, has the following form:
Detailed photos of the case with vent. holes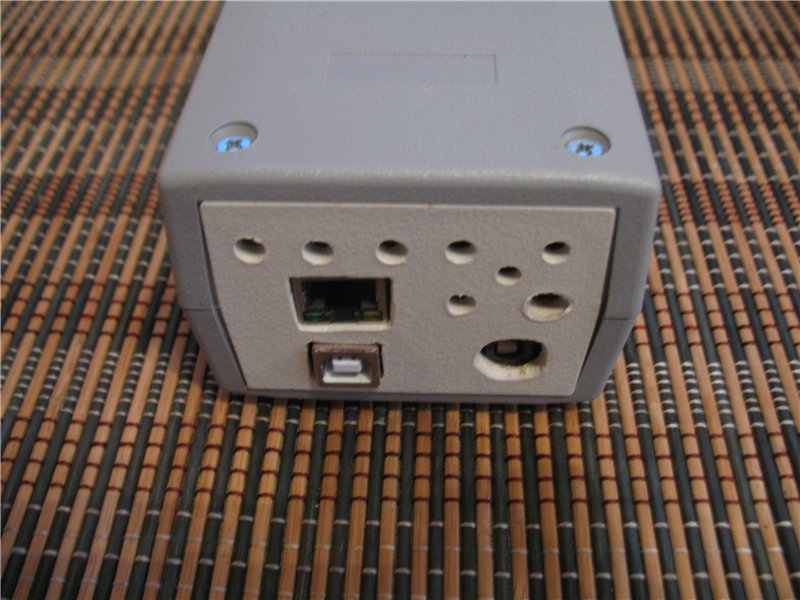
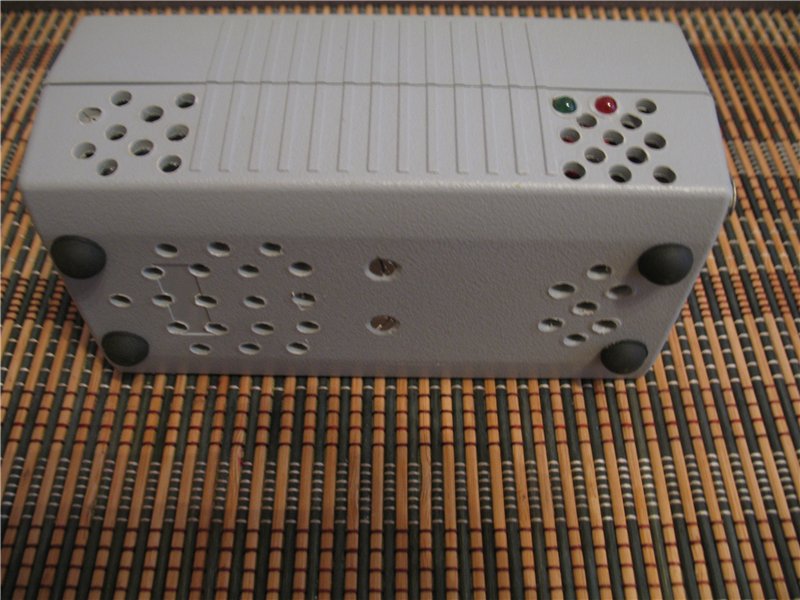
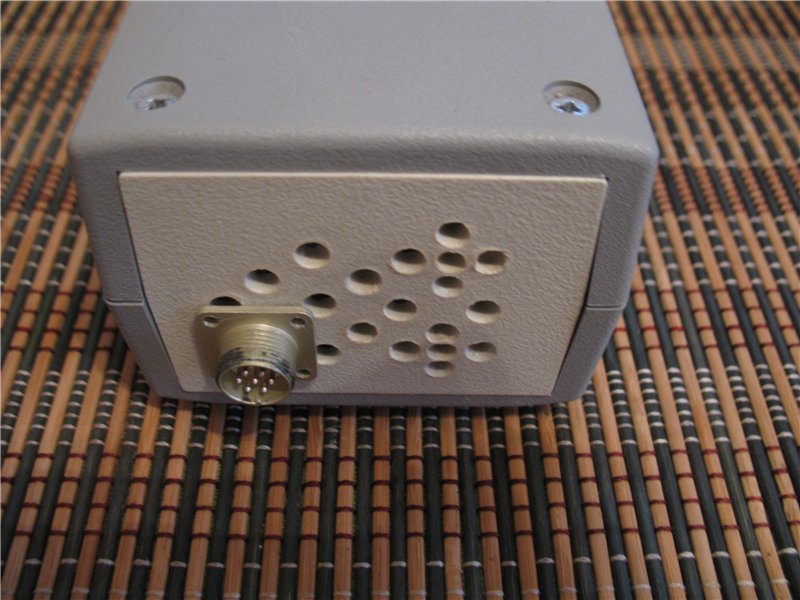

The station is framed in a full-fledged building, equipped with an external power supply in 5V. As you can see from the photo, there are two indicators for evaluating work, “green” - power , “red” - data transfer . At once I will say that everything was not going according to the principle of “factory” product, but according to the old Russian principle “I blinded you from what it was!” . But, however, there was still an attempt to
A little bit about the measurement parameters of the weather data itself
This is still a weather station and it would be wrong not to mention the ranges of its measured parameters.
Measurement of indoor parameters:
• Humidity measurement range 0% .. 100%
• Temperature measuring range -40 ~ + 80 ℃
Measurement of parameters outside the room:
• Humidity measurement range 0% .. 100%
• Temperature measuring range -40 ~ + 80 ℃
Measurement of air pressure parameters:
• Range of measured pressures, mbar 300 - 1100
More accurate parameters BMP085
- Absolute accuracy, mbar (at best / worst) ± 2.5 / ± 4.0
- Relative accuracy, mbar (at best / worst) ± 0.2 / ± 0.5
- Maximum resolution, mbar / m (pressure / height) 0.01
- Measured temperature range, ° 0 - 65
- Absolute accuracy, ° (at best / worst) ± 0.5 / ± 2.0
- Maximum resolution, ° 0.1
- Average current consumption (1 sample / s), µA (min / max) 3/12
I want to say a single word about the placement of the external sensor. Over his placement, I thought for a long time. Initially, the sensor huddled in a conventional installation box, next to the sensor from the "factory" weather station:
But it was temporary. Yes, and it looked pretty awful. As a result, a solution was found. And to accommodate the external sensor was created this "this" :
Yes, and why so many nuts 0_o? No, not as a counterweight, but just for the view))) Enough and one would be)
Now both sensors are adjacent in this way:
Who will be interested in the process of creating this miracle, home dubbed it just “herringbone” , then step by step photos in the archive in the application PHOTO ARCHIVE . Initially I apologize for the quality, the photo was taken in the process.
And yet, this “Christmas tree” at night has a rather aesthetic acid-green interior light! Which is perfectly visible from the ground. Well it is, more "lyrics" , for scaring away particularly impressionable neighbors)
In custody:
As a result, we have a full-fledged, not very expensive, fully functional weather station.
Which gives data on temperature and humidity inside and outside the room , as well as data on air pressure . Also, access to this data can be carried out from any device with Internet access thanks to the Ninja Blocks service.
What's next?!?
Now there are ideas to make the project more ambitious, to write a widget for the Android platform. Implement data accessibility not only for me, but for the rest of the residents of the district and the city as a whole. After all, the weather from a specific point is much more accurate than the weather from “gismeteo” or other resources that have global data.
Used materials:
"Ethernet weather station"
"Demonstration of the Wiren Board Smart Home"
PS
Anyone interested will be glad to answer all the questions. I can send the source code.
Source: https://habr.com/ru/post/243417/
All Articles