Setting up automatic restart of Windows services in Nagios XI
I think that it is not necessary to talk a lot about such a famous product as Nagios , many people use it. For those who have not heard, I inform: this is a monitoring system that can do many useful things besides this. Now I am actively studying this system and in this publication I will tell you how to simplify the work of the system administrator a little.
First I want to clarify: I mean that the organization already has a server with Nagios and is configured to monitor any sites and / or services. So, let's say there is a server named PrintServer , which often stops the spooler service. It is quite banal, but this is just an example, on the basis of which you can come up with a lot of useful. The first thing to do is set up monitoring of this service.
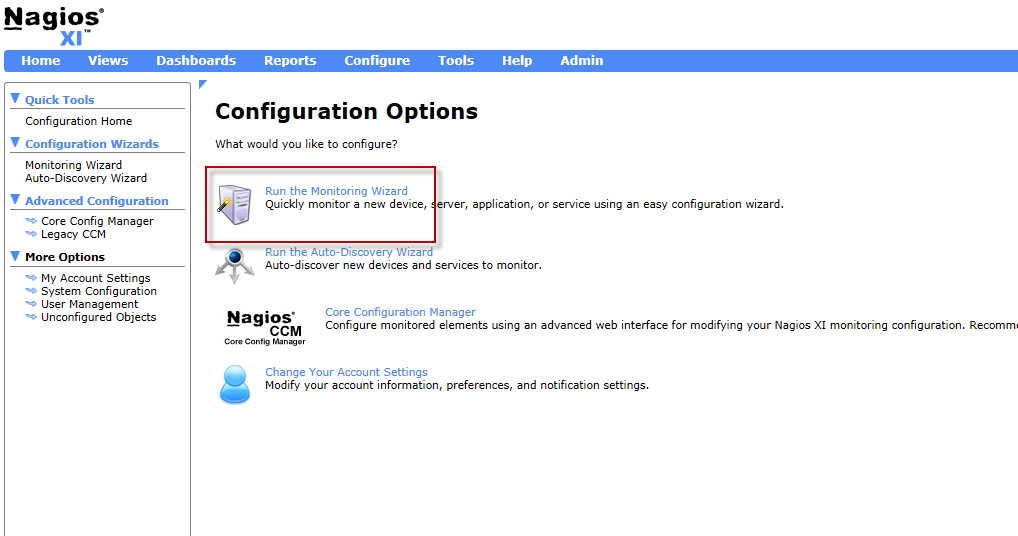
Go to the Nagios web interface under the administrator and select Configure at the top of the page. Next to add a new monitoring you need to run the Monitoring Wizard . Afterwards, I recommend that you start Core Config Manager (column on the left) for editing and adding new hosts, and for the first acquaintance it is better to use a wizard.
')
A wizard consists of a few simple steps that specify the necessary parameters.
1. Once this is a Windows service, you need to select Windows Server .
2. Enter the ip address.
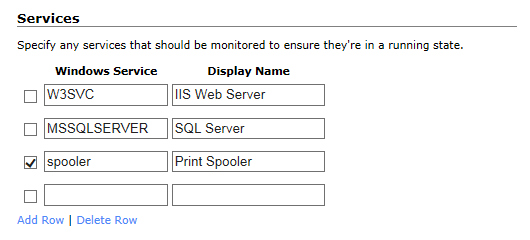
3. Here is more interesting. In the Windows Agent section , you can download (via a link from Nagios.com) the latest version of the Agent for Windows (it is installed on the client side) and enter the Agent's password. The password is set on the server side, and is configured on the client for the client-server interaction. Next section Server Metrics . Here you can configure various metrics for verification. I think everything is clear here, and, because You need to configure the service, in this section you need to remove all the daws. Next section Services . Here you need to register the necessary service for monitoring and put a check. In the Windows Service column , you need to specify the Service Name , this is important.
Next come the Processes and Performance Counters sections. In the future, they will most likely come in handy, but now you need to skip them and go to step 4.
4. Here you can set the frequency of checks in minutes and the time interval and the number of checks before Nagios generates an alert. These settings depend only on a specific task, therefore I will skip this section. Now you can click Finish and see the wizard report. If all three stages are successful, then this means that the service is created.

Next you need to select Core Config Manager in the left menu and below in the Monitoring section select Services . In this section, in the search we drive in Print Spooler and find the created config. Now Nagios monitors the status of the service. Then you can proceed to setting up the restart of the service on an event. To do this, you must first configure the client side. Go to the server and install the agent Nagios. After installation, go to the folder C: \ Program Files \ NSClient ++. Perhaps the path will be different, the main thing is to get into the program installation folder. We are looking for NSC.ini or nsclient.ini and open it for editing. Here you need to change a few parameters:
1. Uncomment the CheckExternalScripts.dll entry at the beginning of the file, removing the ";";
2. Uncomment allow_arguments and set parameter 1 instead of 0;
3. In the [External Scripts] section add the entry restart_svc = scripts \ restart_svc.bat “$ ARG1 $” .
Save the changes and bury the file. Further in this folder we find the Scripts folder and in it we create a bvnik svc_restart.bat with the following content:
echo off
Net stop% 1
Net start% 1
Exit 0
After this, you need to restart the NSClient ++ service so that it loads the changes in the .ini file. At this, the client setup is ready, it remains to configure the server.
The restart process looks like this:
1. The service stops and an event is generated in Nagios that the state of the Critical service;
2. The event handler runs the command configured for it;
3. The command runs a script located on the Nagios server;
4. The script transmits a command with arguments to NSClient ++;
5. NSClient ++ runs a script on the .bat client thatdestroys the earth and restarts the service.
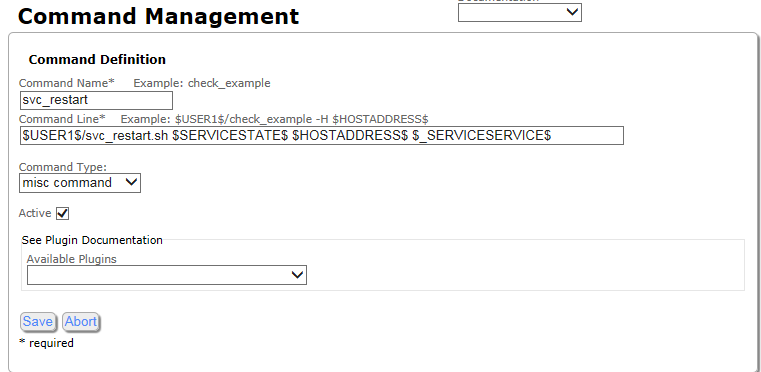
In principle, everything is simple. Now let's go in order. Service monitoring is configured, so an event will be created when the service is stopped. Before we go further, create a command for the event handler. Go to Configure => Core Config Manager => Commands . Create a new command using Add New and drive in the necessary parameters.
Command Name = svc_restart
Command Line = $ USER1 $ / svc_restart.sh $ SERVICESTATE $ $ HOSTADDRESS $ $ _SERVICESERVICE $
Command Type = misc command
And put the daw ACTIVE.
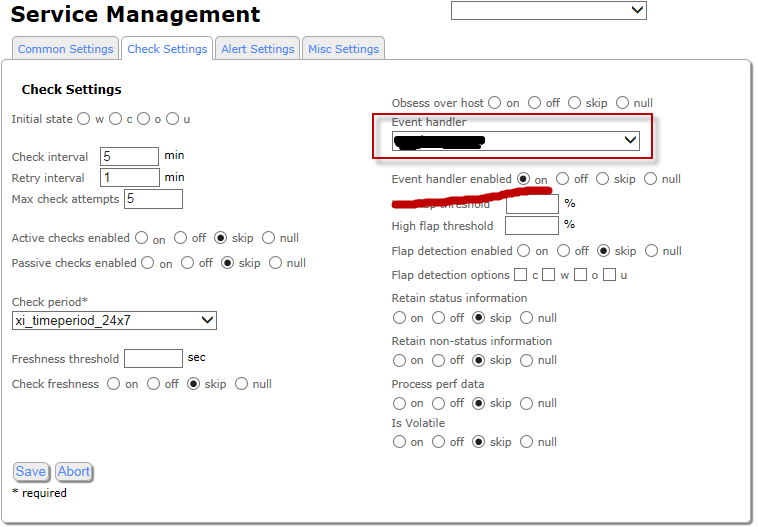
Team created, click Apply Configuration . Next, go to the Services section and open the created Print Spooler service. Here, in the Check Settings tab in the event handler (Event Handler), select the command (svc_restart), which starts when the event occurs and enable the handler itself.
Next, go to the tab Misc Settings and then Manage Variable Definitions . Here we fill:
Variable name = _SERVICE
Variable value = spooler
And click Insert and Close .
This completes the service setting, you can save and apply changes (Save & Apply Configuration). Now Nagios when stopping the service will run the svc_restart command, which in turn will launch svc_restart.sh with the required parameters. The problem is that there is no such script, and it needs to be created. The command will look for the script in a local folder with scripts and binaries on the server, so the next step is to log into the server on the console and go to the / usr / local / Nagios / libexec folder and use any convenient text editor (I used nano) to create a file svc_restart.sh with the following content:
1. #! / Bin / sh
2. # Event Handler for Restarting Windows Services
3. case "$ 1" in
4. OK)
five. ;;
6. WARNING)
7. ;;
8. UNKNOWN)
9. ;;
10. CRITICAL)
eleven.
12. / usr / local / nagios / libexec / check_nrpe -H "$ 2" -p 5666 –c svc_restart -a "$ 3"
13. ;;
14. esac
15.
16. exit 0
Now you need to change the permissions on this file with the following console commands:
chown nagios: nagios /usr/local/nagios/libexec/servicerestart.sh
chmod 775 /usr/local/nagios/libexec/servicerestart.sh
This completes the setup. If you do everything according to the instructions, there should be no problems. Finally, I will once again describe the mechanism of work and a bit of troubleshooting:
1. The service stops, the client sends to the server that it has the status of the Critical service;
2. The server creates an event with arguments hostname, servicename, servicestate;
3. The event handler executes the svc_restart command with the specified parameters;
4. The command starts svc_restart.sh with the necessary parameters;
5. Svc_restart.sh runs check_nrpe with the necessary parameters;
6. Check_nrpe sends to the client that it is necessary to execute svc_restart with the specified parameters;
7. The client in the ini file finds that the svc_restart is a bat file lying in the scripts;
8. Run the bat file with the specified parameters;
9. Bat file restarts the service.
If something does not work:
1. Try the bat file itself, if it works, then;
2. On the server, go to the console and try the following:
cd / usr / local / nagios / libexec
./check_nrpe -H -p 5666 -c svc_restart -a spooler
This command will check if the client command works on the client, if it works, then;
3. In the console, try
cd / usr / local / nagios / libexec
./svc_restart.sh CRITICAL spooler
This command will check the spelling of the svc_restart.sh script.
When writing was used manual Nagios from the official site. Unfortunately there are no links left, but I think they are easy to google on your own.
First I want to clarify: I mean that the organization already has a server with Nagios and is configured to monitor any sites and / or services. So, let's say there is a server named PrintServer , which often stops the spooler service. It is quite banal, but this is just an example, on the basis of which you can come up with a lot of useful. The first thing to do is set up monitoring of this service.
Go to the Nagios web interface under the administrator and select Configure at the top of the page. Next to add a new monitoring you need to run the Monitoring Wizard . Afterwards, I recommend that you start Core Config Manager (column on the left) for editing and adding new hosts, and for the first acquaintance it is better to use a wizard.
')
A wizard consists of a few simple steps that specify the necessary parameters.
1. Once this is a Windows service, you need to select Windows Server .
2. Enter the ip address.
3. Here is more interesting. In the Windows Agent section , you can download (via a link from Nagios.com) the latest version of the Agent for Windows (it is installed on the client side) and enter the Agent's password. The password is set on the server side, and is configured on the client for the client-server interaction. Next section Server Metrics . Here you can configure various metrics for verification. I think everything is clear here, and, because You need to configure the service, in this section you need to remove all the daws. Next section Services . Here you need to register the necessary service for monitoring and put a check. In the Windows Service column , you need to specify the Service Name , this is important.
Next come the Processes and Performance Counters sections. In the future, they will most likely come in handy, but now you need to skip them and go to step 4.
4. Here you can set the frequency of checks in minutes and the time interval and the number of checks before Nagios generates an alert. These settings depend only on a specific task, therefore I will skip this section. Now you can click Finish and see the wizard report. If all three stages are successful, then this means that the service is created.
Next you need to select Core Config Manager in the left menu and below in the Monitoring section select Services . In this section, in the search we drive in Print Spooler and find the created config. Now Nagios monitors the status of the service. Then you can proceed to setting up the restart of the service on an event. To do this, you must first configure the client side. Go to the server and install the agent Nagios. After installation, go to the folder C: \ Program Files \ NSClient ++. Perhaps the path will be different, the main thing is to get into the program installation folder. We are looking for NSC.ini or nsclient.ini and open it for editing. Here you need to change a few parameters:
1. Uncomment the CheckExternalScripts.dll entry at the beginning of the file, removing the ";";
2. Uncomment allow_arguments and set parameter 1 instead of 0;
3. In the [External Scripts] section add the entry restart_svc = scripts \ restart_svc.bat “$ ARG1 $” .
Save the changes and bury the file. Further in this folder we find the Scripts folder and in it we create a bvnik svc_restart.bat with the following content:
echo off
Net stop% 1
Net start% 1
Exit 0
After this, you need to restart the NSClient ++ service so that it loads the changes in the .ini file. At this, the client setup is ready, it remains to configure the server.
The restart process looks like this:
1. The service stops and an event is generated in Nagios that the state of the Critical service;
2. The event handler runs the command configured for it;
3. The command runs a script located on the Nagios server;
4. The script transmits a command with arguments to NSClient ++;
5. NSClient ++ runs a script on the .bat client that
In principle, everything is simple. Now let's go in order. Service monitoring is configured, so an event will be created when the service is stopped. Before we go further, create a command for the event handler. Go to Configure => Core Config Manager => Commands . Create a new command using Add New and drive in the necessary parameters.
Command Name = svc_restart
Command Line = $ USER1 $ / svc_restart.sh $ SERVICESTATE $ $ HOSTADDRESS $ $ _SERVICESERVICE $
Command Type = misc command
And put the daw ACTIVE.
Team created, click Apply Configuration . Next, go to the Services section and open the created Print Spooler service. Here, in the Check Settings tab in the event handler (Event Handler), select the command (svc_restart), which starts when the event occurs and enable the handler itself.
Next, go to the tab Misc Settings and then Manage Variable Definitions . Here we fill:
Variable name = _SERVICE
Variable value = spooler
And click Insert and Close .
This completes the service setting, you can save and apply changes (Save & Apply Configuration). Now Nagios when stopping the service will run the svc_restart command, which in turn will launch svc_restart.sh with the required parameters. The problem is that there is no such script, and it needs to be created. The command will look for the script in a local folder with scripts and binaries on the server, so the next step is to log into the server on the console and go to the / usr / local / Nagios / libexec folder and use any convenient text editor (I used nano) to create a file svc_restart.sh with the following content:
1. #! / Bin / sh
2. # Event Handler for Restarting Windows Services
3. case "$ 1" in
4. OK)
five. ;;
6. WARNING)
7. ;;
8. UNKNOWN)
9. ;;
10. CRITICAL)
eleven.
12. / usr / local / nagios / libexec / check_nrpe -H "$ 2" -p 5666 –c svc_restart -a "$ 3"
13. ;;
14. esac
15.
16. exit 0
Now you need to change the permissions on this file with the following console commands:
chown nagios: nagios /usr/local/nagios/libexec/servicerestart.sh
chmod 775 /usr/local/nagios/libexec/servicerestart.sh
This completes the setup. If you do everything according to the instructions, there should be no problems. Finally, I will once again describe the mechanism of work and a bit of troubleshooting:
1. The service stops, the client sends to the server that it has the status of the Critical service;
2. The server creates an event with arguments hostname, servicename, servicestate;
3. The event handler executes the svc_restart command with the specified parameters;
4. The command starts svc_restart.sh with the necessary parameters;
5. Svc_restart.sh runs check_nrpe with the necessary parameters;
6. Check_nrpe sends to the client that it is necessary to execute svc_restart with the specified parameters;
7. The client in the ini file finds that the svc_restart is a bat file lying in the scripts;
8. Run the bat file with the specified parameters;
9. Bat file restarts the service.
If something does not work:
1. Try the bat file itself, if it works, then;
2. On the server, go to the console and try the following:
cd / usr / local / nagios / libexec
./check_nrpe -H -p 5666 -c svc_restart -a spooler
This command will check if the client command works on the client, if it works, then;
3. In the console, try
cd / usr / local / nagios / libexec
./svc_restart.sh CRITICAL spooler
This command will check the spelling of the svc_restart.sh script.
When writing was used manual Nagios from the official site. Unfortunately there are no links left, but I think they are easy to google on your own.
Source: https://habr.com/ru/post/243227/
All Articles