NetApp FAS performance optimization
In this article, I will focus on optimizing the performance of NetApp FAS systems.
Optimization objects in terms of storage can be settings:

For a bottleneck search, a sequential exception technique is usually performed. I suggest first thing to start with the storage system . And move on to the storage system -> Network ( Ethernet / FC) -> Host ( Windows / Linux / VMware ESXi 5.X and ESXi 6.X ) -> Application.
')
I recall the paradigm of the device's internal structure of the NetApp FAS storage system , according to the “share nothing” ideology, which is almost always respected by FAS systems: Disks are combined into a Raid group ( RAID-DP ), Raid groups are combined into a Plex (Plex. analogue of RAID1), both Plexes are combined in Aggregate , FlexVol are created on Aggregate, FlexVol data is evenly spread across all disks in Aggregate, Qtree are created in FlexVol (something like folders to which any quotas can be assigned), Qtree cannot to be nested, then LUNs are created inside Qtree.
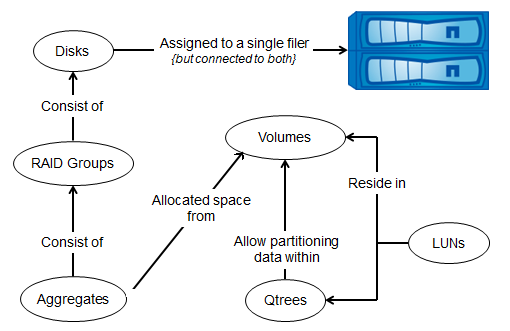
NetApp FAS storage objects
At one time, one disk can belong to only one controller; this is the most basic need of DataONTAP, deeply embedded in the bowels of the OS. It is only necessary to note that the disk for DataONTAP can actually be both a disk as a whole and a partition (partition). In other words, one such object (the entire disk or its partition) always has ownership, only one controller in the HA pair. Thus, there is a nuance to which one can now disregard for simplicity of the picture: in the second case, all the same, a single physical disk can have several partitions whose ownership is assigned and used, for some partitions by one controller, for other partitions by another controller couples.
So at one time, “disks” (in terms of DataONTAP), the moon, volyum, and aggregates belong to only one controller. Access to this moon can nevertheless be accomplished through a partner in the HA pair or in general through other nodes of the cluster. But the best way to such a moon will always be only those that pass through the ports of the controller that owns the disks on which the moon is located -> volyum-> aggregate. If there is more than one port on the controller, then all these ports are the best ways to the moon which is located on this controller. The use of all possible optimal paths to the moon through all ports on the controller, as a rule, is positively related to the speed of access to it. The host can use all the optimal paths at the same time or only a part of the optimal paths, it depends on the multipassing settings in the OS of the host and the portset settings on the storage.
The same applies to all other protocols for FAS systems in Cluster-Mode - the best ways are those that pass through the ports of the controller on which the data is actually located. In 7-Mode, there is simply no access to the data through non-optimal paths for the CIFS / iSCSI / NFS protocols.
Thus, it is necessary to ensure that the paths to the Front-End are always optimal for all storage access protocols.
So in the case of FC / FCoE / iSCSI protocols , the ALUA mechanism helps to clarify this issue, explaining to hosts where the optimal paths are and where not, and the correct multipaging settings ensure that only optimal paths are used in normal operation.
For the NFS protocol, the issue of using optimal paths is resolved in pNFS , which support is already implemented in RedHat Linux . That allows the client to understand and switch to the optimal path automatically without additional settings. For the VMware ESXi 6.0 virtualization environment with the NFS v3.0 protocol, the issue of optimal paths is implemented using vVol technology, which is supported on NetApp FAS with ClusteredONTAP.
For the CIFS (SMB) protocol in version 3.0, the SMB Auto Location mechanism is implemented, which allows, like pNFS, to switch to the optimal path to the file sphere.
When using NetApp FAS in 7-Mode and Cluster-Mode on FC / FCoE, you must enable ALUA . The settings for iSCSI for 7-Mode and Cluster-Mode are different, so for the first case the ALUA mode can not be enabled, and for the second one is required.
Multipathing should by default use the preferred paths - paths to the LUN through the ports of the controller on which it is located. Messages in the console FCP Partner Path Misconfigured will talk about incorrectly configured ALUA or MPIO . This is an important parameter; you should not ignore it, since there was one real case where the enraged host multipassing driver continuously switched between paths, thus creating large queues in the I / O system.
With a SAN cluster size of 8 nodes (4 ON pairs) of FAS systems, the number of access paths (and therefore ports on the controllers) to the moon can reach unimaginable quantities. The number of nodes in the cluster will only grow; at the same time, for frequent, you can limit yourself to a completely reasonable number of main and alternate paths without sacrificing fault tolerance. So a portset comes to the rescue of this issue, allowing “to see” moons only on specified ports. Therefore, the storage ports through which your moons are visible should be switched and configured on the switch, plus the zoning should be configured accordingly.
Starting from DataONTAP 8.3, the default SLM method is applied, reducing the number of paths to the moon to two controllers: the owner of the moon and its partner in the HA pair. When migrating the moon using the SLM mechanism to another node of the cluster, no additional manipulation is required from the administrator to specify the ports through which the moons will be available, everything happens automatically. We need to make sure that the WWPN of our LIF storage interfaces, on which migrated moons will be available, are added to the required zone on the switches. It is recommended to immediately register all possible WWPNs of all the nodes of the cluster into the corresponding zones, and the SLM mechanism will take care that the ways to the moon are “not adequately large”. More details .
In the case of online migration, it is necessary, on the nodes that accept the migrating moon, to allow the hosts to be told to the multipathing drivers that the moon is now accessible via new, additional ways.
Learn more about NetApp + VMWare troubleshooting with SAN . Learn more about zoning recommendations for NetApp in pictures .
Starting with Data Ontap 8.2.1, DCB (Lossless) Ethernet is supported on all converged ( CNA / UTA ) ports of NetApp FAS storage. Recommendations for setting up an Ethernet network .
In the case of the use of the "file" protocols NFS and CIFS, it is very easy to take advantage of the use of the technology of Thin Provitioning, returning the freed up space inside the file balls. But in the case of SAN, the use of ThinProvitioning leads to the need for constant control over free space plus free space release ( SCSI-3 mechanism is available for modern OS and is available in Data Ontap starting from version 8.1.3) not “inside” the same LUN , And as if inside the Volume containing this LUN .
In the case when there are 10 GBE connections and Oracle databases , it is highly recommended to consider connectivity using the dNFS protocol, as according to NetApp internal tests (for other storage vendors this situation may differ), performance and latency are the same or slightly better than FC 8G. OLTP load. NFS is also very convenient for virtualization, when there is one big datastor with all virtual machines that all hosts “see”, facilitating migration between hosts, easier maintenance and setting up the network infrastructure, unlike zoning in SAN networks.
It is also very convenient to create thick virtual machine disks (following the best VMWare practices for high-loaded environments) while having Thin (from the storage point of view) datastor NFS given at the same time having both performance and economy, and not a compromise between the two. Using one datastor allows you to more rationally allocate free space, giving it to those virtual machines that need it more, taking space savings to a new level, rather than rigidly fixing “how many”, as it happens in FC and iSCSI . At the same time, the free space freed for example by block deduplication or relocation "returns" this space and can be used by the same NFS / CIFS ball.
The Linux showmount -e command is supported starting with cDOT 8.3. in order for the showmount -e command to discover NFS, you need to enable this feature on the storage side:
When using MS Windows, it is possible to use iSCSI MCS allowing to use several TCP connections within one iSCSI session. The combination of MPIO with MCS can give a significant performance boost.
Throughput in MB / s with different number of sessions / TCP connections for MCS / MPIO and 10 GBE for Windows 2008 R2 and FAS 3070
The new version of CIFS (SMB) 3.0 allows you to use this protocol not only for the purposes of the file garbage bin, but also reveals new features for use on MS SQL databases and virtual machines with MS Hyper-V.
Continuous availability shares (CA) extend protocol capabilities. In previous versions, clients were forced to reconnect to the repository in case of fail -over or moving the LIF to another port. Now with the CA mechanism, the files will be available without interrupting the service for a short time without connection during a fail-over or LIF move.
For the most optimal utilization of all cores of the storage CPUs, use no less than 8 volums, this will improve parallelization, their utilization and, as a result, operation speed.
The perfstat utility that collects the load on the storage in a text file. It can also simultaneously collect information on the load from the host on which the utility is running. Download from the site support.netapp.com section Download - Utility ToolChest (You need a NetApp NOW ID to enter). It is very important to collect statistics from the storage system at the moment of load, as it often happens that the host is not able to provide sufficient load on the storage system , as can be seen from the perfstat log, in this case you will need to use several hosts.
Using this utility, you can track the total load on the storage system from all hosts, including problems on the storage side, for example, when a damaged disk slows down the entire system on the Back-End and, as a result, on the Front-End .
By comparing the test results from the host and the storage system, you can find a bottleneck in the system under test. So, following the output of the perfstat command below, it is clear that the storage system is not sufficiently loaded ( CPU , Disk Usage and Total parameters) using FC . Most of the operations on this system are done in the form of reading the contents of the cache (the Cache hit value). From what we conclude, the host cannot load the storage system enough.
Decryption parameter Cache age, Cache hit, CP ty . A little more about optimizing performance and finding a bottleneck .
Host FS can make significant adjustments when testing performance.
The size of the FS block should be a multiple of 4KB. For example, if we run a synthetic load similar to the generated OLTP , where the size of the operated block is on average 8KB, then we put 8KB. I also want to note that as a file system itself, its implementation for a specific OS and version can greatly influence the overall performance picture. So for when writing 10 MB blocks in 100 streams with the dd file command from the database on the UFS file system located on the LUN , the FC 4G with FAS 2240 data storage and 21 + 2 SAS 600 10k disks in one unit showed a speed of 150 MB / s, while however, the ZFS configuration showed two times more FS (approaching the theoretical maximum of the network channel), and the Noatime parameter didn’t affect the situation at all.
Also, the same parameter must be set on the storage partition with the data that is being accessed. Enabling this option prevents updating the file access time in WAFL inodes. Thus, the following command is applicable for SMB CIFS / NFS file balls .
For any OS, you need to select the correct geometry when creating a LUN . In the case of an incorrectly specified size of the FS block, an incorrectly specified LUN geometry, the MBR / GPT parameter that is not correctly selected on the host, we will observe, in peak loads, messages in the console about a certain " LUN misalignment" event. Sometimes these messages may appear erroneously, in the case of their rare appearance just ignore them. You can check this by running the lun stats command on the storage system, below is an example of output, pay attention to align_histo.1: 100% and write_align_histo.1: 97%, so it should not be in a normally configured system - the block should start with "0" in the parameters "Align_histo".
misalignment can also occur in a virtualization environment, on “shared datastors” with VMFS , which can lead to degradation of system performance. In this case, there are two options for resolving the problem of an existing virtual machine — through the NetApp VSC plugin for vCenter, the virtual machine (Storage vMoution) is migrated to a new datastore (with correctly set LUN geometry) or manually using the MBRalign command line utility to align the block boundaries in vmdk file. I want to note that the manual mode will most likely make the virtual machine OS loader not working and will need to be restored. See the Best Practices for File System alignment in Virtual Environments document for more details. Learn more about what I / O Misalignment is and how to fix it .
It is imperative to check that all data is smeared across all disks, for example after adding disks to an already created unit . To check the state of "blurring" of the data on the disks on disks, run on 7-Mode:
on Custered ONTAP:
Let's see an example of the output of such a command:
A value of 12, greater than threshold 4, indicates that a relocation must be started on the volume. The hotspot 5 value indicates that the hot blocks are located on 5 disks, and not on all disks of the unit (if it is not eliminated by simple realocation, look here ).
Insufficient free space and the presence of snapshots may not allow realization . On a volume, you need to have not less than 5% free space in the active file system and 10% free space in SnapReserve.
In the case of adding new disks, it makes sense to unbalance not only data but also empty blocks.
Run the physical relocation of the volume data to optimize performance on 7-Mode
On Clustered ONTAP. For Clustered ONTAP, the reallocate command will not return the output, you need to request it:
During the test it is very important to make sure that one of the disks did not die and / or the whole unit does not slow down.
We see that our aggregate consists of two RAID groups - rg0 and rg1 , in the configuration RAID-DP 11d + 2p . Discs 0c.16, 1b.17 and 0c.29, 0c.33 are parity disks, the rest are Data.
When data drives are not evenly loaded
In the output of the statit / statistics command, we are looking for weirdness. The value of the use of disks 0s.25, 26 and 28 , compared with other data-disks (for parity disks, other rules apply, we do not look at them). With an average load of ut% on disks of a group of 35%, on these disks the load is almost twice as high , about 75% plus their high latency values ( ureads usecs and write usecs ), compared to other disks, which reaches 60-70 milliseconds, against 14-17 for the rest. In a normally operating aggregate, the load should be evenly distributed across all data disks in the aggregate. It is necessary to reduce the load on the unit by relocation or to replace such discs.
For 7-Mode:
For C-Mode:
Make sure there is no gag on the CPU or in the cache and check the load on the protocols:
Read more about optimization and verification of the disk subsystem here .
, , , SyncMirror (MetroCluster) .
Clustered ONTAP
Virtual Storage Tiering (VST) — . FlashCache — PCIe, . FlashPool — (SAS/SATA HDD) SSD RAID (), , ( , .. ). , , :
.
, .
Comments on errors in the text and suggestions please send to the LAN .
Optimization objects in terms of storage can be settings:
- SAN in storage
- Ethernet to storage
- NAS in storage
- Disk subsystem on the Back-End storage system
- Disk Subsystem on Front-End DSS
- Firmware compatibility check
- Boosters
For a bottleneck search, a sequential exception technique is usually performed. I suggest first thing to start with the storage system . And move on to the storage system -> Network ( Ethernet / FC) -> Host ( Windows / Linux / VMware ESXi 5.X and ESXi 6.X ) -> Application.
')
A brief educational program on NetApp:
I recall the paradigm of the device's internal structure of the NetApp FAS storage system , according to the “share nothing” ideology, which is almost always respected by FAS systems: Disks are combined into a Raid group ( RAID-DP ), Raid groups are combined into a Plex (Plex. analogue of RAID1), both Plexes are combined in Aggregate , FlexVol are created on Aggregate, FlexVol data is evenly spread across all disks in Aggregate, Qtree are created in FlexVol (something like folders to which any quotas can be assigned), Qtree cannot to be nested, then LUNs are created inside Qtree.
NetApp FAS storage objects
At one time, one disk can belong to only one controller; this is the most basic need of DataONTAP, deeply embedded in the bowels of the OS. It is only necessary to note that the disk for DataONTAP can actually be both a disk as a whole and a partition (partition). In other words, one such object (the entire disk or its partition) always has ownership, only one controller in the HA pair. Thus, there is a nuance to which one can now disregard for simplicity of the picture: in the second case, all the same, a single physical disk can have several partitions whose ownership is assigned and used, for some partitions by one controller, for other partitions by another controller couples.
So at one time, “disks” (in terms of DataONTAP), the moon, volyum, and aggregates belong to only one controller. Access to this moon can nevertheless be accomplished through a partner in the HA pair or in general through other nodes of the cluster. But the best way to such a moon will always be only those that pass through the ports of the controller that owns the disks on which the moon is located -> volyum-> aggregate. If there is more than one port on the controller, then all these ports are the best ways to the moon which is located on this controller. The use of all possible optimal paths to the moon through all ports on the controller, as a rule, is positively related to the speed of access to it. The host can use all the optimal paths at the same time or only a part of the optimal paths, it depends on the multipassing settings in the OS of the host and the portset settings on the storage.
The same applies to all other protocols for FAS systems in Cluster-Mode - the best ways are those that pass through the ports of the controller on which the data is actually located. In 7-Mode, there is simply no access to the data through non-optimal paths for the CIFS / iSCSI / NFS protocols.
Thus, it is necessary to ensure that the paths to the Front-End are always optimal for all storage access protocols.
So in the case of FC / FCoE / iSCSI protocols , the ALUA mechanism helps to clarify this issue, explaining to hosts where the optimal paths are and where not, and the correct multipaging settings ensure that only optimal paths are used in normal operation.
For the NFS protocol, the issue of using optimal paths is resolved in pNFS , which support is already implemented in RedHat Linux . That allows the client to understand and switch to the optimal path automatically without additional settings. For the VMware ESXi 6.0 virtualization environment with the NFS v3.0 protocol, the issue of optimal paths is implemented using vVol technology, which is supported on NetApp FAS with ClusteredONTAP.
For the CIFS (SMB) protocol in version 3.0, the SMB Auto Location mechanism is implemented, which allows, like pNFS, to switch to the optimal path to the file sphere.
SAN Multipathing
When using NetApp FAS in 7-Mode and Cluster-Mode on FC / FCoE, you must enable ALUA . The settings for iSCSI for 7-Mode and Cluster-Mode are different, so for the first case the ALUA mode can not be enabled, and for the second one is required.
Multipathing should by default use the preferred paths - paths to the LUN through the ports of the controller on which it is located. Messages in the console FCP Partner Path Misconfigured will talk about incorrectly configured ALUA or MPIO . This is an important parameter; you should not ignore it, since there was one real case where the enraged host multipassing driver continuously switched between paths, thus creating large queues in the I / O system.
Portset
With a SAN cluster size of 8 nodes (4 ON pairs) of FAS systems, the number of access paths (and therefore ports on the controllers) to the moon can reach unimaginable quantities. The number of nodes in the cluster will only grow; at the same time, for frequent, you can limit yourself to a completely reasonable number of main and alternate paths without sacrificing fault tolerance. So a portset comes to the rescue of this issue, allowing “to see” moons only on specified ports. Therefore, the storage ports through which your moons are visible should be switched and configured on the switch, plus the zoning should be configured accordingly.
Selective LUN Map
Starting from DataONTAP 8.3, the default SLM method is applied, reducing the number of paths to the moon to two controllers: the owner of the moon and its partner in the HA pair. When migrating the moon using the SLM mechanism to another node of the cluster, no additional manipulation is required from the administrator to specify the ports through which the moons will be available, everything happens automatically. We need to make sure that the WWPN of our LIF storage interfaces, on which migrated moons will be available, are added to the required zone on the switches. It is recommended to immediately register all possible WWPNs of all the nodes of the cluster into the corresponding zones, and the SLM mechanism will take care that the ways to the moon are “not adequately large”. More details .
Online Migration and SLM
In the case of online migration, it is necessary, on the nodes that accept the migrating moon, to allow the hosts to be told to the multipathing drivers that the moon is now accessible via new, additional ways.
Zoning
Learn more about NetApp + VMWare troubleshooting with SAN . Learn more about zoning recommendations for NetApp in pictures .
Ethernet
Starting with Data Ontap 8.2.1, DCB (Lossless) Ethernet is supported on all converged ( CNA / UTA ) ports of NetApp FAS storage. Recommendations for setting up an Ethernet network .
Thin provisioning
In the case of the use of the "file" protocols NFS and CIFS, it is very easy to take advantage of the use of the technology of Thin Provitioning, returning the freed up space inside the file balls. But in the case of SAN, the use of ThinProvitioning leads to the need for constant control over free space plus free space release ( SCSI-3 mechanism is available for modern OS and is available in Data Ontap starting from version 8.1.3) not “inside” the same LUN , And as if inside the Volume containing this LUN .
Nfs
In the case when there are 10 GBE connections and Oracle databases , it is highly recommended to consider connectivity using the dNFS protocol, as according to NetApp internal tests (for other storage vendors this situation may differ), performance and latency are the same or slightly better than FC 8G. OLTP load. NFS is also very convenient for virtualization, when there is one big datastor with all virtual machines that all hosts “see”, facilitating migration between hosts, easier maintenance and setting up the network infrastructure, unlike zoning in SAN networks.
It is also very convenient to create thick virtual machine disks (following the best VMWare practices for high-loaded environments) while having Thin (from the storage point of view) datastor NFS given at the same time having both performance and economy, and not a compromise between the two. Using one datastor allows you to more rationally allocate free space, giving it to those virtual machines that need it more, taking space savings to a new level, rather than rigidly fixing “how many”, as it happens in FC and iSCSI . At the same time, the free space freed for example by block deduplication or relocation "returns" this space and can be used by the same NFS / CIFS ball.
Showmount
The Linux showmount -e command is supported starting with cDOT 8.3. in order for the showmount -e command to discover NFS, you need to enable this feature on the storage side:
nfs server modify -vserver * -showmount enabled iSCSI
When using MS Windows, it is possible to use iSCSI MCS allowing to use several TCP connections within one iSCSI session. The combination of MPIO with MCS can give a significant performance boost.
Throughput in MB / s with different number of sessions / TCP connections for MCS / MPIO and 10 GBE for Windows 2008 R2 and FAS 3070
| Number of connections | SQLIO NTFS MCS | SQLIO NTFS MPIO |
| one | 481 | 481 |
| 2 | 796 | 714 |
| 3 | 893 | 792 |
| four | 1012 | 890 |
| five | 944 | 852 |
| 6 | 906 | 902 |
| 7 | 945 | 961 |
| eight | 903 | 911 |
CIFS
The new version of CIFS (SMB) 3.0 allows you to use this protocol not only for the purposes of the file garbage bin, but also reveals new features for use on MS SQL databases and virtual machines with MS Hyper-V.
Continuous availability shares (CA) extend protocol capabilities. In previous versions, clients were forced to reconnect to the repository in case of fail -over or moving the LIF to another port. Now with the CA mechanism, the files will be available without interrupting the service for a short time without connection during a fail-over or LIF move.
VMWare VAAI & NFS
NetApp supports VAAI primitives for VMWare ESXi with the NFS protocol, allowing you to download "routine tasks" from the host to the storage system . Requires installation of NFS VAAI plug-in for each ESXi host (no plug-in required for FC ).CPU storage
For the most optimal utilization of all cores of the storage CPUs, use no less than 8 volums, this will improve parallelization, their utilization and, as a result, operation speed.
PerfStat
The perfstat utility that collects the load on the storage in a text file. It can also simultaneously collect information on the load from the host on which the utility is running. Download from the site support.netapp.com section Download - Utility ToolChest (You need a NetApp NOW ID to enter). It is very important to collect statistics from the storage system at the moment of load, as it often happens that the host is not able to provide sufficient load on the storage system , as can be seen from the perfstat log, in this case you will need to use several hosts.
perfstat7.exe -f 192.168.0.10,192.168.0.12 -t 2 -i 3,0 -l root -S pw:123456 -F -I -w 1 >"20140114_1311.out" Using this utility, you can track the total load on the storage system from all hosts, including problems on the storage side, for example, when a damaged disk slows down the entire system on the Back-End and, as a result, on the Front-End .
Perfstat output interpretation
By comparing the test results from the host and the storage system, you can find a bottleneck in the system under test. So, following the output of the perfstat command below, it is clear that the storage system is not sufficiently loaded ( CPU , Disk Usage and Total parameters) using FC . Most of the operations on this system are done in the form of reading the contents of the cache (the Cache hit value). From what we conclude, the host cannot load the storage system enough.
perfstat.out
Open text file .
=-=-=-=-=-= PERF 192.168.0.12 POSTSTATS =-=-=-=-=-= Begin: Wed Jan 15 07:16:45 GMT 2014 CPU NFS CIFS HTTP Total Net kB/s Disk kB/s Tape kB/s Cache Cache CP CP Disk OTHER FCP iSCSI FCP kB/s iSCSI kB/s in out read write read write age hit time ty util in out in out 8% 0 0 0 227 1 1 2307 24174 0 0 8 89% 11% : 22% 3 224 0 12401 852 0 0 12% 0 0 0 191 1 5 3052 24026 0 0 6s 90% 14% F 27% 1 190 0 21485 864 0 0 18% 0 0 0 517 0 1 5303 46467 0 0 0s 90% 33% 2 38% 1 516 0 23630 880 0 0 15% 0 0 0 314 1 2 4667 24287 0 0 0s 91% 15% F 33% 27 287 0 27759 853 0 0 12% 0 0 0 252 0 1 3425 24601 0 0 9 91% 16% F 28% 20 232 0 22280 852 0 0 24% 0 0 0 1472 2 5 9386 46919 0 0 1s 82% 34% F 47% 9 1463 0 26141 673 0 0 14% 0 0 0 303 1 3 3970 24527 0 0 8s 90% 27% F 33% 1 302 0 22810 967 0 0 14% 0 0 0 299 2 6 3862 24776 0 0 0s 91% 21% F 29% 1 298 0 21981 746 0 0 13% 0 0 0 237 1 3 4608 24348 0 0 9 94% 15% F 30% 1 236 0 22721 958 0 0 17% 0 0 0 306 1 2 5603 48072 0 0 2s 92% 32% F 37% 1 305 0 22232 792 0 0 13% 0 0 0 246 0 1 3208 24278 0 0 8s 92% 14% F 26% 20 226 0 24137 598 0 0 -- Summary Statistics ( 11 samples 1.0 secs/sample) CPU NFS CIFS HTTP Total Net kB/s Disk kB/s Tape kB/s Cache Cache CP CP Disk OTHER FCP iSCSI FCP kB/s iSCSI kB/s in out read write read write age hit time ty util in out in out Min 8% 0 0 0 191 0 1 2307 24026 0 0 0s 82% 11% * 22% 0 190 0 0 0 0 0 Avg 14% 0 0 0 396 0 2 4490 30588 0 0 2 90% 21% * 31% 7 389 0 22507 821 0 0 Max 24% 0 0 0 1472 2 6 9386 48072 0 0 9 94% 34% * 47% 27 1463 0 27759 967 0 0 Begin: Wed Jan 15 07:18:36 GMT 2014 Decryption parameter Cache age, Cache hit, CP ty . A little more about optimizing performance and finding a bottleneck .
File system
Host FS can make significant adjustments when testing performance.
The size of the FS block should be a multiple of 4KB. For example, if we run a synthetic load similar to the generated OLTP , where the size of the operated block is on average 8KB, then we put 8KB. I also want to note that as a file system itself, its implementation for a specific OS and version can greatly influence the overall performance picture. So for when writing 10 MB blocks in 100 streams with the dd file command from the database on the UFS file system located on the LUN , the FC 4G with FAS 2240 data storage and 21 + 2 SAS 600 10k disks in one unit showed a speed of 150 MB / s, while however, the ZFS configuration showed two times more FS (approaching the theoretical maximum of the network channel), and the Noatime parameter didn’t affect the situation at all.
Noatime for file balloon on storage
Also, the same parameter must be set on the storage partition with the data that is being accessed. Enabling this option prevents updating the file access time in WAFL inodes. Thus, the following command is applicable for SMB CIFS / NFS file balls .
vol options vol1 no_atime_update on Misalignment
For any OS, you need to select the correct geometry when creating a LUN . In the case of an incorrectly specified size of the FS block, an incorrectly specified LUN geometry, the MBR / GPT parameter that is not correctly selected on the host, we will observe, in peak loads, messages in the console about a certain " LUN misalignment" event. Sometimes these messages may appear erroneously, in the case of their rare appearance just ignore them. You can check this by running the lun stats command on the storage system, below is an example of output, pay attention to align_histo.1: 100% and write_align_histo.1: 97%, so it should not be in a normally configured system - the block should start with "0" in the parameters "Align_histo".
TR-3593
There are no alignment. Using perfstat counters, under the wafl_susp section, “wp.partial_writes“, “pw.over_limit“, and “pw.async_read“ are indicators of improper alignment. The “wp.partial write“ is the block counter of unaligned I / O. WAFL will launch a background read. These are counted in “pw.async_read“; "Pw.over_limit"
Using Data ONTAP 7.2.1 or newer, I / O alignment:
Read / write_align_histo [0] is nonzero, you had some misaligned I / O.
Using Data ONTAP 7.2.1 or newer, I / O alignment:
- luna: read_align_histo: 8b WAFL block an I / O was. Reported as a% of reads.
- lun: write_align_histo: Same for writes.
- lun: read_partial_blocks:% reads that are not a multiple of 4k.
- lun: write_partial_blocks: same for writes.
Read / write_align_histo [0] is nonzero, you had some misaligned I / O.
lun stats for 7-Mode
priv set -q advanced; lun show -v lun status lun:/vol/vol0/drew_smi-W9mAeJb3vzGS:display_name:/vol/vol0/drew_smi lun:/vol/vol0/drew_smi-W9mAeJb3vzGS:read_ops:1/s lun:/vol/vol0/drew_smi-W9mAeJb3vzGS:write_ops:26/s lun:/vol/vol0/drew_smi-W9mAeJb3vzGS:other_ops:0/s lun:/vol/vol0/drew_smi-W9mAeJb3vzGS:read_data:10758b/s lun:/vol/vol0/drew_smi-W9mAeJb3vzGS:write_data:21997484b/s lun:/vol/vol0/drew_smi-W9mAeJb3vzGS:queue_full:0/s lun:/vol/vol0/drew_smi-W9mAeJb3vzGS:avg_latency:290.19ms lun:/vol/vol0/drew_smi-W9mAeJb3vzGS:total_ops:27/s lun:/vol/vol0/drew_smi-W9mAeJb3vzGS:scsi_partner_ops:0/s lun:/vol/vol0/drew_smi-W9mAeJb3vzGS:scsi_partner_data:0b/s lun:/vol/vol0/drew_smi-W9mAeJb3vzGS:read_align_histo.0:0% lun:/vol/vol0/drew_smi-W9mAeJb3vzGS:read_align_histo.1:100% lun:/vol/vol0/drew_smi-W9mAeJb3vzGS:read_align_histo.2:0% lun:/vol/vol0/drew_smi-W9mAeJb3vzGS:read_align_histo.3:0% lun:/vol/vol0/drew_smi-W9mAeJb3vzGS:read_align_histo.4:0% lun:/vol/vol0/drew_smi-W9mAeJb3vzGS:read_align_histo.5:0% lun:/vol/vol0/drew_smi-W9mAeJb3vzGS:read_align_histo.6:0% lun:/vol/vol0/drew_smi-W9mAeJb3vzGS:read_align_histo.7:0% lun:/vol/vol0/drew_smi-W9mAeJb3vzGS:write_align_histo.0:0% lun:/vol/vol0/drew_smi-W9mAeJb3vzGS:write_align_histo.1:97% lun:/vol/vol0/drew_smi-W9mAeJb3vzGS:write_align_histo.2:0% lun:/vol/vol0/drew_smi-W9mAeJb3vzGS:write_align_histo.3:1% lun:/vol/vol0/drew_smi-W9mAeJb3vzGS:write_align_histo.4:0% lun:/vol/vol0/drew_smi-W9mAeJb3vzGS:write_align_histo.5:0% lun:/vol/vol0/drew_smi-W9mAeJb3vzGS:write_align_histo.6:0% lun:/vol/vol0/drew_smi-W9mAeJb3vzGS:write_align_histo.7:0% lun:/vol/vol0/drew_smi-W9mAeJb3vzGS:read_partial_blocks:0% lun:/vol/vol0/drew_smi-W9mAeJb3vzGS:write_partial_blocks:1% lun show for Cluster-Mode
cl1::*> set -privilege advanced; lun show -vserver <your_vserver> -path <your_path_to_the_lun> Vserver Name: vs_infra LUN Path: /vol/vol_infra_10/qtree_1/lun_10 Volume Name: vol_infra_10 Qtree Name: qtree_1 LUN Name: lun_10 LUN Size: 500.1GB Prefix Size: 0 Extent Size: 0 Suffix Size: 0 OS Type: vmware Space Reservation: disabled Serial Number: 804j6]FOQ3Ls Comment: Space Reservations Honored: true Space Allocation: disabled State: online LUN UUID: 473e9853-cc39-4eab-a1ef-88c43f42f9dc Mapped: mapped Vdisk ID: 80000402000000000000000000006a6a0335be76 Block Size: 512 Device Legacy ID: - Device Binary ID: - Device Text ID: - Read Only: false Inaccessible Due to Restore: false Inconsistent Filesystem: false Inconsistent Blocks: false NVFAIL: false Alignment: partial-writes Used Size: 89.44GB Maximum Resize Size: 4.94TB Creation Time: 10/31/2014 20:40:10 Class: regular Clone: false Clone Autodelete Enabled: false Has Metadata Provisioned: true QoS Policy Group: - cl1::*> set -privilege diagnostic; lun alignment show -vserver vs_infra -path * Vserver Name: vs_infra LUN Path: /vol/vol_infra_10/qtree_1/lun_10 OS Type: vmware Alignment: partial-writes Write Alignment Histogram: 62, 0, 0, 0, 0, 0, 0, 0 Read Alignment Histogram: 89, 0, 2, 0, 0, 0, 0, 0 Write Partial Blocks: 36 Read partial Blocks: 4 Vserver Name: vs_infra LUN Path: /vol/vol_0_a/lun_03032015_095833 OS Type: windows_2008 Alignment: aligned Write Alignment Histogram: 99, 0, 0, 0, 0, 0, 0, 0 Read Alignment Histogram: 99, 0, 0, 0, 0, 0, 0, 0 Write Partial Blocks: 0 Read partial Blocks: 0 Vserver Name: vs_infra LUN Path: /vol/vol_1_b/lun_03052015_095855 OS type: linux Alignment: misaligned Write alignment histogram percentage: 0, 0, 0, 0, 0, 0, 0, 100 Read alignment histogram percentage: 0, 0, 0, 0, 0, 0, 0, 100 Partial writes percentage: 0 Partial reads percentage: 0 Vserver Name: vs_infra LUN Path: /vol/vol_infra_20/qtree_2/lun_20 OS Type: linux Alignment: indeterminate Write Alignment Histogram: 0, 0, 0, 0, 0, 0, 0, 0 Read Alignment Histogram: 100, 0, 0, 0, 0, 0, 0, 0 Write Partial Blocks: 0 Read partial Blocks: 0 misalignment can also occur in a virtualization environment, on “shared datastors” with VMFS , which can lead to degradation of system performance. In this case, there are two options for resolving the problem of an existing virtual machine — through the NetApp VSC plugin for vCenter, the virtual machine (Storage vMoution) is migrated to a new datastore (with correctly set LUN geometry) or manually using the MBRalign command line utility to align the block boundaries in vmdk file. I want to note that the manual mode will most likely make the virtual machine OS loader not working and will need to be restored. See the Best Practices for File System alignment in Virtual Environments document for more details. Learn more about what I / O Misalignment is and how to fix it .
Reallocation
It is imperative to check that all data is smeared across all disks, for example after adding disks to an already created unit . To check the state of "blurring" of the data on the disks on disks, run on 7-Mode:
reallocate measure –o /vol/<volume> on Custered ONTAP:
reallocate measure -vserver <vserver> -path /vol/<volume> -once true -threshold 3 Let's see an example of the output of such a command:
Sat Mar 1 20:26:16 EET [fas-a:wafl.reallocate.check.highAdvise:info]: Allocation check on '/vol/vol_vol01' is 12, hotspot 5 (threshold 4), consider running reallocate. A value of 12, greater than threshold 4, indicates that a relocation must be started on the volume. The hotspot 5 value indicates that the hot blocks are located on 5 disks, and not on all disks of the unit (if it is not eliminated by simple realocation, look here ).
Insufficient free space and the presence of snapshots may not allow realization . On a volume, you need to have not less than 5% free space in the active file system and 10% free space in SnapReserve.
In the case of adding new disks, it makes sense to unbalance not only data but also empty blocks.
Run the physical relocation of the volume data to optimize performance on 7-Mode
aggr options aggr0 free_space_realloc on reallocate start -f -p /vol/<volume> On Clustered ONTAP. For Clustered ONTAP, the reallocate command will not return the output, you need to request it:
storage aggregate modify -free-space-realloc on reallocate start -vserver <vserver> -path /vol/<volume> -force true -threshold 3 -space-optimized true event log show -messagename wafl.reallocate* -severity * Uniformly distributed load on disks after relocation:
Check disk storage
During the test it is very important to make sure that one of the disks did not die and / or the whole unit does not slow down.
statit for 7-Mode
# statit -b # statit -e disk ut% xfers ureads--chain-usecs writes--chain-usecs cpreads-chain-usecs greads--chain-usecs gwrites-chain-usecs /aggr0/plex0/rg0: 01.0a.16 9 3.71 0.47 1.00 90842 2.94 15.14 1052 0.30 7.17 442 0.00 .... . 0.00 .... . 01.0b.17 11 3.86 0.47 1.00 126105 3.14 14.31 1170 0.25 2.20 1045 0.00 .... . 0.00 .... . 01.0a.18 35 35.52 33.62 1.24 14841 1.63 26.23 965 0.27 15.09 392 0.00 .... . 0.00 .... . 01.0b.25 78 35.15 33.47 1.13 64924 1.48 28.77 2195 0.20 16.75 1493 0.00 .... . 0.00 .... . 01.0a.24 34 33.96 32.26 1.13 17318 1.51 28.21 1007 0.20 17.00 257 0.00 .... . 0.00 .... . 01.0b.22 36 35.40 33.67 1.15 16802 1.51 28.25 1003 0.22 15.56 721 0.00 .... . 0.00 .... . 01.0a.21 35 34.98 33.27 1.16 17126 1.48 28.75 950 0.22 14.78 820 0.00 .... . 0.00 .... . 01.0b.28 77 34.93 33.02 1.13 66383 1.56 27.40 3447 0.35 10.21 8392 0.00 .... . 0.00 .... . 01.0a.23 32 33.02 31.12 1.17 14775 1.53 27.65 1018 0.37 10.80 1321 0.00 .... . 0.00 .... . 01.0b.20 35 34.41 32.38 1.29 15053 1.66 25.73 976 0.37 9.67 1076 0.00 .... . 0.00 .... . 01.0a.19 34 34.80 33.07 1.20 15961 1.51 28.30 930 0.22 15.00 681 0.00 .... . 0.00 .... . 01.0b.26 76 34.41 32.41 1.05 68532 1.63 26.09 3482 0.37 11.93 7698 0.00 .... . 0.00 .... . 01.0a.27 36 35.15 33.32 1.26 15327 1.56 27.35 1018 0.27 12.82 1170 0.00 .... . 0.00 .... . /aggr0/plex0/rg1: 02.0b.29 5 2.00 0.00 .... . 1.63 27.89 1023 0.37 9.80 231 0.00 .... . 0.00 .... . 02.0a.33 5 2.03 0.00 .... . 1.68 27.13 1095 0.35 8.21 330 0.00 .... . 0.00 .... . 02.0b.34 32 34.46 32.75 1.19 14272 1.51 29.87 927 0.20 16.63 617 0.00 .... . 0.00 .... . 02.0a.35 31 32.85 31.00 1.15 14457 1.51 29.87 895 0.35 12.36 1075 0.00 .... . 0.00 .... . 02.0b.41 32 33.10 31.44 1.20 13396 1.51 29.87 930 0.15 21.83 618 0.00 .... . 0.00 .... . 02.0a.43 31 32.73 30.92 1.19 13827 1.58 28.47 1005 0.22 15.22 920 0.00 .... . 0.00 .... . 02.0b.44 31 32.65 31.02 1.11 14986 1.51 29.85 913 0.12 26.00 408 0.00 .... . 0.00 .... . 02.0a.32 31 32.68 30.87 1.13 14437 1.58 28.48 956 0.22 15.78 627 0.00 .... . 0.00 .... . 02.0b.36 32 34.70 32.95 1.13 14680 1.56 28.94 975 0.20 16.75 582 0.00 .... . 0.00 .... . 02.0a.37 31 32.43 30.70 1.21 13836 1.51 29.89 929 0.22 14.78 797 0.00 .... . 0.00 .... . statit / statistics for Cluster-Mode
or using the statistics command:
# storage disk show -broken # run -node * -command "priv set diag; statit -b" # run -node * -command "priv set diag; statit -e" disk ut% xfers ureads--chain-usecs writes--chain-usecs cpreads-chain-usecs greads--chain-usecs gwrites-chain-usecs /aggr0/plex0/rg0: 01.0a.16 9 3.71 0.47 1.00 90842 2.94 15.14 1052 0.30 7.17 442 0.00 .... . 0.00 .... . 01.0b.17 11 3.86 0.47 1.00 126105 3.14 14.31 1170 0.25 2.20 1045 0.00 .... . 0.00 .... . 01.0a.18 35 35.52 33.62 1.24 14841 1.63 26.23 965 0.27 15.09 392 0.00 .... . 0.00 .... . 01.0b.25 78 35.15 33.47 1.13 64924 1.48 28.77 2195 0.20 16.75 1493 0.00 .... . 0.00 .... . 01.0a.24 34 33.96 32.26 1.13 17318 1.51 28.21 1007 0.20 17.00 257 0.00 .... . 0.00 .... . 01.0b.22 36 35.40 33.67 1.15 16802 1.51 28.25 1003 0.22 15.56 721 0.00 .... . 0.00 .... . 01.0a.21 35 34.98 33.27 1.16 17126 1.48 28.75 950 0.22 14.78 820 0.00 .... . 0.00 .... . 01.0b.28 77 34.93 33.02 1.13 66383 1.56 27.40 3447 0.35 10.21 8392 0.00 .... . 0.00 .... . 01.0a.23 32 33.02 31.12 1.17 14775 1.53 27.65 1018 0.37 10.80 1321 0.00 .... . 0.00 .... . 01.0b.20 35 34.41 32.38 1.29 15053 1.66 25.73 976 0.37 9.67 1076 0.00 .... . 0.00 .... . 01.0a.19 34 34.80 33.07 1.20 15961 1.51 28.30 930 0.22 15.00 681 0.00 .... . 0.00 .... . 01.0b.26 76 34.41 32.41 1.05 68532 1.63 26.09 3482 0.37 11.93 7698 0.00 .... . 0.00 .... . 01.0a.27 36 35.15 33.32 1.26 15327 1.56 27.35 1018 0.27 12.82 1170 0.00 .... . 0.00 .... . /aggr0/plex0/rg1: 02.0b.29 5 2.00 0.00 .... . 1.63 27.89 1023 0.37 9.80 231 0.00 .... . 0.00 .... . 02.0a.33 5 2.03 0.00 .... . 1.68 27.13 1095 0.35 8.21 330 0.00 .... . 0.00 .... . 02.0b.34 32 34.46 32.75 1.19 14272 1.51 29.87 927 0.20 16.63 617 0.00 .... . 0.00 .... . 02.0a.35 31 32.85 31.00 1.15 14457 1.51 29.87 895 0.35 12.36 1075 0.00 .... . 0.00 .... . 02.0b.41 32 33.10 31.44 1.20 13396 1.51 29.87 930 0.15 21.83 618 0.00 .... . 0.00 .... . 02.0a.43 31 32.73 30.92 1.19 13827 1.58 28.47 1005 0.22 15.22 920 0.00 .... . 0.00 .... . 02.0b.44 31 32.65 31.02 1.11 14986 1.51 29.85 913 0.12 26.00 408 0.00 .... . 0.00 .... . 02.0a.32 31 32.68 30.87 1.13 14437 1.58 28.48 956 0.22 15.78 627 0.00 .... . 0.00 .... . 02.0b.36 32 34.70 32.95 1.13 14680 1.56 28.94 975 0.20 16.75 582 0.00 .... . 0.00 .... . 02.0a.37 31 32.43 30.70 1.21 13836 1.51 29.89 929 0.22 14.78 797 0.00 .... . 0.00 .... . or using the statistics command:
set -privilege advanced ; statistics disk show -interval 5 -iterations 1 cl03 : 3/5/2015 10:30:29 Busy *Total Read Write Read Write Latency Disk Node (%) Ops Ops Ops (Bps) (Bps) (us) ----- --------------- ---- ------ ---- ----- ----- ----- ------- 1.0.4 Multiple_Values 1 5 2 3 31744 69632 6000 1.0.2 Multiple_Values 1 4 2 2 31744 65536 5263 1.0.8 Multiple_Values 0 2 1 1 62464 43008 5363 1.0.1 cl03-02 0 2 0 1 12288 7168 5500 1.0.0 cl03-02 0 2 0 1 12288 7168 5000 1.0.12 Multiple_Values 0 1 0 0 59392 53248 5000 1.0.10 Multiple_Values 0 1 0 0 60416 56320 6000 1.0.7 cl03-02 0 0 0 0 10240 0 0 1.0.6 cl03-02 0 0 0 0 11264 0 7500 1.0.5 cl03-02 0 0 0 0 10240 0 4000 1.0.3 cl03-02 0 0 0 0 10240 0 13000 1.0.17 cl03-02 0 0 0 0 10240 0 1000 1.0.16 cl03-01 0 0 0 0 10240 0 0 1.0.15 cl03-01 0 0 0 0 0 0 - 1.0.14 cl03-02 0 0 0 0 10240 0 0 1.0.11 cl03-02 0 0 0 0 10240 0 0 We see that our aggregate consists of two RAID groups - rg0 and rg1 , in the configuration RAID-DP 11d + 2p . Discs 0c.16, 1b.17 and 0c.29, 0c.33 are parity disks, the rest are Data.
When data drives are not evenly loaded
In the output of the statit / statistics command, we are looking for weirdness. The value of the use of disks 0s.25, 26 and 28 , compared with other data-disks (for parity disks, other rules apply, we do not look at them). With an average load of ut% on disks of a group of 35%, on these disks the load is almost twice as high , about 75% plus their high latency values ( ureads usecs and write usecs ), compared to other disks, which reaches 60-70 milliseconds, against 14-17 for the rest. In a normally operating aggregate, the load should be evenly distributed across all data disks in the aggregate. It is necessary to reduce the load on the unit by relocation or to replace such discs.
For 7-Mode:
disk fail 0.25 For C-Mode:
storage disk fail –disk 0.25 Now check the damaged 7-Mode disks.
We illuminate the LED indicator of the disk for its easy detection and subsequent removal
We look at the chart in which shelf and position the disk is installed.
aggr status -f sysconfig -d sysconfig -a disk show -v We illuminate the LED indicator of the disk for its easy detection and subsequent removal
led_on disk_name We look at the chart in which shelf and position the disk is installed.
sasadmin shelf Now, check for damaged Cluster-Mode disks.
We illuminate the LED indicator of the disk for its easy detection and subsequent removal
We look at the chart in which shelf and position the disk is installed.
storage aggregate show -state failed run -node * -command sysconfig -d run -node * -command sysconfig -a disk show -pool * -fields disk,usable-size,shelf,type,container-type,container-name,owner,pool disk show -prefailed true disk show -broken We illuminate the LED indicator of the disk for its easy detection and subsequent removal
storage disk set-led -disk disk_name 2 We look at the chart in which shelf and position the disk is installed.
run -node * -command sasadmin shelf CPU load
Make sure there is no gag on the CPU or in the cache and check the load on the protocols:
sysstat for 7-Mode
Read more about sysstat
7M> sysstat -x 1 CPU NFS CIFS HTTP Total Net kB/s Disk kB/s Tape kB/s Cache Cache CP CP Disk FCP iSCSI FCP kB/s iSCSI kB/s in out read write read write age hit time ty util in out in out 5% 0 726 0 726 2555 1371 2784 24 0 0 1 91% 0% - 89% 0 0 0 0 0 0 4% 0 755 0 755 1541 1136 3312 0 0 0 1 92% 0% - 89% 0 0 0 0 0 0 6% 0 1329 0 1334 3379 2069 3836 8 0 0 1 90% 0% - 79% 0 5 0 0 74 0 4% 0 637 0 637 2804 2179 3160 24 0 0 1 92% 0% - 86% 0 0 0 0 0 0 4% 0 587 0 587 2386 1241 2532 8 0 0 1 94% 0% - 98% 0 0 0 0 0 0 8% 0 381 0 381 2374 1063 5224 15120 0 0 6s 96% 45% Tf 78% 0 0 0 0 0 0 7% 0 473 0 473 2902 840 3020 20612 0 0 6s 98% 100% :f 100% 0 0 0 0 0 0 5% 0 1131 0 1133 3542 1371 2612 400 0 0 6s 92% 35% : 70% 0 2 0 0 20 0 7% 0 1746 0 1746 3874 1675 3572 0 0 0 6s 92% 0% - 79% 0 0 0 0 0 0 8% 0 2056 0 2056 5754 3006 4044 24 0 0 6s 95% 0% - 83% 0 0 0 0 0 0 6% 0 1527 0 1527 2912 2162 2360 0 0 0 6s 94% 0% - 86% 0 0 0 0 0 0 6% 0 1247 0 1265 3740 1341 2672 0 0 0 6s 94% 0% - 96% 0 18 0 0 98 0 6% 0 1215 0 1220 3250 1270 2676 32 0 0 6s 92% 0% - 86% 0 5 0 0 61 0 4% 0 850 0 850 1991 915 2260 0 0 0 6s 90% 0% - 75% 0 0 0 0 0 0 7% 0 1740 0 1740 3041 1246 2804 0 0 0 13s 92% 0% - 80% 0 0 0 0 0 0 3% 0 522 0 531 1726 1042 2340 24 0 0 16s 88% 0% - 69% 7 0 0 12 0 0 6% 0 783 0 804 5401 1456 3424 0 0 0 1 92% 0% - 89% 17 0 0 21 0 0 10% 0 478 0 503 4229 919 5840 13072 0 0 1 95% 65% Tf 98% 12 9 0 17 94 0 9% 0 473 0 487 3290 945 2720 23148 0 0 31s 97% 100% :f 100% 12 0 0 17 0 0 6% 0 602 0 606 3196 729 2380 12576 0 0 31s 97% 89% : 100% 0 0 0 0 0 0 10% 0 1291 0 1291 15950 3017 2680 0 0 0 31s 94% 0% - 100% 0 0 0 0 0 0 9% 0 977 0 977 13452 4553 4736 24 0 0 31s 96% 0% - 92% 0 0 0 0 0 0 6% 0 995 0 995 3923 2210 2356 8 0 0 31s 94% 0% - 85% 0 0 0 0 0 0 4% 0 575 0 583 1849 2948 3056 0 0 0 31s 93% 0% - 96% 0 8 0 0 111 0 5% 0 789 0 789 2316 742 2364 24 0 0 31s 94% 0% - 91% 0 0 0 0 0 0 4% 0 550 0 550 1604 1125 3004 0 0 0 31s 92% 0% - 80% 0 0 0 0 0 0 7% 0 1398 0 1398 2910 1358 2716 0 0 0 31s 94% 0% - 87% 0 0 0 0 0 0 sysstat / statistics for Cluster-Mode
Read more about sysstat
Or with the command
CM::*> system node run -node local -command "priv set diag; sysstat -x 1" CPU NFS CIFS HTTP Total Net kB/s Disk kB/s Tape kB/s Cache Cache CP CP Disk FCP iSCSI FCP kB/s iSCSI kB/s in out read write read write age hit time ty util in out in out 5% 0 726 0 726 2555 1371 2784 24 0 0 1 91% 0% - 89% 0 0 0 0 0 0 4% 0 755 0 755 1541 1136 3312 0 0 0 1 92% 0% - 89% 0 0 0 0 0 0 6% 0 1329 0 1334 3379 2069 3836 8 0 0 1 90% 0% - 79% 0 5 0 0 74 0 4% 0 637 0 637 2804 2179 3160 24 0 0 1 92% 0% - 86% 0 0 0 0 0 0 4% 0 587 0 587 2386 1241 2532 8 0 0 1 94% 0% - 98% 0 0 0 0 0 0 8% 0 381 0 381 2374 1063 5224 15120 0 0 6s 96% 45% Tf 78% 0 0 0 0 0 0 7% 0 473 0 473 2902 840 3020 20612 0 0 6s 98% 100% :f 100% 0 0 0 0 0 0 5% 0 1131 0 1133 3542 1371 2612 400 0 0 6s 92% 35% : 70% 0 2 0 0 20 0 7% 0 1746 0 1746 3874 1675 3572 0 0 0 6s 92% 0% - 79% 0 0 0 0 0 0 8% 0 2056 0 2056 5754 3006 4044 24 0 0 6s 95% 0% - 83% 0 0 0 0 0 0 6% 0 1527 0 1527 2912 2162 2360 0 0 0 6s 94% 0% - 86% 0 0 0 0 0 0 6% 0 1247 0 1265 3740 1341 2672 0 0 0 6s 94% 0% - 96% 0 18 0 0 98 0 6% 0 1215 0 1220 3250 1270 2676 32 0 0 6s 92% 0% - 86% 0 5 0 0 61 0 4% 0 850 0 850 1991 915 2260 0 0 0 6s 90% 0% - 75% 0 0 0 0 0 0 7% 0 1740 0 1740 3041 1246 2804 0 0 0 13s 92% 0% - 80% 0 0 0 0 0 0 3% 0 522 0 531 1726 1042 2340 24 0 0 16s 88% 0% - 69% 7 0 0 12 0 0 6% 0 783 0 804 5401 1456 3424 0 0 0 1 92% 0% - 89% 17 0 0 21 0 0 10% 0 478 0 503 4229 919 5840 13072 0 0 1 95% 65% Tf 98% 12 9 0 17 94 0 9% 0 473 0 487 3290 945 2720 23148 0 0 31s 97% 100% :f 100% 12 0 0 17 0 0 6% 0 602 0 606 3196 729 2380 12576 0 0 31s 97% 89% : 100% 0 0 0 0 0 0 10% 0 1291 0 1291 15950 3017 2680 0 0 0 31s 94% 0% - 100% 0 0 0 0 0 0 9% 0 977 0 977 13452 4553 4736 24 0 0 31s 96% 0% - 92% 0 0 0 0 0 0 6% 0 995 0 995 3923 2210 2356 8 0 0 31s 94% 0% - 85% 0 0 0 0 0 0 4% 0 575 0 583 1849 2948 3056 0 0 0 31s 93% 0% - 96% 0 8 0 0 111 0 5% 0 789 0 789 2316 742 2364 24 0 0 31s 94% 0% - 91% 0 0 0 0 0 0 4% 0 550 0 550 1604 1125 3004 0 0 0 31s 92% 0% - 80% 0 0 0 0 0 0 7% 0 1398 0 1398 2910 1358 2716 0 0 0 31s 94% 0% - 87% 0 0 0 0 0 0 Or with the command
CM::*> set -privilege advanced ; statistics show-periodic cpu cpu total fcache total total data data data cluster cluster cluster disk disk pkts pkts avg busy ops nfs-ops cifs-ops ops recv sent busy recv sent busy recv sent read write recv sent ---- ---- -------- -------- -------- -------- -------- -------- ---- -------- -------- ------- -------- -------- -------- -------- -------- -------- 27% 88% 4 4 0 0 46.2KB 13.7KB 0% 35.4KB 2.36KB 0% 10.8KB 10.9KB 962KB 31.7KB 62 55 12% 62% 3 3 0 0 12.7KB 12.9KB 0% 207B 268B 0% 12.3KB 12.5KB 2.40MB 7.73MB 51 47 11% 41% 27 27 0 0 119KB 39.2KB 0% 104KB 25.6KB 0% 13.8KB 13.5KB 1.65MB 0B 155 116 cl03: cluster.cluster: 3/5/2015 10:16:17 cpu cpu total fcache total total data data data cluster cluster cluster disk disk pkts pkts avg busy ops nfs-ops cifs-ops ops recv sent busy recv sent busy recv sent read write recv sent ---- ---- -------- -------- -------- -------- -------- -------- ---- -------- -------- ------- -------- -------- -------- -------- -------- -------- Minimums: 11% 30% 1 1 0 0 12.7KB 12.9KB 0% 148B 245B 0% 10.8KB 10.9KB 947KB 0B 51 47 Averages for 12 samples: 20% 72% 7 7 0 0 58.5KB 20.4KB 0% 42.6KB 4.52KB 0% 15.7KB 15.7KB 1.57MB 4.06MB 105 90 Maximums: 30% 94% 27 27 0 0 145KB 39.2KB 0% 121KB 25.6KB 0% 23.9KB 24.4KB 3.06MB 12.4MB 198 177 Read more about optimization and verification of the disk subsystem here .
, , , SyncMirror (MetroCluster) .
snap shced -A aggr1 0 0 0 snap delete -A aggr1 snap list -A aggr1 snap reserve -A aggr1 0 Clustered ONTAP
system node run -node * -command VSC: FlashCache/FlashPool
Virtual Storage Tiering (VST) — . FlashCache — PCIe, . FlashPool — (SAS/SATA HDD) SSD RAID (), , ( , .. ). , , :
- FlashCache Predictive Cache Statistics (PCS)
- FlashPool Advanced Workload Analyzer (AWA)
Compatibility
.
, .
Comments on errors in the text and suggestions please send to the LAN .
Source: https://habr.com/ru/post/243045/
All Articles