At any given time about the third part of Internet users are on-line.
The activity of users on the Internet has always been a very important factor, to which research organizations have paid particularly much attention. The distribution of users by country, density of connections, the time frame of the greatest / least activity during the day - these are all the initial parameters on the basis of which work is being done to optimize the loads for a particular territory. Peak loads on Internet channels are the cornerstone of the organization of the IT infrastructure, without statistical data, without an understanding of the basic concepts of their occurrence, it is impossible to establish a truly effective model of the network.
Thanks to the universal internetization of the planet (availability and cheapness of the Internet), as well as the carelessness of ordinary users, it became possible to track almost every gadget that is not protected from a network attack (be it a stationary / mobile PC, smartphone, tablet, game console). For example, the IPv4 2012 Internet census, which was sensational in its time, which reflects the activity of unprotected network devices around the world, has become an excellent, multi-layered pile of information for analysis, which still gives people grounds for reflection.

')
On the following video of an interactive map, kindly provided by BotNet, you can see that the number of active devices for a specific territory during the day can change hundreds of times, from connection maximums during the day and evening (warm tones) to minimum at night and morning (cold tones ). This colorful example clearly shows the connection throughout the world between the time of day and user activity, and, as is typical, for Europe and the United States, the drops in activity are not as significant as for all other regions of the world. At a time when Asia and Africa are fast asleep, during the same time interval, the developed countries of the European and American continents are still in touch.
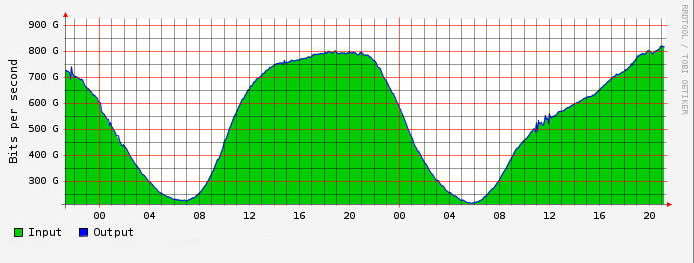
The form of schedules for daily utilization of the Internet channel, similar to the above, is a fairly common spectacle, both for a large provider and for an ordinary owner of the simplest server, customized for any social project, only the scale changes here. In general, as you can see, the data graph is consistent with an interactive map, repeating its day-to-day life cycle across thousands of network infrastructure elements.
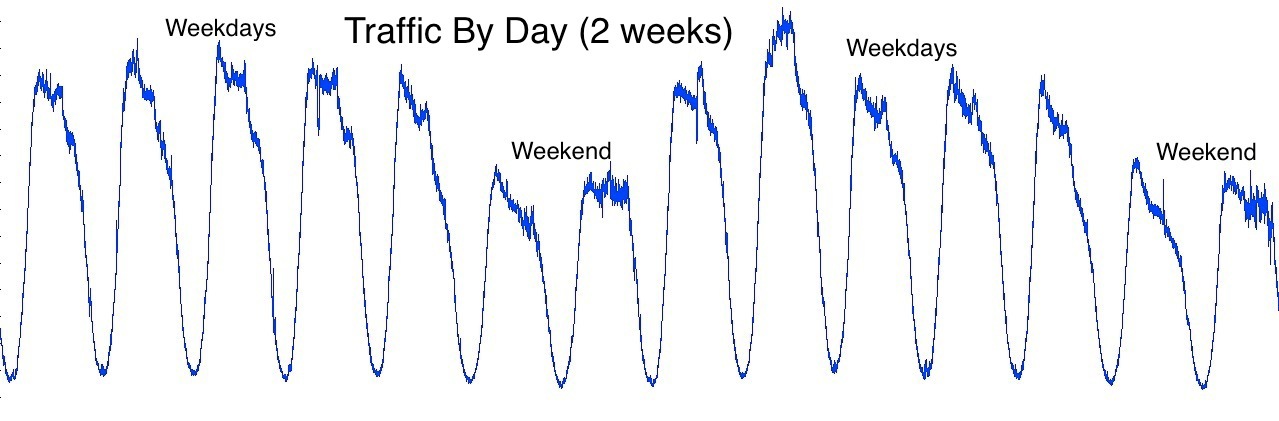
Just as within one day the consumption of network resources changes, there are much less significant fluctuations during the week. But even such minor deviations of loads are often taken into account, making adjustments to the activities of the provider companies, in order to use their equipment more efficiently.
Thanks to the universal internetization of the planet (availability and cheapness of the Internet), as well as the carelessness of ordinary users, it became possible to track almost every gadget that is not protected from a network attack (be it a stationary / mobile PC, smartphone, tablet, game console). For example, the IPv4 2012 Internet census, which was sensational in its time, which reflects the activity of unprotected network devices around the world, has become an excellent, multi-layered pile of information for analysis, which still gives people grounds for reflection.
')
24/7 online
On the following video of an interactive map, kindly provided by BotNet, you can see that the number of active devices for a specific territory during the day can change hundreds of times, from connection maximums during the day and evening (warm tones) to minimum at night and morning (cold tones ). This colorful example clearly shows the connection throughout the world between the time of day and user activity, and, as is typical, for Europe and the United States, the drops in activity are not as significant as for all other regions of the world. At a time when Asia and Africa are fast asleep, during the same time interval, the developed countries of the European and American continents are still in touch.
Graphic component
The form of schedules for daily utilization of the Internet channel, similar to the above, is a fairly common spectacle, both for a large provider and for an ordinary owner of the simplest server, customized for any social project, only the scale changes here. In general, as you can see, the data graph is consistent with an interactive map, repeating its day-to-day life cycle across thousands of network infrastructure elements.
Just as within one day the consumption of network resources changes, there are much less significant fluctuations during the week. But even such minor deviations of loads are often taken into account, making adjustments to the activities of the provider companies, in order to use their equipment more efficiently.
Dry facts
- In fact, for two decades, the Internet has made a real revolution in the world, simplifying communication and giving access to an almost unlimited source of information, and as a result, about a third of the world's population using the Internet is always active.
- John Materley is a Texas researcher who created the software with the goal of pinging all the devices available on the network. According to the results of a planetary "ping attack", he created the very exciting map given in this material.
- In the process of sending requests, a specially developed program of John, according to him, an interesting pattern emerged: gadgets based on iOS and Android, responded to the sent request is always faster than conventional routers did.
- In order to “ping” the entire planet one-time, it took John Materley only 5 hours, the map was created in 12 more.
- Black areas on the map are those areas from which there was not a single answer to pings, green areas correspond to an insignificant number of connections, while red areas are areas with a high concentration of network devices. Not surprisingly, activity was particularly high in large cities in developed countries, while backward countries are in darkness.
- This card, according to John himself, although it reflects the general trends in the activity of network devices in the world, but sometimes it may not be accurate, because not all gadgets connected to the network reacted to the requested ping. In a number of countries, the results could be distorted towards lowering active users. This could be the result of the use of blocking systems for incoming / outgoing to the state by some governments, in particular, this could have a significant impact on China, where the Internet operates with the amendment to the “Great Firewall”.
Source: https://habr.com/ru/post/243015/
All Articles