How have I been pwned? scaled under high load and how much it cost (<$ 25)
The picture shows a graph of the growth of traffic that cloud adepts around the world sell as one of the scenarios, where elastic scaling has a high value:
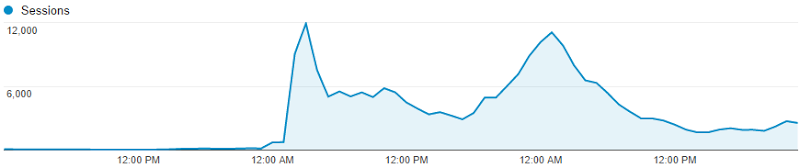
Is this the schedule for Have I been pwned? (HIBP), which at one moment began to serve from ~ 100 sessions per hour to ... 12000 sessions per hour. Almost instantly.
')
This happened during the week in September, when traffic literally increased 60 times. September 10 - 2105 sessions, September 11 - 124036 sessions. Interesting things happen when the load increases so dramatically, so quickly. So I wanted to share with you a few things that I learned - what was done by me well and what needed to be improved.
Oh, by the way, why did traffic grow so sharply? Because the news everywhere reported that 5 million Gmail accounts were hacked . Of course, in reality they meant that 5 million addresses of unknown origin, almost entirely on gmail.com, were merged into the Russian forum with the corresponding passwords. But this in no way prevented a large number of people from going crazy around the world and coming to HIBP in order to check whether they were or not the “lucky ones” whose data leaked to the network. This gave me the opportunity to experience a unique experience and set interesting tasks for me to solve. Let me go through some tasks.
Do you know that you can not fix something that you are not able to measure? Yes, in fact, it is very difficult to understand what is happening now, if you do not have the ability to measure different things. I had three really important tools that helped me a lot:
Google Analytics: this is the source of the graphics you saw above and I actively used this tool while the load was increasing, practically in real time studying how many people were on the site at a certain point in time (at least those who did not block in tracking):

New Relic: This is an absolutely cool tool and if you still do not use it in your cloud websites, then I suggest you rather read Scott Hanselman's article on how to start using the service for free .
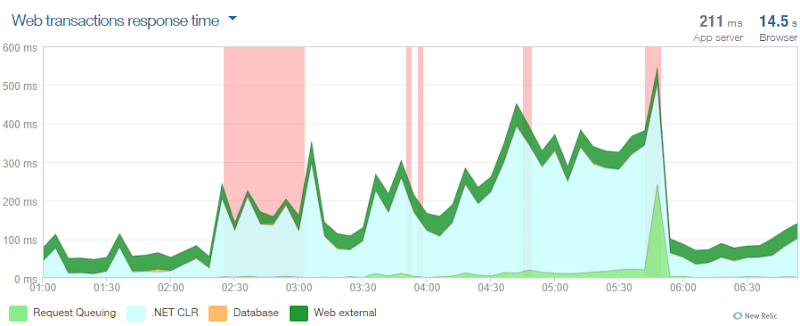
In fact, it was the very first truly useful tool, not only to determine how hard I felt, but also to determine the possible causes that affect system performance. I took this graph immediately after scaling, it shows a lot of errors in the interval from 2:30. In addition, the graph shows a large increase in the CLR time metric. And as you can see, things went much better right after 6:00.
NewRelic was also a tool that was available from anywhere from any device. The iPad application is just great, it contains information panels that provide all the necessary information from the total number of requests, to requests to certain pages. Browser and server timings with details such as network latency and DOM rendering turned out to be particularly useful data (NewRelic adds some client scripts that will allow to receive such data). These data later showed me how heavily the server is loaded:

Azure monitoring: you get Azure monitoring features for free, they are available to you in the Azure management portal. Monitoring allows you to monitor a number of metrics for which you end up paying for it, so watching them is really important:

They also fit well into the platform's notification service (Azure Alerts), which I will discuss shortly.
The most important thing in all of this is that from the very beginning I had really good sources of information on a number of metrics and knew what was going on at any given time. I did not have to spend time on immersion and research on what the hell is going on in reality, since I already saw the whole picture in front of me in a convenient way.
I understood about the drama that arose on Thursday morning due to the fact that my mailbox was filled with notifications - there were dozens of them and they all looked like this:

This is a notification from Azure for the metrics of the CPU, and I also set up a similar one to notify if a certain number of requests have been exceeded. All these notifications refer to the monitoring metrics about which I spoke above and they let me know that something unusual is happening with my service.
Other notifications were from NewRelic, notifications about the full load of the service were especially useful (NewRelic periodically pings endpoints and checks the availability of the connection to the database and the storage), and notifications about the degradation of the Apdex index were also useful:

Apdex is the NewRelic way of measuring user satisfaction from the site and the coolest thing about it is that it collects all the indicators from the database and request queues to the CLR time and simply says “will the user be satisfied with the response timeout? ". This question includes the real user too - the one that loads your website through a bad connection from another part of the world and the one that works through high-speed 4G next to the data center itself. I will not dive deeply into this question here, just to show how the picture of my service looked on Thursday morning:

At the lowest point, more than 25,000 users were modeled and of these, too many had a review of the site as “Unpleasant” simply because the system was too slow. She worked - but too slowly. In any case, the main thing is that I was very happy to have proactive notifications about what is happening with my site.
But from all this follows the next question - why has the system slowed down? Didn't I have a “cloud scaling”? Have I recently told you with pleasure how great the scaling of services is in Azure ? Yes, that's it, except for one problem ...
If you are unfamiliar with the concept of scaling or do not know how it works in Azure, then first read the material on the link . In short, scaling is accomplished by approaching when new instances of the same resources are added, instead of increasing the capacity of an already existing resource. In Azure, this means I can do things like this:

See the problem? Yes, I left the number “3” as the maximum number of copies. That's all. This is the reason why my “Apdex” index became unacceptable, as Azure did exactly what I indicated to it. Looking at it now, my decision seems silly to me. This restriction exists so that you do not scale to the maximum number of instances automatically and a month after that did not receive a shocking account for the cloud. However, when you have notifications , such a restriction of yourself becomes meaningless. Let me explain:
Azure uses per-minute billing. Lift a copy, use it for an hour and a half and turn it off; you will only pay for 90 minutes of consumption. Regardless of the size of the instance, 90 minutes will cost you less than a dollar for any purpose. If you set up notifications, for example, to an unusually high level of requests (this is configured in the Azure management portal), you will know that your environment was scaled almost as soon as this happens, and maybe even before it happens. It depends on how you set up the notifications. Bearing in mind such advantages, I would rather choose to scale the service up to 10 copies with paying an extra pair of dollars than the pain of my users working with one single copy.
In fact, it seems strange, why you may not want to scale at all? I mean, you won't say “Wow! My site is actually very successful, I think I should leave my users suffering a little bit more. ” Some people may worry about the effects of such things as DDoS attacks, but these are the things that come to light quickly using the tools I described above.
So my advice is to maximize your level of automatic scaling of the service and stop worrying (I'll talk about the money side a little later).
Horizontal scaling (adding instances) can occur automatically, but vertical scaling (increasing the size of each instance) is a manual process. Both processes give you the opportunity to increase computing capacity, but at the same time, they achieve this in different ways. In this article on Azure, I said that when moving from a small instance to a medium sized instance, both performance and price doubled. Switching from medium to large size doubles the parameters again and so on - the larger the instance, the more you get.
When I discovered a problem with scaling due to a limit of three instances, I not only increased it to 10, but also changed the size of the instances from small to medium. Why? Partly because I was not sure that ten small copies would be enough, but also because I wanted to allocate more resources to handling high loads as soon as possible and quickly returning my site to normal operation.
Another reason is that larger instances under load will not exhaust their resources so quickly. Pay attention to the schedule:

Here you can see that at midnight there were 727 sessions, then 753 at one in the morning, at two o'clock already 9042 and 11910 at three in the morning, This is a significant change in a very short period of time. Returning to the issue of performance, when Azure scales up a service, adding an instance, it looks for some time how things are (this time is configured), and then if necessary adds another instance and so on. The pause period between adding an instance was set to 45 minutes, which gave Azure a lot of time to understand how things are going with the load and decide whether or not to add another instance. But since traffic grew so quickly, an additional small-instance could have exhausted its resources very quickly, in a much shorter period than the pause period. A medium copy gave me much more room to maneuver.
Of course, large copies would give me even more power. One day, our two-year-old child woke up crying at one in the morning of Friday night and my wife went to check on him. Being a caring parent, I decided to check how my HIBP site is doing and saw about 2,200 requests per minute with four medium instances raised. I changed the size of the copies to large and went back to sleep - more reinsured. (And yes, the human child was all right too!)
Obviously, the site HIBP received a severe blow, I have no doubt. If anything is to be expected when the site is full of requests, it is that its work will begin to fail. Obviously, one of these failures is to slow down the site and in fact Apdex clearly shows this. Another failure could be the fact that the site under load will begin to pour errors of various kinds, many of which NewRelic can determine. And that's what was discovered:

The key in the figure is the value in the upper right corner - the error rate is 0.0078% or in other words, this means that only 1 request out of 128,000 produced an error during the week. Of course, this value is based only on those requests that, in principle, were received by the site and were processed by NewRelic cloud monitoring. The red lines in the figure reflect the moment when the HIBP site was determined to be non-operational (fallen) (NewRelic connects to the site from the outside and checks whether it works or not). I must say that I saw the reports of NewRelic that the site “fell”, but after that I had the opportunity to enter the site through the browser without any problems right during the “fall” period. The ping function by which the service checks the site is an approximate constant of 2.66 requests per minute, so it is quite possible that the site was working when it was noted that it was “lying” (or “lying” at the time when it was said that it was working!):

Inevitably, some of the requests could return with gateway timeout errors (gateway timeouts), but the fact that it continued to work so well under such a load is impressive.
I’ll share with you one little magic trick - faster sites scale faster. I know the revelation, right? :)
In December, I wrote about world optimizations for web content for unexpected, wild success . Impressive then the popularity of the site pales in comparison with the past week, but what I did then helped me to really optimize the site for the moment when the load took off again. Let me demonstrate what I mean. Here is the site as it looks today:

Bearing in mind our desire to scale specifically this site as much as possible, let's look at all requests that are sent to haveibeenpwned.com in boot order:

Wait - what ?! Yeah, just four requests. The reason why the number of requests to the site is so small is as follows:
But of course, all this can be improved even more. For a start, 32KB is too much for a favicon - twice as much as the other content that comes from the domain! Initially, I made it in the form of 64x64 pixels, which is more than enough, but ideally it could even be in the form of 48x48. So I changed the icon and removed half the size, and then put it in the CDN, adding the link tag to the head of my template. So another request and another 32KB of code disappeared for my clients. This change will take effect the next time I publish the modified code.
Another thing that allowed the site to lose weight was the fact that there was practically no work on the server to create the page - only the controller returns the view. In fact, the Azure SQL Database (SQL Azure) was used to generate a list of leaks, but even with this, here's what the throughput looked like:

Hmm ... - almost linear. Yeah, all because the data is cached and actually requested by the home page from the database once every five minutes. This shows us that the database is significantly isolated from high loads. And in fact, the most protracted request is the one that checks the presence in the database of the user who subscribes to the notification. This peak query looks like this:

This corresponds to only 3.43k requests in two hours, or one lazy request in two seconds. Of course, I was lucky that my site is of this type, which does not require frequent access to the database and this changes a lot when the load is seriously increased. In such cases, multiple database connections can quickly increase the response time to user requests.
So, if I do not often request data from the database, then how do I actually check the hacked accounts? I talked in detail about this in my previous post, “The story of“ Have I been pwned? ” , But in short, the answer is Azure Table Storage. As described in my blog, this repository is extremely fast in scripts when you just need to select a row by a key field (for example, email in my case), just as I structured the data on the HIBP website. This led to my Table Storage usage statistics looking like this:

Two big peaks look strange here. They are caused by the fact that I uploaded 5 million GMail accounts on Thursday morning and then another 5 million mail.ru records 1 million yandex.ru records the next day. Although the site was uploaded at this time, the download of 11 million entries had no effect on the availability or performance of the site.
However, from the table we can find out some useful data, for example, the average delay on the server was around 7 ms. Seven milliseconds ! In fact, even with a huge load, this figure remained at the same level and was even closer to 4 ms. The only thing that, as you can see, actually changed was the percentage of successful requests. The reason for this is simple - when someone searched for data via email and received zero results, such a request was considered “failed” in statistics.
In conclusion of this section, I would like to say that the site was extremely effective from the very beginning and that is why I was able to scale it even wider. I can not fail to highlight the importance of this again: optimizations are absolutely critical for the growth of the load and, of course, they make working with the site even more enjoyable even during normal work. Optimize your site as soon as possible, before you need these optimizations.
So, as described above, I used the CDN for whatever is possible. These include jQuery, Bootstrap (CSS and JS) and Font Awesome. It looks like this:

This is a great opportunity to increase productivity. Firstly, it allows reducing the number of requests to HIBP and reducing the data flow by 69 KB for each new visitor. Ok, I could pack these JS and CSS files with others that are used on the site and get the same number of requests, but this would not allow me to reduce the amount of data transferred, for which I pay money. Multiply these 69 KB by about a quarter of a million visitors in the hottest period and it will immediately be about 16 GB of transmitted data, which I saved.
Finally, it's all about speed. Much work was done by me to reduce the Apdex index, which also includes all the steps listed above. The benefits of public CDNs are not only that they have data closer to the user, since they are hosted by large providers (such as jQuery on Google’s servers), but also that the requested data has most likely been cached by the user in the browser, since were obtained from other resources that also use these CDNs. And there is nothing faster than working from the local cache!
In fact, when speaking about geo-distributed things, the question may arise as to why I did not use the Azure Traffic Manager service and did not distribute my website across different Azure data centers throughout the world. I could do it very simply (as described by the link) and I will most likely do it in the future, but at that time my site worked successfully on the basis of a single copy. Adding another node, say in Europe, would double my expenses to the site. But I assure you, if some day I encounter such a constant load, when one instance is simply not enough, then the most intelligent will be to use the Traffic Manager to increase the possibility of scaling. This will not only speed up the site for those users who will be closer to the second location of the site, but will literally double my ability to scale to a serious load, bearing in mind the availability of a second data center for my needs.
When dealing with a load that grows quickly and unexpectedly, it is necessary to be able to react just as quickly. One of my decisions in the early stages was to remove a piece of code that I published a few days earlier. This code had to launch a separate stream and send a notification to Google Analytics to register an API call, something that I had previously only tracked on the client side (and this led to me skipping the registration of calls that occurred directly). I wasn't sure how much these additional requests to Google Analytics from the server could have an impact on performance, so I decided to kill them.
And here an important thing comes up: since this code was ready for release, all I had to do was make a change and send it to GitHub for the automatic publication magic to occur ( Azure Web Sites function - comment transl. ) :

This process really requires a minimum of movement. Yes, there is a slight slowdown in the service (usually NewRelic informed me that the speed was reduced for a period of one minute), but this is a very simple way to make a change and it does not affect people who use the service in any tangible way. The main advantage here is that I can make changes and get them in production at first wish. I had other ideas on how to reduce the load with changes in the code and the only barrier to their application would be the inability to make changes so quickly and without affecting the environment under high load.
Of course, partly my ability to release new code so quickly is based on the fact that I use the automatic build feature. About four years ago, I wrote a series of articles on your deployment it wrong! and in fact praised the importance of automation. And now it distorts me when I see people posting their sites through the build in Visual Studio or, God forgive me, uploading changes using FTP. There are a million reasons to use tools like GitHub and Azure Kudu service to place code. Just use them and never go back to the past!
One of the things that I learned during this exercise, which I was endlessly pleased with, is that scaling up and down horizontally and vertically does not have the slightest impact on performance during the transition ( this is about the benefits of scaling Azure WebSites - comment perev. ). It would be much more difficult for me to decide, say, when to scale up to a more powerful instance, if this process could lead to site interruption. On the graphs you can see small peaks, but I did not register dropped requests or anything else, which could say that users faced with a non-working site.
By Friday night, the situation began to gradually return to normal. I still used an instance of a medium-sized site, and the zoom feature reduced the number of instances to just one. Then changed to two. Then again to one. Then, ok, it began to look like this (each color is a separate logical instance of the site):

Behavior was like a toy Eo-Eo. CPU , . , CPU , . , NewRelic Apdex . , CPU , , .
: 50% . , , , , . , , . , – 30% , .
– - . . , Apdex , .
, :

:

, . Apdex , , .
, . , , , . . , , ( API) . !
, , – ? , ? , .
, :

, - , Microsoft. , , , .
, . – “” -. – , 24 . :

10 11 , 12 . medium, . , – , 25.80 -, . , 24 .
medium. medium, 11 12 :

, 55.03 medium .
. 11 - , medium:

, 20.34 7 . , , Azure , 20.34 20.34083 ( Azure – . . ).
:
Yes. – $21.65 . , . , HIBP , !
, . . – !? :

20 , :

. Table Storage – .
, <$25. Donations, why I don't need them and why I'm now accepting them for “Have I been pwned?” – , . , . , , !
, “ ” . , , ( 10). , , . , , - .
– devops. , , . , , : - , session state, – , .
Azure , , - . , , -, , . , – !
Is this the schedule for Have I been pwned? (HIBP), which at one moment began to serve from ~ 100 sessions per hour to ... 12000 sessions per hour. Almost instantly.
')
This happened during the week in September, when traffic literally increased 60 times. September 10 - 2105 sessions, September 11 - 124036 sessions. Interesting things happen when the load increases so dramatically, so quickly. So I wanted to share with you a few things that I learned - what was done by me well and what needed to be improved.
Oh, by the way, why did traffic grow so sharply? Because the news everywhere reported that 5 million Gmail accounts were hacked . Of course, in reality they meant that 5 million addresses of unknown origin, almost entirely on gmail.com, were merged into the Russian forum with the corresponding passwords. But this in no way prevented a large number of people from going crazy around the world and coming to HIBP in order to check whether they were or not the “lucky ones” whose data leaked to the network. This gave me the opportunity to experience a unique experience and set interesting tasks for me to solve. Let me go through some tasks.
1) Measure everything as early as possible.
Do you know that you can not fix something that you are not able to measure? Yes, in fact, it is very difficult to understand what is happening now, if you do not have the ability to measure different things. I had three really important tools that helped me a lot:
Google Analytics: this is the source of the graphics you saw above and I actively used this tool while the load was increasing, practically in real time studying how many people were on the site at a certain point in time (at least those who did not block in tracking):
New Relic: This is an absolutely cool tool and if you still do not use it in your cloud websites, then I suggest you rather read Scott Hanselman's article on how to start using the service for free .
In fact, it was the very first truly useful tool, not only to determine how hard I felt, but also to determine the possible causes that affect system performance. I took this graph immediately after scaling, it shows a lot of errors in the interval from 2:30. In addition, the graph shows a large increase in the CLR time metric. And as you can see, things went much better right after 6:00.
NewRelic was also a tool that was available from anywhere from any device. The iPad application is just great, it contains information panels that provide all the necessary information from the total number of requests, to requests to certain pages. Browser and server timings with details such as network latency and DOM rendering turned out to be particularly useful data (NewRelic adds some client scripts that will allow to receive such data). These data later showed me how heavily the server is loaded:
Azure monitoring: you get Azure monitoring features for free, they are available to you in the Azure management portal. Monitoring allows you to monitor a number of metrics for which you end up paying for it, so watching them is really important:
They also fit well into the platform's notification service (Azure Alerts), which I will discuss shortly.
The most important thing in all of this is that from the very beginning I had really good sources of information on a number of metrics and knew what was going on at any given time. I did not have to spend time on immersion and research on what the hell is going on in reality, since I already saw the whole picture in front of me in a convenient way.
2) Configure notifications
I understood about the drama that arose on Thursday morning due to the fact that my mailbox was filled with notifications - there were dozens of them and they all looked like this:
This is a notification from Azure for the metrics of the CPU, and I also set up a similar one to notify if a certain number of requests have been exceeded. All these notifications refer to the monitoring metrics about which I spoke above and they let me know that something unusual is happening with my service.
Other notifications were from NewRelic, notifications about the full load of the service were especially useful (NewRelic periodically pings endpoints and checks the availability of the connection to the database and the storage), and notifications about the degradation of the Apdex index were also useful:
Apdex is the NewRelic way of measuring user satisfaction from the site and the coolest thing about it is that it collects all the indicators from the database and request queues to the CLR time and simply says “will the user be satisfied with the response timeout? ". This question includes the real user too - the one that loads your website through a bad connection from another part of the world and the one that works through high-speed 4G next to the data center itself. I will not dive deeply into this question here, just to show how the picture of my service looked on Thursday morning:
At the lowest point, more than 25,000 users were modeled and of these, too many had a review of the site as “Unpleasant” simply because the system was too slow. She worked - but too slowly. In any case, the main thing is that I was very happy to have proactive notifications about what is happening with my site.
But from all this follows the next question - why has the system slowed down? Didn't I have a “cloud scaling”? Have I recently told you with pleasure how great the scaling of services is in Azure ? Yes, that's it, except for one problem ...
3) Initially set the maximum scaling limit
If you are unfamiliar with the concept of scaling or do not know how it works in Azure, then first read the material on the link . In short, scaling is accomplished by approaching when new instances of the same resources are added, instead of increasing the capacity of an already existing resource. In Azure, this means I can do things like this:
See the problem? Yes, I left the number “3” as the maximum number of copies. That's all. This is the reason why my “Apdex” index became unacceptable, as Azure did exactly what I indicated to it. Looking at it now, my decision seems silly to me. This restriction exists so that you do not scale to the maximum number of instances automatically and a month after that did not receive a shocking account for the cloud. However, when you have notifications , such a restriction of yourself becomes meaningless. Let me explain:
Azure uses per-minute billing. Lift a copy, use it for an hour and a half and turn it off; you will only pay for 90 minutes of consumption. Regardless of the size of the instance, 90 minutes will cost you less than a dollar for any purpose. If you set up notifications, for example, to an unusually high level of requests (this is configured in the Azure management portal), you will know that your environment was scaled almost as soon as this happens, and maybe even before it happens. It depends on how you set up the notifications. Bearing in mind such advantages, I would rather choose to scale the service up to 10 copies with paying an extra pair of dollars than the pain of my users working with one single copy.
In fact, it seems strange, why you may not want to scale at all? I mean, you won't say “Wow! My site is actually very successful, I think I should leave my users suffering a little bit more. ” Some people may worry about the effects of such things as DDoS attacks, but these are the things that come to light quickly using the tools I described above.
So my advice is to maximize your level of automatic scaling of the service and stop worrying (I'll talk about the money side a little later).
4) Scale in advance
Horizontal scaling (adding instances) can occur automatically, but vertical scaling (increasing the size of each instance) is a manual process. Both processes give you the opportunity to increase computing capacity, but at the same time, they achieve this in different ways. In this article on Azure, I said that when moving from a small instance to a medium sized instance, both performance and price doubled. Switching from medium to large size doubles the parameters again and so on - the larger the instance, the more you get.
When I discovered a problem with scaling due to a limit of three instances, I not only increased it to 10, but also changed the size of the instances from small to medium. Why? Partly because I was not sure that ten small copies would be enough, but also because I wanted to allocate more resources to handling high loads as soon as possible and quickly returning my site to normal operation.
Another reason is that larger instances under load will not exhaust their resources so quickly. Pay attention to the schedule:
Here you can see that at midnight there were 727 sessions, then 753 at one in the morning, at two o'clock already 9042 and 11910 at three in the morning, This is a significant change in a very short period of time. Returning to the issue of performance, when Azure scales up a service, adding an instance, it looks for some time how things are (this time is configured), and then if necessary adds another instance and so on. The pause period between adding an instance was set to 45 minutes, which gave Azure a lot of time to understand how things are going with the load and decide whether or not to add another instance. But since traffic grew so quickly, an additional small-instance could have exhausted its resources very quickly, in a much shorter period than the pause period. A medium copy gave me much more room to maneuver.
Of course, large copies would give me even more power. One day, our two-year-old child woke up crying at one in the morning of Friday night and my wife went to check on him. Being a caring parent, I decided to check how my HIBP site is doing and saw about 2,200 requests per minute with four medium instances raised. I changed the size of the copies to large and went back to sleep - more reinsured. (And yes, the human child was all right too!)
5) Azure cloud is incredibly stable
Obviously, the site HIBP received a severe blow, I have no doubt. If anything is to be expected when the site is full of requests, it is that its work will begin to fail. Obviously, one of these failures is to slow down the site and in fact Apdex clearly shows this. Another failure could be the fact that the site under load will begin to pour errors of various kinds, many of which NewRelic can determine. And that's what was discovered:
The key in the figure is the value in the upper right corner - the error rate is 0.0078% or in other words, this means that only 1 request out of 128,000 produced an error during the week. Of course, this value is based only on those requests that, in principle, were received by the site and were processed by NewRelic cloud monitoring. The red lines in the figure reflect the moment when the HIBP site was determined to be non-operational (fallen) (NewRelic connects to the site from the outside and checks whether it works or not). I must say that I saw the reports of NewRelic that the site “fell”, but after that I had the opportunity to enter the site through the browser without any problems right during the “fall” period. The ping function by which the service checks the site is an approximate constant of 2.66 requests per minute, so it is quite possible that the site was working when it was noted that it was “lying” (or “lying” at the time when it was said that it was working!):
Inevitably, some of the requests could return with gateway timeout errors (gateway timeouts), but the fact that it continued to work so well under such a load is impressive.
6) Grow thin in advance
I’ll share with you one little magic trick - faster sites scale faster. I know the revelation, right? :)
In December, I wrote about world optimizations for web content for unexpected, wild success . Impressive then the popularity of the site pales in comparison with the past week, but what I did then helped me to really optimize the site for the moment when the load took off again. Let me demonstrate what I mean. Here is the site as it looks today:
Bearing in mind our desire to scale specifically this site as much as possible, let's look at all requests that are sent to haveibeenpwned.com in boot order:
Wait - what ?! Yeah, just four requests. The reason why the number of requests to the site is so small is as follows:
- I use a public CDN for everything that is possible. I will talk about this in more detail separately, as this is a very important topic;
- I use the Azure CDN service for all icons of hacked (pwned) companies. This allows you to redirect requests from the site to distribute them worldwide;
- All JavaScript scripts and CSS styles are packed and minified. This is good for end users who will have to make fewer HTTP requests and good for a site that will send less bytes from each request. It would be nice to put them in the CDN too, but being able to overwrite them when editing the code and letting them automatically send via ASP.NET is much more important to me, considering how often I change different things.
But of course, all this can be improved even more. For a start, 32KB is too much for a favicon - twice as much as the other content that comes from the domain! Initially, I made it in the form of 64x64 pixels, which is more than enough, but ideally it could even be in the form of 48x48. So I changed the icon and removed half the size, and then put it in the CDN, adding the link tag to the head of my template. So another request and another 32KB of code disappeared for my clients. This change will take effect the next time I publish the modified code.
Another thing that allowed the site to lose weight was the fact that there was practically no work on the server to create the page - only the controller returns the view. In fact, the Azure SQL Database (SQL Azure) was used to generate a list of leaks, but even with this, here's what the throughput looked like:
Hmm ... - almost linear. Yeah, all because the data is cached and actually requested by the home page from the database once every five minutes. This shows us that the database is significantly isolated from high loads. And in fact, the most protracted request is the one that checks the presence in the database of the user who subscribes to the notification. This peak query looks like this:
This corresponds to only 3.43k requests in two hours, or one lazy request in two seconds. Of course, I was lucky that my site is of this type, which does not require frequent access to the database and this changes a lot when the load is seriously increased. In such cases, multiple database connections can quickly increase the response time to user requests.
So, if I do not often request data from the database, then how do I actually check the hacked accounts? I talked in detail about this in my previous post, “The story of“ Have I been pwned? ” , But in short, the answer is Azure Table Storage. As described in my blog, this repository is extremely fast in scripts when you just need to select a row by a key field (for example, email in my case), just as I structured the data on the HIBP website. This led to my Table Storage usage statistics looking like this:
Two big peaks look strange here. They are caused by the fact that I uploaded 5 million GMail accounts on Thursday morning and then another 5 million mail.ru records 1 million yandex.ru records the next day. Although the site was uploaded at this time, the download of 11 million entries had no effect on the availability or performance of the site.
However, from the table we can find out some useful data, for example, the average delay on the server was around 7 ms. Seven milliseconds ! In fact, even with a huge load, this figure remained at the same level and was even closer to 4 ms. The only thing that, as you can see, actually changed was the percentage of successful requests. The reason for this is simple - when someone searched for data via email and received zero results, such a request was considered “failed” in statistics.
In conclusion of this section, I would like to say that the site was extremely effective from the very beginning and that is why I was able to scale it even wider. I can not fail to highlight the importance of this again: optimizations are absolutely critical for the growth of the load and, of course, they make working with the site even more enjoyable even during normal work. Optimize your site as soon as possible, before you need these optimizations.
7) Steal bandwidth from others!
So, as described above, I used the CDN for whatever is possible. These include jQuery, Bootstrap (CSS and JS) and Font Awesome. It looks like this:
This is a great opportunity to increase productivity. Firstly, it allows reducing the number of requests to HIBP and reducing the data flow by 69 KB for each new visitor. Ok, I could pack these JS and CSS files with others that are used on the site and get the same number of requests, but this would not allow me to reduce the amount of data transferred, for which I pay money. Multiply these 69 KB by about a quarter of a million visitors in the hottest period and it will immediately be about 16 GB of transmitted data, which I saved.
Finally, it's all about speed. Much work was done by me to reduce the Apdex index, which also includes all the steps listed above. The benefits of public CDNs are not only that they have data closer to the user, since they are hosted by large providers (such as jQuery on Google’s servers), but also that the requested data has most likely been cached by the user in the browser, since were obtained from other resources that also use these CDNs. And there is nothing faster than working from the local cache!
In fact, when speaking about geo-distributed things, the question may arise as to why I did not use the Azure Traffic Manager service and did not distribute my website across different Azure data centers throughout the world. I could do it very simply (as described by the link) and I will most likely do it in the future, but at that time my site worked successfully on the basis of a single copy. Adding another node, say in Europe, would double my expenses to the site. But I assure you, if some day I encounter such a constant load, when one instance is simply not enough, then the most intelligent will be to use the Traffic Manager to increase the possibility of scaling. This will not only speed up the site for those users who will be closer to the second location of the site, but will literally double my ability to scale to a serious load, bearing in mind the availability of a second data center for my needs.
8) Always, always be ready for quick code updates.
When dealing with a load that grows quickly and unexpectedly, it is necessary to be able to react just as quickly. One of my decisions in the early stages was to remove a piece of code that I published a few days earlier. This code had to launch a separate stream and send a notification to Google Analytics to register an API call, something that I had previously only tracked on the client side (and this led to me skipping the registration of calls that occurred directly). I wasn't sure how much these additional requests to Google Analytics from the server could have an impact on performance, so I decided to kill them.
And here an important thing comes up: since this code was ready for release, all I had to do was make a change and send it to GitHub for the automatic publication magic to occur ( Azure Web Sites function - comment transl. ) :
This process really requires a minimum of movement. Yes, there is a slight slowdown in the service (usually NewRelic informed me that the speed was reduced for a period of one minute), but this is a very simple way to make a change and it does not affect people who use the service in any tangible way. The main advantage here is that I can make changes and get them in production at first wish. I had other ideas on how to reduce the load with changes in the code and the only barrier to their application would be the inability to make changes so quickly and without affecting the environment under high load.
Of course, partly my ability to release new code so quickly is based on the fact that I use the automatic build feature. About four years ago, I wrote a series of articles on your deployment it wrong! and in fact praised the importance of automation. And now it distorts me when I see people posting their sites through the build in Visual Studio or, God forgive me, uploading changes using FTP. There are a million reasons to use tools like GitHub and Azure Kudu service to place code. Just use them and never go back to the past!
9) Experiment with the site instance size and auto scaling options to find your ideal.
One of the things that I learned during this exercise, which I was endlessly pleased with, is that scaling up and down horizontally and vertically does not have the slightest impact on performance during the transition ( this is about the benefits of scaling Azure WebSites - comment perev. ). It would be much more difficult for me to decide, say, when to scale up to a more powerful instance, if this process could lead to site interruption. On the graphs you can see small peaks, but I did not register dropped requests or anything else, which could say that users faced with a non-working site.
By Friday night, the situation began to gradually return to normal. I still used an instance of a medium-sized site, and the zoom feature reduced the number of instances to just one. Then changed to two. Then again to one. Then, ok, it began to look like this (each color is a separate logical instance of the site):
Behavior was like a toy Eo-Eo. CPU , . , CPU , . , NewRelic Apdex . , CPU , , .
: 50% . , , , , . , , . , – 30% , .
– - . . , Apdex , .
, :
:
, . Apdex , , .
, . , , , . . , , ( API) . !
10) , !
, , – ? , ? , .
, :
, - , Microsoft. , , , .
, . – “” -. – , 24 . :
10 11 , 12 . medium, . , – , 25.80 -, . , 24 .
medium. medium, 11 12 :
, 55.03 medium .
. 11 - , medium:
, 20.34 7 . , , Azure , 20.34 20.34083 ( Azure – . . ).
:
| Cost of | |||
| Small | $0.10 | 25.08 | $2.51 |
| Medium | $0.20 | 55.03 | $11.01 |
| Large | $0.40 | 20.34 | $8.14 |
| Total | $21.65 |
Yes. – $21.65 . , . , HIBP , !
, . . – !? :
20 , :
. Table Storage – .
, <$25. Donations, why I don't need them and why I'm now accepting them for “Have I been pwned?” – , . , . , , !
Conclusion
, “ ” . , , ( 10). , , . , , - .
– devops. , , . , , : - , session state, – , .
Azure , , - . , , -, , . , – !
useful links
- Try Azure for free for 30 days!
- Microsoft Azure Development Center (azurehub.ru) - scripts, tutorials, examples, design recommendations
- Twitter.com/windowsazure_ru - the latest Microsoft Azure news
- Microsoft Azure Community on Facebook - experts, questions
- Explore Microsoft Virtual Academy courses on cloud and other technologies
- Download free or trial Visual Studio
- Become a universal Windows application developer
Source: https://habr.com/ru/post/242975/
All Articles