New WebStorm 9: just better. Support for Meteor, React and JSX, integration with Gulp, PhoneGap and more
2 weeks ago we completely updated WebStorm - our IDE for front-end development and Node.js. We have already announced some improvements in WebStorm 9, including support for new frameworks and tools. Since then, a lot of work has been done, the results of which can be seen in WebStorm 9. In this post we will describe in detail about this new functionality and briefly recall everything else.

In less than 6 months since WebStorm 8 has been released and we have been planning improvements for WebStorm 9, the demand for JSX syntax support has become the most popular in our tracker, having collected more than 200 user votes. On blogs and twitter, everyone vied with one another for praising the new library, colleagues at the front-end developers started using React, and we realized that we need to urgently start working on its support.
')
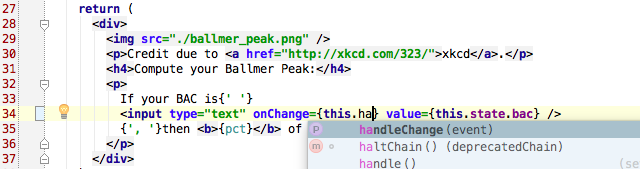
So in WebStorm 9, there appeared lights and autocompletion for JSX tags and JavaScript expressions inside JSX, as well as navigation to the declaration of the React-component and refactoring Rename for them. Built-in WebStorm inspections work for JSX code, but we look forward to JSX support in JSHint and ESLint.
We recommend to watch the webinar recording , in which John Lindquist talks about developing with React in WebStorm.
We are continuing to work on improvements, so we’ll be happy to receive youTrack quest.
In the last WebStorm release, we added spy-js , a tool for tracing and profiling JavaScript code. With the WebStorm update, spy-js now allows you to profile not only the client-side code, but also Node.js (which you can read on our blog ), and also supports EcmaScript 6.
Trace results can now be saved in a file and reopened using the Save / Load trace options in the spy-js menu.
When the spy-js session is running, the tool not only collects all the available information about the execution of the code, but also creates a kind of feedback to the IDE in each executed function. Artyom Govorov , the developer of spy-js, came up with this connection to autocomplete the code and execute arbitrary code in the context of the functions performed. This was what they implemented in WebStorm 9!
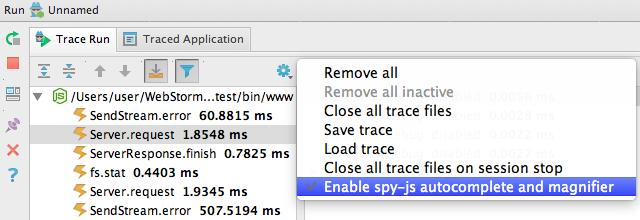
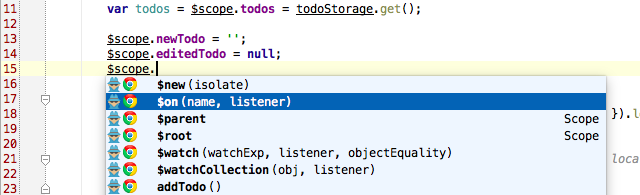
So, first you need to make sure that the menu spy-js is ticked at Enable spy-js autocomplete and magnifier . After that, we start spy-js, open our application in the browser (or just launch it if we work with Node.js) and start editing its code in WebStorm. For an already executed code fragment, when editing it, we can see the spy-js and browser icons in the auto-completion list. This means that this option was proposed by spy-js based on the results of its actual execution.
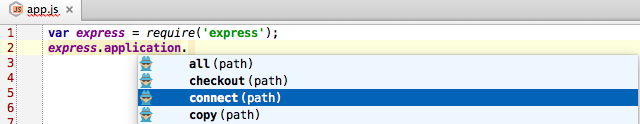
Unlike static code analysis, which WebStorm performs for regular autocompletion, spy-js knows exactly what methods and properties are currently available.
With the help of the Magnifier function from spy-js, you can see information about the values of objects by the results of code execution, similar to the Evaluate expression during debug, but without breakpoint. Information appears when you hover the cursor over any object, and not only on the parameters and return values, on the executed client-side and Node.js code while spy-js is running.

Read more about this in our blog (in English).
The list of tools supported by WebStorm for checking the quality and style of the code (in addition to the built-in inspections of the IDE itself) has been extended with integration with ESLint .
ESLint is in many ways similar to JSHint, the main difference is that the set of checks can be extended by connecting rules. In WebStorm, code verification using ESLint is performed on the fly. Unfortunately, it does not work as fast as JSHint, but this is already a feature of the tool itself. ESLint must be pre-installed via npm.
We also added integration with JSCS , a tool for checking the style of the code (which you can read more about in Habré ). In the WebStorm settings, you can enable verification using JSCS and select a configuration file or one of the existing presets. Formatting errors will be displayed in the editor. We hope that the Code styles inside WebStorm are customized according to your command style, and you will not see any warnings from JSCS.

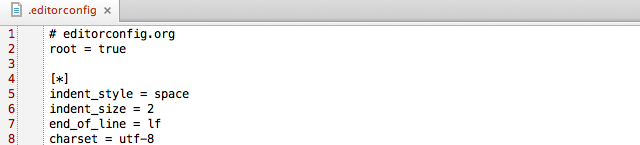
Let's continue about formatting the code. In the last post about WebStorm 9 EAP, we talked about the fact that the EditorConfig plugin was added to WebStorm, which allows sharing the code style settings in a project in different editors. All rules are described in the project .editorconfig file. Please note that the formatting rules in .editorconfig by default take precedence over the settings in the IDE. You can turn off EditorConfig in Editor | Code Style .
Another new feature in the formatting settings is Detect and use the existing file indents for editing ( Editor | Code Style ). As you can guess, with this option, the editor will now determine and reuse the current formatting settings in the file associated with the indents.
WebStorm 9 allows you to create temporary files in a project, they are also Scratch files . On the shortcut Shift-Cmd-N on Mac / Ctrl + Alt + Shift + Insert on Windows or Linux, you can create a temporary file by selecting the desired file type. All features of the editor, such as code completion and inspection, are available in Scratch files.

For completeness, let's go through other new functions in version 9, which we wrote about in more detail in the last post :
And finally, a few more updates that we would like to talk about.
Integration with pub serve for Dart-projects
Integration with pub serve for Dart projects has been added to WebStorm 9. Now, working with Dart, when opening the application in the browser or debugging, WebStorm will automatically start pub serve. Any messages during pub serve will be displayed in the corresponding window in the IDE. In addition, many improvements have been made in the support of Dart, for example, debugging of Dart isolates and the ability to quickly open the Dart Observatory have been added.
Improved CSS3 support
We redesigned CSS support in WebStorm, adding support for all the latest CSS3 specifications. As a result, auto-completion has been improved for properties and values from CSS3, as well as new inspections for CSS.
Indexing node_modules in a new way
Modern projects use more and more diverse tools and dependencies on Node.js. For example, the Web Starter Kit project template (which, by the way, was added to the list of new project templates) has 25 direct dependencies from npm only.
We made it so that WebStorm now indexes only these dependencies themselves, excluding their internal node modules from the index. Return to full indexing is possible in the settings Languages & Frameworks | Node.js and npm .
Values when debugging directly in the editor
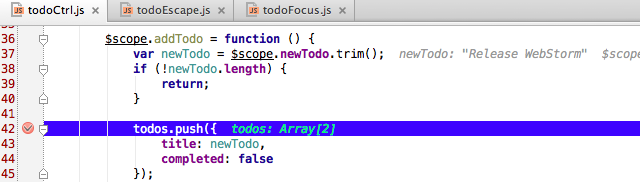
A new debugger feature has been added to WebStorm 9: now when debugging, the values of objects are displayed directly in the editor next to the code.
Learn more about WebStorm 9, as well as download a free 30-day trial version of the IDE, please visit the product page .
Upgrading to version 9 is free for anyone who purchased a license after October 22, 2013. We also remind you that all JetBrains IDEs are now free for students .
We will be happy to answer your questions in the comments.
Remarks and suggestions on the new version are also waiting for us in our bug tracker .
Develop with Pleasure!
React and JSX support
In less than 6 months since WebStorm 8 has been released and we have been planning improvements for WebStorm 9, the demand for JSX syntax support has become the most popular in our tracker, having collected more than 200 user votes. On blogs and twitter, everyone vied with one another for praising the new library, colleagues at the front-end developers started using React, and we realized that we need to urgently start working on its support.
')
So in WebStorm 9, there appeared lights and autocompletion for JSX tags and JavaScript expressions inside JSX, as well as navigation to the declaration of the React-component and refactoring Rename for them. Built-in WebStorm inspections work for JSX code, but we look forward to JSX support in JSHint and ESLint.
We recommend to watch the webinar recording , in which John Lindquist talks about developing with React in WebStorm.
We are continuing to work on improvements, so we’ll be happy to receive youTrack quest.
New features in spy-js: Node.js and ES6 support, code completion and Magnifier
In the last WebStorm release, we added spy-js , a tool for tracing and profiling JavaScript code. With the WebStorm update, spy-js now allows you to profile not only the client-side code, but also Node.js (which you can read on our blog ), and also supports EcmaScript 6.
Trace results can now be saved in a file and reopened using the Save / Load trace options in the spy-js menu.
When the spy-js session is running, the tool not only collects all the available information about the execution of the code, but also creates a kind of feedback to the IDE in each executed function. Artyom Govorov , the developer of spy-js, came up with this connection to autocomplete the code and execute arbitrary code in the context of the functions performed. This was what they implemented in WebStorm 9!
So, first you need to make sure that the menu spy-js is ticked at Enable spy-js autocomplete and magnifier . After that, we start spy-js, open our application in the browser (or just launch it if we work with Node.js) and start editing its code in WebStorm. For an already executed code fragment, when editing it, we can see the spy-js and browser icons in the auto-completion list. This means that this option was proposed by spy-js based on the results of its actual execution.
Unlike static code analysis, which WebStorm performs for regular autocompletion, spy-js knows exactly what methods and properties are currently available.
With the help of the Magnifier function from spy-js, you can see information about the values of objects by the results of code execution, similar to the Evaluate expression during debug, but without breakpoint. Information appears when you hover the cursor over any object, and not only on the parameters and return values, on the executed client-side and Node.js code while spy-js is running.
Read more about this in our blog (in English).
ESLint and JSCS
The list of tools supported by WebStorm for checking the quality and style of the code (in addition to the built-in inspections of the IDE itself) has been extended with integration with ESLint .
ESLint is in many ways similar to JSHint, the main difference is that the set of checks can be extended by connecting rules. In WebStorm, code verification using ESLint is performed on the fly. Unfortunately, it does not work as fast as JSHint, but this is already a feature of the tool itself. ESLint must be pre-installed via npm.
We also added integration with JSCS , a tool for checking the style of the code (which you can read more about in Habré ). In the WebStorm settings, you can enable verification using JSCS and select a configuration file or one of the existing presets. Formatting errors will be displayed in the editor. We hope that the Code styles inside WebStorm are customized according to your command style, and you will not see any warnings from JSCS.
Code formatting
Let's continue about formatting the code. In the last post about WebStorm 9 EAP, we talked about the fact that the EditorConfig plugin was added to WebStorm, which allows sharing the code style settings in a project in different editors. All rules are described in the project .editorconfig file. Please note that the formatting rules in .editorconfig by default take precedence over the settings in the IDE. You can turn off EditorConfig in Editor | Code Style .
Another new feature in the formatting settings is Detect and use the existing file indents for editing ( Editor | Code Style ). As you can guess, with this option, the editor will now determine and reuse the current formatting settings in the file associated with the indents.
Scratch files
WebStorm 9 allows you to create temporary files in a project, they are also Scratch files . On the shortcut Shift-Cmd-N on Mac / Ctrl + Alt + Shift + Insert on Windows or Linux, you can create a temporary file by selecting the desired file type. All features of the editor, such as code completion and inspection, are available in Scratch files.
Briefly about other updates
For completeness, let's go through other new functions in version 9, which we wrote about in more detail in the last post :
- Meteor framework support: WebStorm defines Meteor projects,
provides auto-completion of the Meteor API code, allows you to debug both the server and the client part of the Meteor application; - Integration with PhoneGap, Cordova and Ionic : added the ability to create new projects, as well as run the run and emulate commands using the Run configuration in WebStorm;
- Updated Live Edit allows you to automatically restart Node.js applications when the code changes;
- Gulp assembly system integration;
- Postfix templates for JavaScript;
- Improved support for the Polymer library;
And finally, a few more updates that we would like to talk about.
Integration with pub serve for Dart-projects
Integration with pub serve for Dart projects has been added to WebStorm 9. Now, working with Dart, when opening the application in the browser or debugging, WebStorm will automatically start pub serve. Any messages during pub serve will be displayed in the corresponding window in the IDE. In addition, many improvements have been made in the support of Dart, for example, debugging of Dart isolates and the ability to quickly open the Dart Observatory have been added.
Improved CSS3 support
We redesigned CSS support in WebStorm, adding support for all the latest CSS3 specifications. As a result, auto-completion has been improved for properties and values from CSS3, as well as new inspections for CSS.
Indexing node_modules in a new way
Modern projects use more and more diverse tools and dependencies on Node.js. For example, the Web Starter Kit project template (which, by the way, was added to the list of new project templates) has 25 direct dependencies from npm only.
We made it so that WebStorm now indexes only these dependencies themselves, excluding their internal node modules from the index. Return to full indexing is possible in the settings Languages & Frameworks | Node.js and npm .
Values when debugging directly in the editor
A new debugger feature has been added to WebStorm 9: now when debugging, the values of objects are displayed directly in the editor next to the code.
What's next?
Learn more about WebStorm 9, as well as download a free 30-day trial version of the IDE, please visit the product page .
Upgrading to version 9 is free for anyone who purchased a license after October 22, 2013. We also remind you that all JetBrains IDEs are now free for students .
We will be happy to answer your questions in the comments.
Remarks and suggestions on the new version are also waiting for us in our bug tracker .
Develop with Pleasure!
Source: https://habr.com/ru/post/242415/
All Articles