How we did analytics for a high load site

Recently on Habré there was a publication about how analytics is implemented on ivi.ru. After reading, I wanted to talk about the analytics that we did for one large site. The customer, unfortunately, did not allow publishing a link to the site in the article. If you believe the Alexa Rank, then the traffic on the site, for which we did the analytics, is 10 times more than on ivi.ru.
The reasons and goals of creating analytics
Due to the large number of site visits, at some point a letter came from Google asking to stop using the service or reduce the number of requests to it, and some data could not be obtained through Google Analytics.
Information we collected about users:
')
- page views (refer, IP, UAgent, screen sizes);
- active / passive;
- buffering;
- rewind.
About 70% of views accounted for pages with a video player, the main task was to collect information from these pages. It was necessary to get information about active / passive - how many seconds the user was active on the page, and how many seconds she was inactive - open as a tab. Also interesting was information about buffering (video slows down or not and how long it loads from the user), information about the number of rewinds and from what second to which users are rewinding. To do this, javascript code was placed on all pages, which was tapped every 30 seconds to the server with information from the page opened in the browser.
Client part
The script is quite simple, it jerks two single-pixel images from the analytics server, and transmits the parameters in the URL of these pictures. Why is that? In our opinion, the most reliable solution will work absolutely in any browsers and platforms. If I used AJAX, I would have to solve issues with cross-domain and performance in different browsers. There are two pictures stat.gif and p.gif, the first one is used when loading the page and transmits basic information about the user, the second one twitches every 15 seconds and transmits that information that may change over time (active / passive, buffering, rewinding).
This picture jerks when you first open the page:
/stat.gif?pid=p0oGejy139055323022216801050bny0&l=http%3A%2F%2Fsite.ru%2F8637994&r=http%3A%2F%2Fsite.ru%2F&w=1680&h=1050&a=Mozilla%2F5.0%20(Windows%20NT%206.1%3B%20rv%3A26.0)%20Gecko%2F20100101%20Firefox%2F26.0&k=1390553230222&i=30000&vr=3.0 This picture jerks every 30 seconds:
/p.gif?pid=p0oGejy139055323022216801050bny0&rand=6752416&b=1&time=2-188x190-57x50-349x251-83x0-235x&pl=29&fpl=46&ld=552&efsc=true&tfsc=19&tac=89&tpas=70&vr=3.0 Parameter names are abbreviated to reduce traffic. PID is a unique identifier for viewing the page, it is used to match the data that came from stat.gif and p.gif.
Server part
We immediately decided on the database, it was decided to use MongoDB (quick insert, data is stored in documents, non-relational structure). The first implementation was written in php, the very first tests under heavy load showed serious problems:
- php-fpm itself in conjunction with nginx consumed a lot of resources for processing the request;
- when stat.gif was loaded into MongoDB, the insertion of a new document was done, then every 15 seconds, the data that comes with the picture p.gif was updated to it.
It became obvious that the data from stat.gif and p.gif needed to be aggregated and inserted into Mong only after the requests stopped coming to p.gif. This made it possible to reduce the number of calls to MongoDB by an order of magnitude and the calls themselves only became on the insert (without Update). With PHP, I can’t solve the problem, so there was a question about choosing a new platform. We needed the ability to process requests at the web server level, so pretty quickly our choice fell on NodeJS. The reasons are asynchronous, perspective, familiar syntax (a lot of JavaScript experience), relative simplicity of writing code. A great influence on the choice in favor of NodeJS was given by the publication “A Million Concurrent Connections on Node.js” by ashtuchkin — we repeated the described experiment on our server.
It is a little about the traffic and the nature of the requests: on each open page, such a script is located and reports data to the server every 15 seconds. One user can have several such pages open at once and all of them will send data regardless of whether the user is on this page now or not. And this is all at about ~ 40 million views per day!
Server device on NodeJS
First, for the test, they made a single-threaded version of the server. The script is very simple; in it, request took requests for pictures stat.gif and p.gif and wrote this data into an array.
Array ( [PID] => Array ( [stat] => stat.gif [pgif] => p.gif ( 15 ) [time] => , PID ) ) Next, a timer is started on the timer, which iterates over the entire array with the PID and checks the time of the last data change on this PID (Array [PID] [time]). If more than 90 seconds have passed since the last change (since the data does not come from the user every 15 seconds, it means that he closed the page or the Internet disappeared), then the record is inserted into MongoDB and is deleted from the array itself. Having tested the single-threaded version, it was decided to implement a multi-threaded version (in order to maximize the use of all processor features).
NodeJS makes multithreading easy thanks to the excellent Cluster module. Within the framework of this article I will not go into the details of multi-thread code operation (this is already written a lot), I will only say that this module allows you to run a piece of code in several instances on different threads and provides a tool for the interaction of child threads with the head using messages.
The logic of a single-threaded application was divided between the head and child threads:
The child threads accepted the http request, they sent back one pixel image in response, and the data received with the image in the get request was transferred to the head stream.
Sample code of worker- (child thread):
// server.on('request', function(req, res) { - GET var url_parts = url.parse(req.url, true); var query = url_parts.query; var url_string = url_parts.pathname.slice(1); var cookies = {}; switch(url_string){ // /p.gif /stat.gif case 'p.gif': process.send({ routeType: 'p.gif', params: url_parts.query}); // if(image == undefined){ // -- fs.stat('p.gif', function(err, stat) { if (!err){ image = fs.readFileSync('p.gif'); res.end(image); } else res.end(); }); }else res.end(image); break; case 'stat.gif': url_parts.query.ip = req.connection.remoteAddress; process.send({ routeType: 'stat.gif', params: url_parts.query}); // if(image == undefined){ // -- fs.stat('p.gif', function(err, stat) { if (!err){ image = fs.readFileSync('p.gif'); res.end(image); } else res.end(); }); }else res.end(image); break; default: // res.end('No file'); break; } }); The data to the head stream is sent using process.send ({}) .
In the main stream, the data from the child streams are received using
worker.on ('message', function (data) {}) and written to an array.
Sample headstream code:
, worker.on('message', function(data) { switch(data.routeType){ case 'p.gif': counter++; if(data.params.pid != undefined && dataObject[data.params.pid] != undefined){ // PID, dataObject[data.params.pid]['pgif'] = data.params; // , dataObject[data.params.pid]['time'] = Math.ceil(new Date().getTime()/1000); // } break; case 'stat.gif': counter++; if(data.params.pid != undefined){ if(dataObject[data.params.pid] == undefined) // , dataObject[data.params.pid] = []; dataObject[data.params.pid]['stat'] = data.params; // dataObject[data.params.pid]['time'] = Math.ceil(new Date().getTime()/1000); // , , , } break; default: break; } }); Also, a timer is started in the main stream, which analyzes the records in the array and inserts into the MongoDB database those for which there was no change for more than 90 seconds.
Data storage
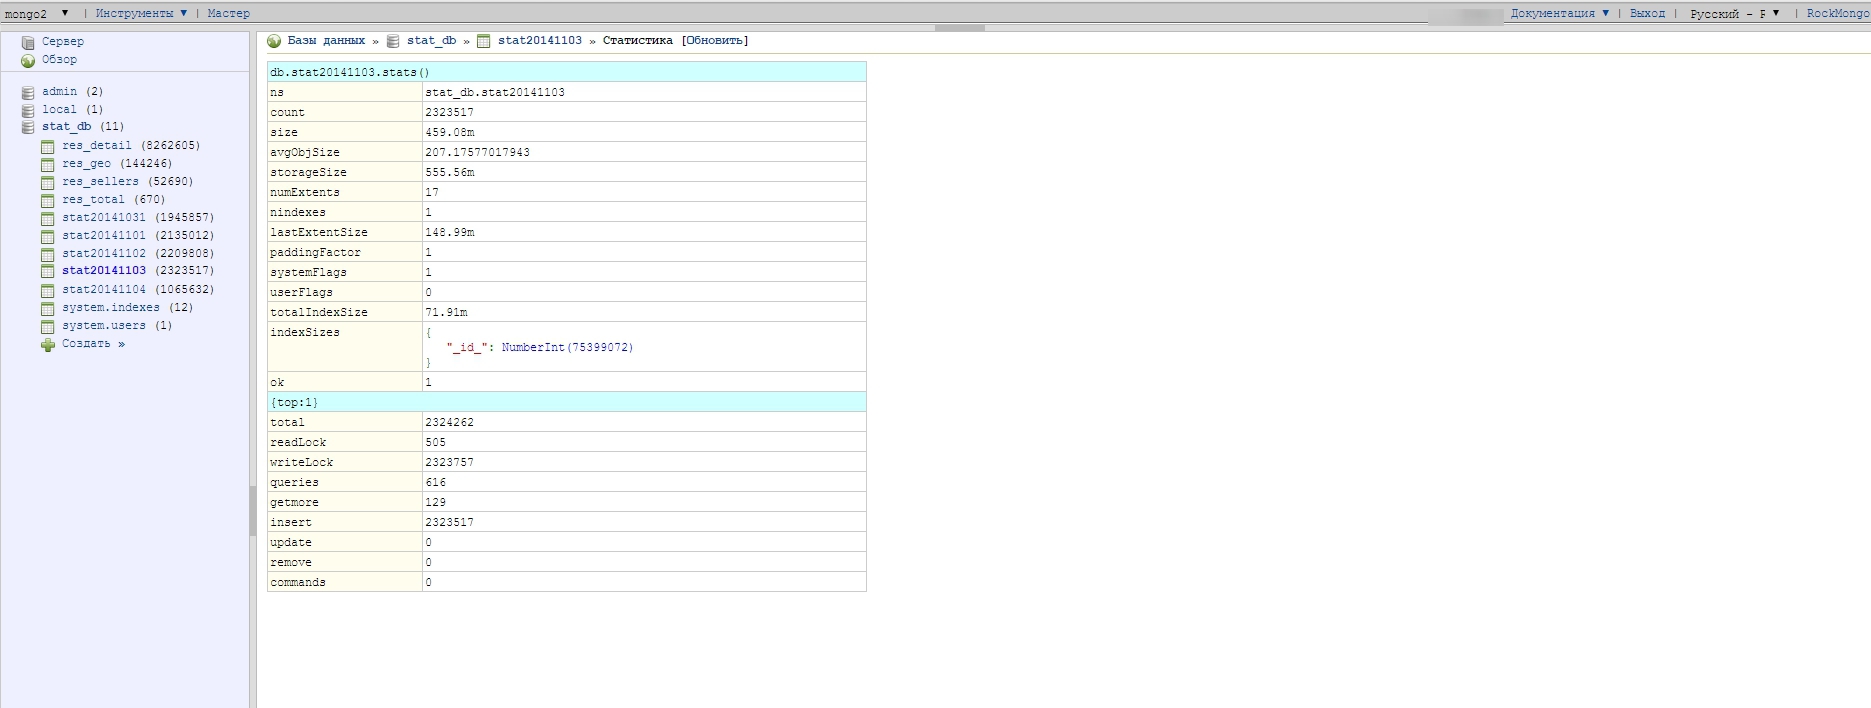
With data storage, there are also some nuances; in the course of various experiments, we came to the conclusion that storing all data in one collection (analogous to a table in MySQL) is a bad idea. It was decided to create a new collection for every day - the benefit in MongoDB is made easy: if the collection does not exist and you try to write something into it, it is created automatically. It turns out that in the course of its work, the server part writes data in a collection with a date in the name: stat20141102, stat20141103, stat20141104.
Database structure:
The structure of one document (one document corresponds to one view):

The data for one day weighs pretty well - about 500 megabytes is when sampling 1/10 (only 10% of visitors work statistics), respectively, if they started without sampling, then the collection in one day would weigh 5 GB. Collections with raw data are stored for only 5 days, then deleted as unnecessary, because there are aggregator scripts that run on the crown, process the raw data and write them already in a more compact, computed form into other collections - which are used to build graphs and reports.
Building reports
Initially, reports were built using find () and Map-Reduce . The collection.find () method was used for simple samples, and more complex ones were built using Map-Reduce. The second method is the most complex and required a complete understanding of the mechanisms of distributed computing and practical experience. The tasks that MySQL solved by the AVG, SUM, ORDER BY operators required some tweaks with Map-Reduce in order to get a result. A good gift for us at that moment was the release of a stable version of MongoDB 2.2, the Aggregation Framework appeared in it, it allowed us to easily and quickly build complex samples from the database, I do not use Map-Reduce.
An example of a request through aggregate (groups data by video id and sums up | gets an average by performance):
db.stat20141103.aggregate([ { $match : { $nor : [{ ap : {$gt: 20}, loaded :0 }]} } , { $group: { _id:"$video_id", sum:{$sum:1}, active:{$sum:"$active" }, passive:{$sum:"$passive" }, buffer:{$sum:"$buffer" }, rewind:{$avg:"$rewindn" }, played:{$sum:"$played" } } } ]); Deploy and Debug
In order for all this to work well under high load, you need to tweak the operating system and database a little:
- In the OS itself, it was necessary to increase the number of descriptors. In the case of Ubuntu, this is:
#/etc/security/limits.conf # ( ). * - nofile 1048576
In other Linux systems, settings from the /etc/sysctl.conf file. - To speed up the work of MongoDB database files are placed on the SSD drive. Also, it was necessary to correct the configuration of the database: turned off the Journalin, and played with the time of the reset and information on the disk (storage.syncPeriodSecs - this parameter indicates how often MongoDB unloads data from RAM to disk).
/etc/mongodb.conf journal: enabled: false
PS I decided to supplement the article with answers to questions in the comments:
What is the rationale for choosing MongoDB?
The choice of the MongoDB database was due to the fact that there was already a positive experience with it, I think PostgreSQL could easily cope with this task - it is possible that even better results
How and where was the PID generated?
PID is a unique field, it must identify a unique view. It is generated based on a unique user id (it is generated based on IP and some more info) + current Unix tag, UAgent, screen resolution, and a certain random value.
The PID page was created, the same page was immediately updated. You will have a completely different PID.
Generated in javascript on user page, unique user id comes from server through cookies.
Was journaling included? Backup, fault tolerance? And fault tolerance at the Node level?
journal'ing - off - the loss of data of these statistics in a few minutes for this project is not critical
Fault tolerance Node - if you worked with it, then you know that any minor error in the child streams - this stream collapses, and if the whole web server is at the head.
Solved as follows in the main stream, the child streams were monitored and in the event of a fall they stopped.
In case the head stream fell, it was used forever - if the server crashed it immediately restart it and the error with which it fell wrote to the log
What is the delay to receive reports considered normal? Aggregation for the last day or as close as possible to realtime?
There are internal statistics. She writes some elementary things about traffic, it is available in real time, the one I described in the article aggregates at intervals of 1 hour - that was quite enough
What is not pleased with the same Google Analytics (or YandexMetrica)? From what you wrote, it seems, everything can be done with it
Big traffic, google and so used sampling for building reports + a letter came from them asking to reduce the load on their services
Why is the Apache Storm - Hadoop / Spark set not standard for such a class of tasks?
Apache Storm / Hadoop / Spark is not familiar with them, do not write in JAVA
Initially, there was a great experience of writing various code in php / MySQL / JS / HTML
in nodeJS, the JS syntax is for the most part therefore the choice fell in its direction.
Also in the course of discussions on Habré an interesting idea arose - to replace the part with NodeJS with nginx which writes all the data in the required format to the log and some application would read this log at the time of insertion, process the data and insert it into the database. With the current conditions of the problem, this could well be implemented - the main arguments of this option: nginx is a very reliable and proven solution over the years.
Source: https://habr.com/ru/post/242369/
All Articles