Visual Studio extension for rendering custom classes in debug mode
Good day,
In this article I want to talk about creating extensions for Visual Studio, which helps visualize complex user classes during the debugging process of the application.
In our project, we actively use the domestic geometric core C3D Kernel . This library provides a large number of classes for working with curves, bodies, surfaces, etc. These classes have a complex structure and in the process of debugging an application using standard Visual Studio visualization tools, it is difficult to understand which, for example, the surface is stored in a particular variable. And when debugging complex algorithms, it is very important to understand what happens to the object at each step of the algorithm.
')
We tried to work around this problem in various ways. For example, the coordinates of the points on the leaflet were written out if it was a simple two-dimensional curve. And then on points painted this curve. The second solution to the problem is to save the object to a file at the right time, and then open this file in the test utility supplied with the library. It really helps with debugging, but it requires a lot of manual work. You need to insert the object saving code into a file, recompile the application, perform the necessary actions in the application itself to launch a specific algorithm, then open the saved file in the utility, view the result, add corrections to the algorithm if necessary, and repeat the whole procedure again. In general, it is tolerable, but I wanted to be able, right in Visual Studio in debug mode, to point to the desired variable and to see in a convenient way how the object stored there looks.
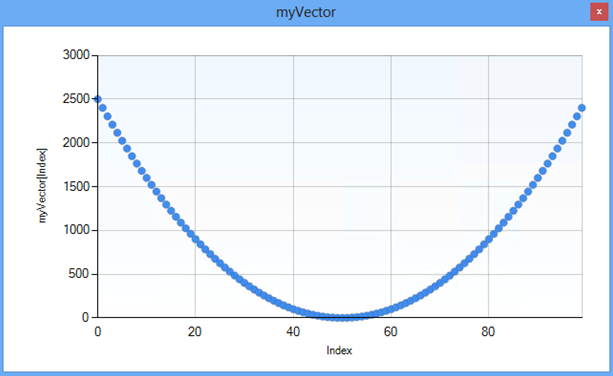
In search of a solution to this problem, I came across an extension for Visual Studio Image Watch from Microsoft itself for the OpenSource library OpenCV. This extension allows you to view in the process of debugging the contents of variables of the type cv :: Mat, read bitmap'ov. Then the idea came to write a similar extension, but for our types. Unfortunately, it was not possible to find the source code of this extension in open access, which in my opinion is strange. It was necessary to collect information bit by bit on how to write such extensions for Visual Studio. With the documentation on this topic on msdn everything is sad. And there are not many examples, or rather one std :: vector visualizer . Which is still not so easy to find. The essence of the example: visualization on the graph of int numbers lying in std :: vector <int> in debug mode:
To create extensions you need to install the Visual Studio SDK. After installation, a new project type appears in the project wizard:

The wizard to create a new project will create all the necessary files and configure the project.
I will not repeat the description from the example from Microsoft, the steps for creating an extension are already briefly described there. I recommend everyone interested to look at the description for this example. In this article I wanted to touch on the moments that are not described in this example.
The variable, the contents of which we want to see, and the extension itself are located in different processes. From this example, it was still unclear how to get data from more complex user types. The example demonstrates the technique when using the IDebugProperty3 interface, we find out the address of the first element in the vector and the address of the last element. By subtracting the addresses, we find the size of the section of memory and then copy this section of memory to our process. I will give here the code from the example:
Everything would be fine, but here it is shown how to get data from an object, if this data is stored in a single memory location. Apparently, MS itself uses a similar approach in its Image Watch extension. There, the image is also stored in a single piece of memory and there is a pointer to the beginning of this piece.
And what to do if the user type has a complex hierarchical structure and does not look like a regular data array? It is even worse if the class stores pointers to the base classes of other classes. To restore such an object piece by piece seems an impossible task. Plus, this design is very fragile - when you add a new member to an intermediate class, the extension stops working. Ideally, I wanted to get the object itself or its copy. Unfortunately, I have not found a way to do this, while remaining solely within the framework of only one extension. But knowing that the classes we need can serialize themselves into a file or into a buffer in memory, I decided that I could use a hybrid approach: with shared memory and a vector. This solution is not very elegant and requires editing classes, but quite working. Plus, nothing better was invented.
The essence of the method:
In each class (which we want to debug), a special class is added that contains one field: std :: vector <char>. In the vector, we will store the marker string, which can then be used to find the serialized object in shared memory. Further, in each non-constant class method we add the call of the function of class preservation to shared memory. Now at each change of a class, it will save itself in shared memory.
In the extension itself: we retrieve a marker string from the object using the method from the MS example. Further, on a marker we get the serialized object from shared memory and we will deserialize it. As a result, we have a copy of the object in our extension. Well, after that is a matter of technology. From the object we obtain useful data and somehow show them in a convenient form.
To demonstrate this idea, an example extension was written. The simplest library was also written to demonstrate the work of the extension. There are only two classes in this library: HabraPoint and HabraLine. Plus a couple of classes needed for serialization and work with shared memory. The HabraLine class is just a segment. Boost is used for serialization and work with shared memory. After installing the extension, we have the opportunity to visualize the value of variables of type HabraLine.
You can watch the extension in action in a short video:
Link to the source code extension: TYNTS
Link to the demo project: TYNTS
I hope this article will be useful to someone and will inspire you to write useful extensions to Visual Studio.
Good luck to all.
In this article I want to talk about creating extensions for Visual Studio, which helps visualize complex user classes during the debugging process of the application.
Prehistory
In our project, we actively use the domestic geometric core C3D Kernel . This library provides a large number of classes for working with curves, bodies, surfaces, etc. These classes have a complex structure and in the process of debugging an application using standard Visual Studio visualization tools, it is difficult to understand which, for example, the surface is stored in a particular variable. And when debugging complex algorithms, it is very important to understand what happens to the object at each step of the algorithm.
')
We tried to work around this problem in various ways. For example, the coordinates of the points on the leaflet were written out if it was a simple two-dimensional curve. And then on points painted this curve. The second solution to the problem is to save the object to a file at the right time, and then open this file in the test utility supplied with the library. It really helps with debugging, but it requires a lot of manual work. You need to insert the object saving code into a file, recompile the application, perform the necessary actions in the application itself to launch a specific algorithm, then open the saved file in the utility, view the result, add corrections to the algorithm if necessary, and repeat the whole procedure again. In general, it is tolerable, but I wanted to be able, right in Visual Studio in debug mode, to point to the desired variable and to see in a convenient way how the object stored there looks.
Visual studio extension
In search of a solution to this problem, I came across an extension for Visual Studio Image Watch from Microsoft itself for the OpenSource library OpenCV. This extension allows you to view in the process of debugging the contents of variables of the type cv :: Mat, read bitmap'ov. Then the idea came to write a similar extension, but for our types. Unfortunately, it was not possible to find the source code of this extension in open access, which in my opinion is strange. It was necessary to collect information bit by bit on how to write such extensions for Visual Studio. With the documentation on this topic on msdn everything is sad. And there are not many examples, or rather one std :: vector visualizer . Which is still not so easy to find. The essence of the example: visualization on the graph of int numbers lying in std :: vector <int> in debug mode:
Creating an extension
To create extensions you need to install the Visual Studio SDK. After installation, a new project type appears in the project wizard:
The wizard to create a new project will create all the necessary files and configure the project.
I will not repeat the description from the example from Microsoft, the steps for creating an extension are already briefly described there. I recommend everyone interested to look at the description for this example. In this article I wanted to touch on the moments that are not described in this example.
Getting variable value
The variable, the contents of which we want to see, and the extension itself are located in different processes. From this example, it was still unclear how to get data from more complex user types. The example demonstrates the technique when using the IDebugProperty3 interface, we find out the address of the first element in the vector and the address of the last element. By subtracting the addresses, we find the size of the section of memory and then copy this section of memory to our process. I will give here the code from the example:
Getting data from an object
public int DisplayValue(uint ownerHwnd, uint visualizerId, IDebugProperty3 debugProperty) { int hr = VSConstants.S_OK; DEBUG_PROPERTY_INFO[] propertyInfo = new DEBUG_PROPERTY_INFO[1]; hr = debugProperty.GetPropertyInfo( enum_DEBUGPROP_INFO_FLAGS.DEBUGPROP_INFO_ALL, 10 /* Radix */, 10000 /* Eval Timeout */, new IDebugReference2[] { }, 0, propertyInfo); Debug.Assert(hr == VSConstants.S_OK, "IDebugProperty3.GetPropertyInfo failed"); // std::vector internally keeps pointers to the first and last elements of the dynamic array // First get the values of those members. We are going to use them later for reading vector elements. // An std::vector<int> variable has the following nodes in raw view: // myVector // + std::_Vector_alloc<0,std::_Vec_base_types<int,std::allocator<int> > > // + std::_Vector_val<std::_Simple_types<int> > // + std::_Container_base12 // + _Myfirst // + _Mylast // + _Myend // This is the underlying base class of std::vector (std::_Vector_val<std::_Simple_types<int> > node above) DEBUG_PROPERTY_INFO vectorBaseClassNode = GetChildPropertyAt(0, GetChildPropertyAt(0, propertyInfo[0])); // myFirstInfo member points to the first element DEBUG_PROPERTY_INFO myFirstInfo = GetChildPropertyAt(1, vectorBaseClassNode); // myLastInfo member points to the last element DEBUG_PROPERTY_INFO myLastInfo = GetChildPropertyAt(2, vectorBaseClassNode); // Vector length can be calculated by the difference between myFirstInfo and myLastInfo pointers ulong startAddress = ulong.Parse(myFirstInfo.bstrValue.Substring(2), System.Globalization.NumberStyles.AllowHexSpecifier, CultureInfo.InvariantCulture); ulong endAddress = ulong.Parse(myLastInfo.bstrValue.Substring(2), System.Globalization.NumberStyles.AllowHexSpecifier, CultureInfo.InvariantCulture); uint vectorLength = (uint)(endAddress - startAddress) / elementSize; // Now that we have the address of the first element and the length of the vector, // we can read the vector elements from the debuggee memory. IDebugMemoryContext2 memoryContext; hr = myFirstInfo.pProperty.GetMemoryContext(out memoryContext); Debug.Assert(hr == VSConstants.S_OK, "IDebugProperty.GetMemoryContext failed"); IDebugMemoryBytes2 memoryBytes; hr = myFirstInfo.pProperty.GetMemoryBytes(out memoryBytes); Debug.Assert(hr == VSConstants.S_OK, "IDebugProperty.GetMemoryBytes failed"); // Allocate buffer on our side for copied vector elements byte[] vectorBytes = new byte[elementSize * vectorLength]; uint read = 0; uint unreadable = 0; hr = memoryBytes.ReadAt(memoryContext, elementSize * vectorLength, vectorBytes, out read, ref unreadable); Debug.Assert(hr == VSConstants.S_OK, "IDebugMemoryBytes.ReadAt failed"); // Create data series that will be needed by the plotter window and add vector elements to the series Series series = new Series(); series.Name = propertyInfo[0].bstrName; for (int i = 0; i < vectorLength; i++) { series.Points.AddXY(i, BitConverter.ToUInt32(vectorBytes, (int)(i * elementSize))); } // Invoke plotter window to show vector contents PlotterWindow plotterWindow = new PlotterWindow(); WindowInteropHelper helper = new WindowInteropHelper(plotterWindow); helper.Owner = (IntPtr)ownerHwnd; plotterWindow.ShowModal(series); return hr; } /// <summary> /// Helper method to return the child property at the given index /// </summary> /// <param name="index">The index of the child property</param> /// <param name="debugPropertyInfo">The parent property</param> /// <returns>Child property at index</returns> public DEBUG_PROPERTY_INFO GetChildPropertyAt(int index, DEBUG_PROPERTY_INFO debugPropertyInfo) { int hr = VSConstants.S_OK; DEBUG_PROPERTY_INFO[] childInfo = new DEBUG_PROPERTY_INFO[1]; IEnumDebugPropertyInfo2 enumDebugPropertyInfo; Guid guid = Guid.Empty; hr = debugPropertyInfo.pProperty.EnumChildren( enum_DEBUGPROP_INFO_FLAGS.DEBUGPROP_INFO_VALUE | enum_DEBUGPROP_INFO_FLAGS.DEBUGPROP_INFO_PROP | enum_DEBUGPROP_INFO_FLAGS.DEBUGPROP_INFO_VALUE_RAW, 10, /* Radix */ ref guid, enum_DBG_ATTRIB_FLAGS.DBG_ATTRIB_CHILD_ALL, null, 10000, /* Eval Timeout */ out enumDebugPropertyInfo); Debug.Assert(hr == VSConstants.S_OK, "GetChildPropertyAt: EnumChildren failed"); if (enumDebugPropertyInfo != null) { uint childCount; hr = enumDebugPropertyInfo.GetCount(out childCount); Debug.Assert(hr == VSConstants.S_OK, "GetChildPropertyAt: IEnumDebugPropertyInfo2.GetCount failed"); Debug.Assert(childCount > index, "Given child index out of bounds"); hr = enumDebugPropertyInfo.Skip((uint)index); Debug.Assert(hr == VSConstants.S_OK, "GetChildPropertyAt: IEnumDebugPropertyInfo2.Skip failed"); uint fetched; hr = enumDebugPropertyInfo.Next(1, childInfo, out fetched); Debug.Assert(hr == VSConstants.S_OK, "GetChildPropertyAt: IEnumDebugPropertyInfo2.Next failed"); } return childInfo[0]; } Everything would be fine, but here it is shown how to get data from an object, if this data is stored in a single memory location. Apparently, MS itself uses a similar approach in its Image Watch extension. There, the image is also stored in a single piece of memory and there is a pointer to the beginning of this piece.
And what to do if the user type has a complex hierarchical structure and does not look like a regular data array? It is even worse if the class stores pointers to the base classes of other classes. To restore such an object piece by piece seems an impossible task. Plus, this design is very fragile - when you add a new member to an intermediate class, the extension stops working. Ideally, I wanted to get the object itself or its copy. Unfortunately, I have not found a way to do this, while remaining solely within the framework of only one extension. But knowing that the classes we need can serialize themselves into a file or into a buffer in memory, I decided that I could use a hybrid approach: with shared memory and a vector. This solution is not very elegant and requires editing classes, but quite working. Plus, nothing better was invented.
Implementation
The essence of the method:
In each class (which we want to debug), a special class is added that contains one field: std :: vector <char>. In the vector, we will store the marker string, which can then be used to find the serialized object in shared memory. Further, in each non-constant class method we add the call of the function of class preservation to shared memory. Now at each change of a class, it will save itself in shared memory.
In the extension itself: we retrieve a marker string from the object using the method from the MS example. Further, on a marker we get the serialized object from shared memory and we will deserialize it. As a result, we have a copy of the object in our extension. Well, after that is a matter of technology. From the object we obtain useful data and somehow show them in a convenient form.
HabraLine Debug Visualizer
To demonstrate this idea, an example extension was written. The simplest library was also written to demonstrate the work of the extension. There are only two classes in this library: HabraPoint and HabraLine. Plus a couple of classes needed for serialization and work with shared memory. The HabraLine class is just a segment. Boost is used for serialization and work with shared memory. After installing the extension, we have the opportunity to visualize the value of variables of type HabraLine.
You can watch the extension in action in a short video:
Link to the source code extension: TYNTS
Link to the demo project: TYNTS
I hope this article will be useful to someone and will inspire you to write useful extensions to Visual Studio.
Good luck to all.
Source: https://habr.com/ru/post/242231/
All Articles